Optimization on rf devices design applied in wireless communications, C. Alor, & D. H. Covarrubias, 19-26
OPTIMIZATION ON RF DEVICES DESIGN APPLIED IN WIRELESS COMMUNICATIONS C. Alor1 & D. H. Covarrubias2 1
Facultad de Ingeniería Mecánica y Eléctrica , UANL Cd Universitaria, San Nicolás de los Garzas. Nuevo León C.P 64450, México. Email:
[email protected] 2 Grupo de Comunicaciones Inalámbricas Centro de Investigación Científica y de Educación Superior de Ensenada – CICESE Km.107 CARR. TIJUANA-ENSENADA, ENSENADA, B.C. C.P.22860, México. Email:
[email protected]. Received: June 23th 2001 and accepted February 9th 2002
ABSTRACT Third generation (3G) cellular mobile communications demands very strict requirements on transreceptor devices design, in mobile terminal or base station [1]. Particularly, in mobile terminal, design requirements of power amplifier indicate the next parameters: High linearity ( 20 dB), maximum output power (28 dB), by the way of together carry out with the relationship Carrier to Interference (C/I) of 9 dB [2]. In this article, we will present the optimum design of these devices that carrying with such requirements, furthermore, saving more than 20 % of general power consumption in DC RESUMEN La tercera generación de comunicaciones celulares demanda requisitos muy estrictos en el diseño de dispositivos transreceptores para las estaciones de base o móviles. En este artículo presentamos un diseño óptimo de estos transreceptores, que cumplan las altas especificaciones demandadas, ahorrando adicionalmente más del 20% de la potencia consumida en DC KEYWORDS: Power amplifier, mobile communications, mobile terminal. high linearity. low distortion, miminum power consumption.
1. INTRODUCTION In cellular mobile communications systems, the most important quality parameter is the relationship Carrier – Interference(C/I), w here principal focus in such systems have been controlling the interference factor (thermal noise in addition of co-channel interference and adjacent channel) to carry out w ith the imposed limit value of 9 dB in digital systems. On the case of carrier level that depends of the energy isotropic radiated pow er (EIRP), of the antenna gain (mobile terminal and base station), and for propagation profits, the pow er level is the parameter that w e must controlling, trying to reduce the interference level w ith other users, but fundamentally to avoid the appearance of the so feared intermodulation products. We are focused on radio frequency (RF) section design of mobile terminal transreceptors, w ith the objective of optimize the global functioning of the mobile communication systems, starting from optimums design (minimum intermodulation product in second and third order) of RF section in addition of the antenna’s transreceptors mentioned in fig. 1: 27
Journal of Applied Research and Technology
Optimization on rf devices design applied in wireless communications, C. Alor, & D. H. Covarrubias, 27-39
Figure 1. RF section diagram in addition of cellular mobile communications´ antenna according to DoCoMo. Actually, and due to great boom that mobile communication systems had have, are required linear power amplifiers, extremely efficient w ith high rejection to intermodulation products. To realize more efficient the linear amplifiers desired design is important to check the linearity of active elements, that is, transistors as main amplification components. Taking on account the previous, on this article w e w ill focus on RF section design of the mobile terminal transreceptors, w ith the objective of optimize the global functioning of mobile communications systems, starting of optimum design (minimum intermodulation product of second and third order) of the RF section in adding the antenna of transreceptors mentioned [2]. Due of design characteristics and the operation of these devices, it acquire special importance in cellular mobile communications aspects as reduction in pow er consumption, battery time life, w eight and size of pow er amplifiers [2]. 2. MATHEMATIC MODEL OF THE TRANSRECEPTORS PARAMETERS Given the considerations of mobile terminal transreceptor results convenient define the objective parameters of design. The first of them are the linear response parameter of pow er amplifier, which wil be described on this part. Later, w e w ill describe another parameter called analysis of spectral regrowth of w eakly nonlinear pow er amplifier and intermodulation products. 2.1 Linearization principle To verify the linearization principle, results convenient establish the mathematic expression that defines it. For this, w e starting on signal case of tw o tones w ith the same signal pow er, show ed on figure 2.
Figure 2. Linearization of power amplifier Vol. 1 No. 1 April 2003
28
Optimization on rf devices design applied in wireless communications, C. Alor, & D. H. Covarrubias, 27-39
In such figure, is present the behavior of feedback system w ith input x(t) and output y(t). Both are generated using a differential amplifier. Although, such as is show ed on figure, these signals pass through different stages of control elements as: envelope detectors, directional matcher, variable attenuator, phase detector, and at least pow er amplifier w hich w ill be linealized. In this system, in a two tones case, the signal pow er at the input of RF is represented as: ∆ω t cos ( ωct ) 2
(1)
x ( t ) = 2Acos
Where x (t) is input variable, A is the amplitude of individual signal, ω c is the frequency and ∆ω is the space frequency. The characteristics of conversion AM –AM (amplitude modulated – amplitude modulated) of amplifier can be represented by a third order polynomial according to the next expression: y(t ) = a x ( t ) + a ( t )2 + a ( t )3 1 2 3
(2)
Where a1, a2, a3 are the variables that are depending of the input variables. Substituting the value of x (t) in the polynomial, the result is the follow ing: 2 ∆ω ∆ω y( t ) = a 2 Acos t cos ( ωc t) + a 2Acos t cos (ω c t) + 1 2 2 2 3
∆ω + a 2Acos t cos (ω t ) c 3 2
using trigonometric identities, simplifying the previous expression, and supposing an ideal matching on band pass, w ith a total rejection on the signal out of band, although an envelope in perfect form. We can suppose that the envelope of y (t) on the previous expression is: y
env
(t) = a P (t) + 3 a P 3 (t ) 4 3 env 1 env
(3)
This signal completes a feedback cycle, and after some cycles, loop feedback w ill be established as illustrate in figure:
Figure 3. Calculated signals in a normalized case (a) Linear and non-linear envelopes on different signals. (b) Lineal and compensated envelopes.
29
Journal of Applied Research and Technology
Optimization on rf devices design applied in wireless communications, C. Alor, & D. H. Covarrubias, 27-39
2.2 Spectral regrowth analysis of the non-linear power amplifiers The efficiency of pow er amplifier is measuring by the pow er percentage, proportionate by DCsource and delivered to charge; such efficiency can be expressed by the next formula:
η=
Pcarga
(4)
PDC
The high efficiency of pow er amplifier is a necessary requirement on design, and w ith good efficiency may have less interference, it depends about the class of pow er amplifiers to consider, A, B, AB, C, D and EF. When a modulated signal passes through non-linear device, it’s bandw idth w ill expand in uneven order of non-linealities. This phenomenon is called spectral regrow th or spectral regeneration and is caused by the creation of intermodulation products mixed among the components of the individual frequencies of the spectrum [1, 6]. Spectral regrow th causes interference on adjacent channels (ACI), this ACI is measuring by the relationship betw een pow er and adjacent channel (ACPR). Pow er Spectral density (PSD) of a signal that is represented by S (f) such channel assignation is betw een f1 and f2 frequencies and assumes that its adjacent channel is using frequencies w ithin f3 and f4. Where ACPR is defined by: f4 ∫ S(f ) df f3 AC P R = f2 ∫S ( f ) d f f1
(5)
Spectral behavior of pow er amplifiers for w ireless mobile systems can be represented as next graph on figure 4:
Figure 4. Signal regrowth behavior on wireless power amplifiers, (a) ideal case, (b) with distortion The follow ing is a mathematic analysis based on tw o expressions as fundamental base for spectral regrow th. The first of them is a non-linear third order polynomial behavior in conjugated shape and its represented on follow ing formula: y(t) = a x(t ) + a x 2 (t)x * (t ) 1 3
Vol. 1 No. 1 April 2003
(6) 30
Optimization on rf devices design applied in wireless communications, C. Alor, & D. H. Covarrubias, 27-39
Assuming x (t) by media zero and symmetrically distributed, then y (t) is media zero. Our objective wil be expressing the autocorrelation function of y (t), in statistics terms of x (t). That is, in cumulant terms: C
2y
(τ ) = cum{y( t), y * (t + τ)}
(7)
Cumulant, is a tool that w e w ill use here to derivate the forms of closed expressions. Therefore, substituting the expressions (6) and (7) and applying the follow ing property: C
kx
(τ ) = C kt (τ 1 , τ 2 ,...., τ k −1 )
(
= cum x ( t ), x t + τ
1
), x t + τ
2
,... x t + τ
k −1
(8)
w here: τ =( τ1, τ2,....., τk-1) and K is equal to polynomial order. Applying Leonov-Shiryaev formula to remainder terms expression (8). Finally w e obtained the expression for the covariance of the function y (t): C
(τ ) = a1 2y
[
... a a * C 3 1
... a ... a ... a
2 3
C
2x
(τ ) + a1 a 3 * [c 4 x (τ *, τ *, τ ) + 2σ x2 C2 x (τ )] + ...
(0, 0*, τ *) + 2σ x2 C2 x (τ )]+ .....
[C (0,0*,τ,τ *,τ *) + 4C (τ )C (0*,τ, τ *)]+ ... [C (τ )C (0,τ*,τ *) + 2σ C (τ ,τ*,τ *)]+ ... [2σ C (0,0*,τ *) + 4σ C (τ ) + 2C3 (τ )] 6x
2 3
2x
4x
2
2x
2 3
4x
2
4x
2
x
x
4x
4
4x
x
2x
2x
From the previous expression, it can be concluded the next: Spectral regrow th due to non-linearity by third order is clearly exposed by the term C32x(τ) , and is due to a multiplication on time domain, that correspond to a convolution in the frequency domain. Therefore, if probability density function S2x(ω) is for limited band to ωc, so, the output of probability density function S2y(ω) by third order system w ill be limited band to 3ωc . Spectral regrow th each time takes more importance on w ireless mobile communication systems; hence minimize the interference w ithin channels. A significant part on the interferences of w ireless mobile communication systems is due to it creates by multiple transmission frequency combinations, w hereby produces non-linear components. The previous is traduced on unw anted signals, called intermodulation products (PIM) [6]. 2.3 Intermodulation products (PIM) These products are lineal combinations of the original signal frequencies, described as Taylor polynomial: f(x) = a + a + a x 2 + a x3 + a x 4 + ........ 0 1 2 3 4
(9)
31
Journal of Applied Research and Technology
Optimization on rf devices design applied in wireless communications, C. Alor, & D. H. Covarrubias, 27-39
Characteristics of intermodulation on non-linear circuit can be determined through tw o tones analysis. On this method, are introduced to amplifier tw o signals in equal magnitude, and w ith a short separation in frequency, and are determined the levels of the resultant components on the output. Carrying out follow ing approximations for third order PIM on 2ω 1- ω 2 y 2ω 2- ω 1: the amplitude of the signals Vs = Vs1= Vs2, frequencies ω ≈ ω 1 ≈ ω 2 and transference functions H( ω ) ≈H( ω 1) ≈H( ω 2). These approximations are valid for third order products that commonly fall into operation band. Following analysis is for second order products that have sense only w hen it falls w ithin the band. Whereas input signals: V s1cos(ω 1t) y V s2cos(ω 2t) , Assuming the follow ing expression for tw o tones on cosinoidal form: i ' (t) = a V .V H ω H ω cos ω − ω t + φ 2 2 s1 s2 1 2 2 2 1
(10)
Pow er on intermodulation point of second order, can be gotten from P=i 2R in the w ay that dissipate pow er on real part of the charge ZL ( ω 1- ω 2) and assuming that Re{ZL( ω )}=RL is equal to a constant, so w e can obtain the follow ing: 1 4 P = a 2 V 4 H(ω ) R IM2 2 2 s L
(11)
Available pow er for each one of the tones of input and output is obtained as: 2 V P = s av 8R s
(12)
And the pow er on intermodulation point of second order in function of available pow er results: P
= 32a 2 H (ω ) R 2 R P 2 =
P
= 10 log 32a 2 H (ω ) R 2 R + 2P − 30
IM 2
IM 2
4
S
2
(
L av
4
s
2
L
)
(13)
av
On the other hand, assuming the component of third order in 2ω 2 - ω , output currency in this frequency w ill be: 3 3 i ' (t ) = a V 3 H (ω ) cos 2ω − ω t , 3 3 s 1 4
(14)
Where corresponding pow er to third order intermodulation product is obtained as: P
IM 3
=
9 2 6 6 a V H (ω ) R , L 32 3 s
(15)
and it can be expressed in available pow er patterns P av: P
IM 3
Vol. 1 No. 1 April 2003
= 144a 2 H (ω ) R 3 R P 3 6
3
s L av
6
= PIM 3 = 10 log144a32 H (ω ) R 3s R L + 3Pav − 60
32
(16)
Optimization on rf devices design applied in wireless communications, C. Alor, & D. H. Covarrubias, 27-39
These pow ers are given by a graph as figure 5:
Figure 5. Products of intermodulation on power amplifier 3. DESIGN STAGE AND OPTIMIZATION PROCESS Signal transmissions on RF stage through the ports of an antenna, in mobile terminal or base station, are basically limited by distortion and generated by the pow er amplifier and consumpted pow er also, in continuous signal (DC). These parameters are very important on pow er amplifier design, and w ith a handle of them w e are looking for controlling the profits of pow er amplifier located in mobile terminal [2]. In many cases, the distortion can be reduced, but in expenses of increase the pow er dissipation on DC. Therefore, the distortion in the pow er amplifier results on a great output spectral signal. Analysis process of such transistors w as done taking on account: Stability, pow er and answ er of dispersion parameters, Once that selected the best active device, w e proceed to optimization process of power amplifier in class AB[4] and EF[6]. 3.1 Design stage and optimization of pow er amplifier AB. Actually, applied designs to cellular phones, the polarization output currency is varied w ith respect to level of the signal on thoroughly variety, typically by an analog subcircuit of polarization or good use of amplifiers AB characteristics, that is, gathering amplifiers class A characteristics and class B w here it efficiency going of 50 to 78.5 %. Design and optimization process of this amplifier is show ed in figure 6:
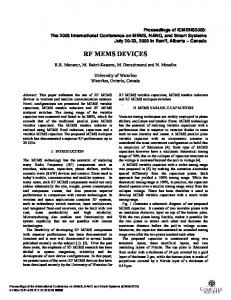
Figure 6. Design and optimization process of hybrid power amplifier class AB Follow ing, on figure 7 are show ed the results of optimization process of gain and attenuation for class AB amplifier w hereas frequency interval betw een 800 MHz to 1900 MHz. 33
Journal of Applied Research and Technology
Optimization on rf devices design applied in wireless communications, C. Alor, & D. H. Covarrubias, 27-39 10
POWER LEVELS (dB)
0 -10
G AIN WIT H OPT IM IZ AT ION G AIN WIT HO UT O PTI MI ZAT IO N REAL G AIN AT ENUAT T IO N W IT H OPT IM IZ AT ION AT ENUAT T IO N W IT HO UT O PTI MI ZAT IO N REAL AT ENU ATT IO N
-20 -30 -40 -50 0.8
0.9
1.0
1.1
1.2
1.3
1.4
1.5
1.6
1.7
1.8
1.9
F REQU ENC Y [GH z]
Figure 7. Behavior of gain and attenuation optimized in class AB amplifier On figure above are show ed the final responses of gain and attenuation obtained by optimization process of class AB amplifier. In such figure, have been included the answ ers for the same parameters to observe the improvements that got through optimization process. Analyzing the parameters of gain, optimized, it carry out w ith imposed demand of 9 dB, w ith an approximately minimum fault of 0.01% in relation w ith reference data of gain, design’s objective, carrying out entirely in all frequency interval from 800 MHz to 1900 MHz. From the same figure, w e be capable of observe the attenuation parameter before and after of have been optimized, and observe that optimized attenuation seems stable in all frequencies interval, with an average value in all bandw idth of - 48.9 dB, response that improves the -42 dB imposed for amplifier design [2], it reflects an reduction in pow er consumed. Obtained values of attenuation and gain, produce an energy saving of 19 % in DC and it is a great amount of energy saving. Therefore, to guarantee that really our device is stable in all frequency interval that interest us, we can do an analysis of optimization process for stability behavior on terms of MU, as show ed in figure 8. 1. 200
AMPLIFIER RESPONSE
1. 125 1. 050 0. 975 0. 900 0. 825 0. 750 0. 675
M u ST ABI LITY FA CTOR WITHOUT OP TIM IZAT ION (CICES E) M u ST ABI LITY FA CTOR WITH OP TIM IZA TION (CICES E) M U STA BI LI TY FACTOR S IM ULA TION (UCS D)
0. 600 0. 525 0. 450 0. 375 0. 300 0. 225 0. 150 0. 075 0. 000 0. 8
0. 9
1. 0
1. 1
1. 2
1. 3
1. 4
1. 5
1. 6
1. 7
1. 8
1. 9
F REQ UEN C Y [GH z]
Figure 8. Optimization of stability factor (Mu) behavior on class AB amplifier In this graph, it is observed the behavior of stability factor of class AB amplifier, before and after of optimization process, as w as w aited and w ith base in behaviors of input and output ports, stability factor,
Vol. 1 No. 1 April 2003
34
Optimization on rf devices design applied in wireless communications, C. Alor, & D. H. Covarrubias, 27-39
it presents an appropriate value of 1.2, and w ith it, is guarantying that proposed design provides appropriate results of stability in all the bandw idth over of value Mu equal to 1. Basing on previous figures, it can be concluded that gain, attenuation, and the matching of the input and output ports of class AB amplifier w ere notably improved. That is that requirements of linearity, distortion, pow er consumption and products of intermodulation of amplifier are suitable and improved on this design. To decide on this optimization process w hich class of amplifier is better to get the best response, results appropriate to do a similar analysis to class EF amplifier. 4. DESIGN STAGE AND OPTIMIZATION OF CLASS EF POWER AMPLIFIER With advances in new technologies of cellular mobile communication systems, also have grow th demands to improve utilities of these systems. We have the interest of analyze a new class of power amplifier to compare it fulfillment w ith other classes of amplifiers described before on this paragraph. The pow er amplifier to w hich w e are doing emphasis on this part is an class EF pow er amplifier, where this amplifier has an high answ er speed, due to it is using CMOS technology ( complementary metal oxide semiconductor) and MESFET (metal semiconductor field effect transistor). Due to characteristics of these transistors, it can be improve the utilities in w ireless mobile communication systems, on figure 9 is show ed employed technique on these amplifiers.
Figure 9. Employed technique on class EF power amplifier. On figure 10 are show ed obtained results of gain and attenuation behaviors of class EF amplifier, before and after of optimization process, consider a frequency interval betw een 800MHz to 1900MHz.
35
Journal of Applied Research and Technology
Optimization on rf devices design applied in wireless communications, C. Alor, & D. H. Covarrubias, 27-39 10
POW ER LEVELS (dB)
POWER LEVELS (dB)
0 G AI N W I T H O P T I M I Z AT IO N G AI N W I T H O U T O PT I M I Z A T IO N
-10
RE AL G A IN AT E N U AT T IO N W IT H O P T IM IZ A T I O N
-20
AT E N U AT T IO N W IT HO UT O P T I M IZ AT IO N RE AL AT EN U AT T I O N
-30 -40 -50 0.8
0.9
1.0
1.1
1.2
1.3
1.4
1.5
1.6
1.7
1.8
1.9
F R E Q U E N C Y [G H z ]
Figure 10. Gain and attenuation behaviors optimized of class EF amplifiers. According to previous figure, doing an analysis w ith base on offered answ ers, gain show s a stable behavior in all frequency intervals w ith a minimum order error 0.005, much better than class AB amplifier. That is, optimized value of gain carry out w ith the conditions of 9 dB imposed from our design in all frequency intervals. With respect to attenuation, observing the answ er on this figure after optimization process, it can be observed that attenuation show s an average value of -49 dB in all bandwidth, answer that has a significant improve on -42 dB imposed from amplifier design [2]. It reflects a diminution on pow er consumption, because w ith a small amount of attenuation is required a small amount of pow er level. Remember, that this parameter is one of the most important on design and optimization of pow er amplifier. Thus, under the attenuation and gain obtained values w e obtain a great amount of energy saving, that is, a saving in pow er consumption of 19.93% on DC.
A MPL IFIER RES PO NSE
AMPLIFIER RESPONSE
Therefore, on class EF amplif ier, to assurance that really our device is stable in all frequency intervals that interest us, w e can do an analysis of the optimization process to verify the behavior of stability on Mu terms, as figure 11. 1.275 1.200 1.125 1.050 0.975 0.900 0.825 0.750 0.675 0.600 0.525 0.450 0.375 0.300 0.225 0.150 0.075 0.000
M u S T A B IL I T Y F A CT O R W I T H O P T I M I Z A T I O N (C I CE S E ) M u S T A B IL I T Y F A CT O R S I M U LA T I O N ( UC S D ) M u S T A B IL I T Y F A CT O R W I T HO U T O P T IM I ZA T IO N (C IC E S E )
0.8
0.9
1.0
1.1
1.2
1.3
1.4
1.5
1.6
1.7
1.8
1.9
F RE QU E N C Y [GH z ]
Figure 11. Optimization of behavior of stability factor Mu on class EF amplifier
Vol. 1 No. 1 April 2003
36
Optimization on rf devices design applied in wireless communications, C. Alor, & D. H. Covarrubias, 27-39
According to show ed graphs on previous figure, as w e w as w aiting and w ith base in behaviors of input and output ports of amplifier, stability factor show s an appropriate value of 1.27, (remaining that, in class AB amplifier w e got a 1.2 value and w ith this value in spite of 1 is guarantying that proposed design provides appropriated and stable results in all bandw idth that interest us). We can concluded, basing on previous figures, that gain, attenuation, and matching on input and output ports of class EF amplifiers show s better results than class AB amplifier results. That is, linearity, distortion, pow er consumption and intermodulation products results are w ithin imposed limits and also are better on class EF amplifier design. 5. CONCLUSIONS According to strict requirements of linearity and pow er consumption on pow er amplifiers on terminals of the cellular mobile systems 2+ and third generation (3G) are necessary that in design of these devices, not only carry out w ith such requirements but also going beyond as for size, battery ´s time life, and the most important that contribute on significant w ay to reach the agreement on digital systems in a relationship C/I of 9 dB. Therefore, w e can conclude that, as part of optimization process w e have improved the answer of power amplifiers, finding as result of our analysis and design, that class EF pow er amplifier is the best as to utilities that it offers to digital cellular mobile communication systems and carry out w ith the parameter of design C/I of 9 dB [1]. On the basis of obtained results w e have to improve the answ er of amplifier as for to: •
Pow er consumption in DC of the 19.93 %.
•
Distortion of -49 dB comparing w ith -42 dB reported.
•
Minimum products of intermodulation due to high linearity and amplifier ´s stability.
•
Maximum carrier level (9 dB)
•
Good matching on input and output ports guaranteed the stability of amplifier w ith reference values less than 1 on the design.
We can summarize as part of numeric analysis on this optimization process, the values obtained for class AB and class EF amplifiers on Table I: Table I Param eters Gain Attenuation Coefficient of Reflection on Input port. Coefficient of Reflection on Output port. VSWR on input port. VSWR on output port. Stability factor Mu Pow er consuption Saving Products of interm odulation 37
CLASS AB 9dB -48.9dB 0.43 0.68 1.3 2.3 1.2 19% Minimum
CLASS EF 9dB -49dB 0.33 0.54 1.2 2.1 1.27 19.93% Minimum Journal of Applied Research and Technology
Optimization on rf devices design applied in wireless communications, C. Alor, & D. H. Covarrubias, 27-39
6. REFERENCES [1]
Covarrubias D., 2000, Notas del curso de maestría CICESE. Octubre.
[2]
Asbeck P., 1999 Linear Pow er Amplifiers, Press-IEEE Press, U.S.A. UCSD.
[3]
Elizabeth G., 2000 “Application of Enhancement Mode Fet Technology for Wireless Subscriber Transmit/Receive Circuits”, Press-IEEE Press,U.S.A .35(9):1276-1284p.
[4]
Park Hyun-Min, 2000 “A Predistorsion Linearizer Using Envelope-Feedback Technique Witch Simplified Carrier Cancellation Scheme for Class-A and Class-AB Pow er Amplifier”, Press-IEEE Press,U.S.A. 48(6):898-904p.
[5]
Tseng peir-Der, 2000 “A 3V Monolithic SiGe HBT Pow er Ampifier for Dual-Mode (CDMA/AMPS) Cellular Handset Applications”, Press-IEEE Press,U.S.A. 35(9):1338-1344p.
[6]
Zhou G.Tong, 2000 “Analysis of Spectral Regrow th of w eakly Nonlinear Pow er Amplifier”, PressIEEE Press,U.S.A. 4(11):357-359p.
Vol. 1 No. 1 April 2003
38
Comunicaciones Móviles Celulares.
Optimization on rf devices design applied in wireless communications, C. Alor, & D. H. Covarrubias, 27-39
Authors Biography
Catarino Alor Aguilar Master on Science on Telecommunications, CICESE, México, and BS on Electronics & Communications Engineer, Universidad Autónoma de Nuevo León, UANL, México. Since 1996 to date is a faculty member of the Electronics & Telecommunications Engineer School at UANL, and since 2001 is leader of telecommunications department. Research Areas: 3G Mobile Communications Systems.
David Hilario Covarrubias Rosales PhD on Telecommunications (Cum Laude) Universitat Politécnica de Catalunya, Barcelona, España. Master on Science on Telecommunications, CICESE, México, and BS on Electronics & Communications Engineer, Universidad Nacional Autónoma de México, UNAM, México. Faculty member of the Electronics & Telecommunications Department, CICESE Research Center , Center of Scientific Research and Higher Education of Ensenada (CICESE), Ensenada, Baja California, México, since June 1984 to date. Research Areas: 3G Mobile Communications Systems and Smart Antenas.
39
Journal of Applied Research and Technology