Abstractâ Submerged arc welding (SAW) process is an essential metal joining .... (500Ã400Ã10) mm cut used oxy-fuel, the material which is widely used in ...
International Journal of Engineering and Advanced Technology (IJEAT) ISSN: 2249 – 8958, Volume-5 Issue-1, October 2015
Optimization Process Parameters of Submerged Arc Welding Using Taguchi Method Zuhair Issa Ahmed, Ali Malik Saadoon
Abstract— Submerged arc welding (SAW) process is an essential metal joining processes in industry. The quality of weld is a very important working aspect for the manufacturing and construction industries, the challenges are made optimal process environment. Design of experimental using Taguchi method (L9 orthogonal array (OA)) considering three SAW parameter are (welding current, arc voltage and welding speed) and three levels (300-350-400 Amp. , 32-36-40 V and 26-28-30 cm/min). The study was done on SAW process parameters on the mechanical properties of steel type comply with (ASTM A516 grade 70). Signal to Noise ratio (S/N) was computed to calculate the optimal process parameters. Percentage contributions of each parameter are validated by using analysis of variance (ANOVA) technique. The experimental results were analyzed by using Minitab 16 software. Keyword-ANOVA, SAW, S/N, Taguchi Method, Welding Process Parameters
I. INTRODUCTION The welding processes are used to joining different materials together. It is economical and faster process compared with other manufacturing process. SAW is the essential semiautomatic welding processes used firstly in 1930s to made good quality of weldment. The various parameters like welding current, arc voltage, wire feed speed, welding speed, torch angle and the electrode stick out are affecting on the weld quality. In this study, the welding process parameter was chosen as welding speed, arc voltage, and welding current. Welding current is a major factor that influences the penetration. Arc voltage and welding speed are also factors that can influence the penetration were studied by Syarul A. et al [1]. Shahnawaz alam et al. [2] Studied the effect of arc voltage, current, welding speed, wire feed rate and nozzle-to-plate distance on weld bead width. Chandel et al. [3] studied the increasing of deposited rate on the welded bead geometry of SAW. Yang et al. [4] studied the effects of SAW process parameters on the weld deposit pool. Optimal parameter combination for bead geometry was studied by Saurav datta et al [5]. Keshav Prasad [6] investigates the influence of the SAW process parameters (welding current and welding speed) on the microstructure, hardness, and toughness of HSLA steel weld joints. S. Kumanan et al. [7] applied Taguchi method and regression to calculate the optimal parameters for SAW. Ravinder Pal Singh et al. [8] present a comprehensive review of parameters of SAW and their effect on weld quality. Murugan et al. [9] studied the relationships between weld bead geometry and shape in SAW of pipes. Tarng and Yang [10] was studies the application of Revised Version Manuscript Received on November 02, 2015. Asst. prof. Dr. Zuhair Issa Ahmed, Mechanical Engineering Department, University of Baghdad, Baghdad, Iraq. Ali Malik Saadoon, Mechanical Engineering Department, University of Baghdad, Baghdad, Iraq.
Taguchi technique in order to optimize the SAW process. Ankita Singh et al. [11] investigated the optimization of bead geometry of SAW using fuzzy based desirability function approach for SAIL Steel, IS 2062. The aim of this paper is to evaluate the effect of process parameters on mechanical properties of low carbon steel ASTM A516 Grade 70 steel, which is used for manufacturing of pressure vessel and boiler steel. It is widely used in nuclear piping systems. SUBMERGED ARC WELDING (SAW) SAW is a consumable electrode arc welding process in which the arc is shielded by a molten slag and the arc atmosphere are generated by decomposition of certain slag constituents. The filler material is a continuously fed wire and very high melting and deposition rates are achieved by using high currents with relatively small-diameter wires. The significant features of the process are: • High deposition rates. • Automatic operation. • No visible arc radiation. • Flexible range of flux/wire combinations. • Normally used for thicknesses above 6 mm. The main applications of SAW are on thick section plain carbon and low-alloy steels and it has been used on power generation plant, nuclear containment, heavy structural steelwork, offshore structures and shipbuilding. The process is also used for high-speed welding of simple geometric seams in thinner sections, for example in the fabrication of pressure containers for liquefied petroleum gas. (SAW) is a multi-objective, multi-factor metal joining technique. Major limitations of SAW are limitation in positions, primarily used for weld mild and HSLA steels [12]. The schematic illustrations of the SAW process and equipment are shown in Figure 1 [13].
Figure1 schematic illustrations of the SAW process and equipment [13]. TAGUCHI METHOD Taguchi’s method is an important tool for the design of experiment used for high quality product in manufacturing system. Orthogonal arrays are a special design by Taguchi method it used to study the process parameter space with only a small number of experiments. Taguchi’s S/N are
149
Published By: Blue Eyes Intelligence Engineering & Sciences Publication Pvt. Ltd.
Optimization Process Parameters of Submerged Arc Welding Using Taguchi Method logarithmic functions of desired output work as objective functions in the optimization process. The S/N helps in analysis of data and prediction of optimal results. In order to evaluate optimal parameter settings, the S/N is the ratio between the mean (Signal) and the standard deviation (Noise).The S/N ratios are used according to desired as follows: Higher is the Better (HB), lower is the better (LB) and Nominal is the Best (NB). Analysis of variance (ANOVA) is one statistical model is done to see which of the process parameters are significant, the Taguchi method provides: • Determining the relations between control factors of design product and the outcomes of process. • Adjusting the mean of a process by optimization the controllable parameter. • Relationship between random noise in the process and product variability. II. EXPERIMENTAL WORK A. Process parameter level There are many welding parameters affect quality of weldment in SAW. In the present study, three process parameters were studies, which are, arc voltage, welding current and welding speed. Three levels for each parameter were considered according from AWS handbook. Selections of welding parameters of each level are shown in Table 1. The design matrix is shown in Table 2. Using Taguchi OA L9 (33) with Eight degree of freedom. Experimental design for the welding parameters and the test results of the HB macro-hardness test and tensile test are shown in Table 3. ……..2.1 Where: HB = Brinell hardness number, P = Applied load, 187.5 kgf, D = Diameter of the steel ball, mm, and d = Average diameter of the indentation, 2.5 mm. Table 1 Input parameters of SAW three parameters and three levels Level Parameter 1 2 3 Welding Current (I) Amperes 300 350 400 Arc Voltage (V) Volts 32 36 40 Welding Speed (S) cm/min 26 28 30 Table 2 L9 OA design matrix showing parameters and levels Welding Welding Trail Arc Voltage, Current, Speed, (S) No. (V)Volts (I) Amp. cm/min 1 1 1 1 2 1 2 2 3 1 3 3 4 2 1 2 5 2 2 3 6 2 3 1 7 3 1 3 8 3 2 1 9 3 3 2
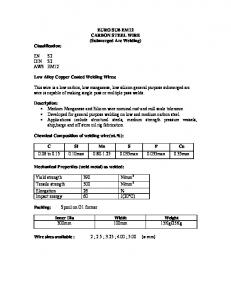
Table 3 L9 OA design and result of HB macro-hardness test and tensile test Welding Welding Arc Ultimate HB Trai Speed, Current, Voltage Test, Hardness l No. (S) (I) Amp. (V),Volt N/mm2 cm/min 1 300 32 26 555 176 2 300 36 28 584 179 3 300 40 30 581 181 4 350 32 28 564 187 5 350 36 30 584 178 6 350 40 26 566 183 7 400 32 30 574 192 8 400 36 26 586 183 588 197 9 400 40 28 B. Materials and Experimental Procedure The base metal used for experimental work was pressure vessel (PV) steel American Society of Mechanical Engineers (ASME) SA516 grade 70 carbon-manganese steel equivalents to ASTM A516. The material was supplied as normalized condition, hot rolled. Nine plates measuring (500×400×10) mm cut used oxy-fuel, the material which is widely used in pressure vessels, tanks and pipeline for petroleum industries. The actual and nominal chemical composition and mechanical properties of (ASTM A516 Grade 70) are shown in Tables 4, 5 respectively. The electrode used for welding was 4 mm diameter copper-coated welding wire which is classified by the American Welding Society (AWS) as No. EM12K the key features of this electrode are, low carbon, medium manganese, and low silicon. The chemical composition of electrode is shown in Table 6. The flux used in the welding was Lincoln F7A2-EMK12, this flux is a highly active flux for handling rust helps resist porosity caused by arc blow, slows freezing slag for good weld. The chemical composition of flux is given in Table 7. The flux was baked for 2 hours at 523 K before use. Table 4 Actual Chemical compositions of base metal C% 0.15
Si% 0.25
Mn% 1.35
P% 0.02
S% 0.01
%Fe Bal.
Table 5 nominal Chemical compositions of base metal %C 0.27
Si% 0.15–0.40
%Mn* 0.79–1.30
%P 0.035
%S 0.035
%Fe Bal.
* “For each reduction of 0.01 percentage point below the specified maximum for carbon, an increase of 0.06 percentage point above the specified maximum for manganese.
150
Table 6 Chemical composition of AWS (EM12K) electrode %C 0.12
%Mn 1.1
%Si 0.23
%S 0.03
%P 0.03
%Cu 0.14
%Fe Bal.
Table 7 Chemical composition of the flux %S iO2 47
%M nO 33
%M gO 17
%C aF2 5
%N a 2O 2
%Al 2O 3 2
%C aO 1
Published By: Blue Eyes Intelligence Engineering & Sciences Publication Pvt. Ltd.
%metal alloy 6 max
International Journal of Engineering and Advanced Technology (IJEAT) ISSN: 2249 – 8958, Volume-5 Issue-1, October 2015 Weld samples are cut from the center of the weld specimen. The transverse face of the samples were polished using standard metallurgical procedure. The polished specimens after cleaning with alcohol are macro-etched using 2%Nital (98% nitric acid + 2% alcohol) solution to view the geometries of the weld bead geometry. Photograph of the experimental setup is shown in Figure 2.
Main Effects Plot for SN ratios Data Means A
B
55.3
Mean of SN ratios
55.2 55.1 55.0 300
350 C
400
26
28
30
32
36
40
55.3 55.2 55.1 55.0
Signal-to-noise: Larger is better
Figure 3 the main effect plot for S/N ratios for ultimate tensile. Analysis of S/N Ratio for HB hardness Higher hardness of material is a desirable property in pressure vessel application. Larger the better option is chosen for signal to noise ratio calculations. Table 9 and Figure 4 show the response Table for S/N ratio. Table 9 Response Table for S/N ratios (larger is better)
Figure 2 Photograph view of experimental setup
Welding Arc Welding Current Voltage Speed 1 45.04 45.34 45.14 2 45.23 45.10 45.46 3 45.60 45.43 45.28 Delta 0.56 0.33 0.32 Rank 1 2 3 From Table 9, optimal parameters setting for larger hardness are, welding current = 400 amp, arc voltage = 40 V, welding speed = 28 cm/min. Level
The analysis of the results will lead to a better understanding of the relationship between SAW process parameters and HB macro-hardness and tensile test, ANOVA and S/N ratio were used to statistical analyses the significance of SAW parameters. Signal-to-noise ratio (S/N ratio) In order to evaluate optimal parameters setting, the S/N ratio performance measure to select control levels that best cope with noise. The S/N ratio calculates the mean (signal) and the standard deviation (noise) of process, the S/N ratios used in this study is the large is better is: …….….. (2) Where: S/N = the ratio of the mean (signal = S) to the standard deviation (noise = N). y = Responses to the given factor level combination. n = Number of responses in the factor level combination.
Main Effects Plot for SN ratios Data Means A
45.45 45.30
1 2 3 Delta Rank
Welding Current
Arc Voltage
Welding Speed
55.17
55.03
55.10
55.14
55.34
55.25
55.31
55.24
55.26
0.17
0.31
0.16
55.17
55.03
55.10
45.00 300
350 C
400
26
28
30
32
36
40
45.60 45.45
45.15 45.00
Larger ultimate tensile is the desirable property of the weld joint. So in case of ultimate tensile, larger the better option has been chosen for calculation of S/N ratio. From Table 8 and Figure 3, the optimal parameters setting for larger ultimate tensile are, welding current = 400 amp, arc voltage = 36 V, welding speed = 30 cm/min.
Level
45.15
45.30
Analysis of S/N ratio for Ultimate Tensile
Table 8 Response Table for S/N ratios (Larger is better)
B
45.60
Mean of SN ratios
III. RESULTS AND DISCUSSION
Signal-to-noise: Larger is better
Figure 4 the main effect plot for S/N ratios for HB macro-hardness. Analysis of Variance (ANOVA) ANOVA is used to identify the SAW parameters that significantly affect the multiple performance characteristics. ANOVA table consists of P- value, degrees of freedom, sums of squares, the F-ratios corresponding to the ratios of two mean squares, and the contribution proportions from each of the control factors. ANOVA for Ultimate Tensile ANOVA Table for ultimate tensile is given in Table 10, that’s indicates the significance value of various input factors. If the
151
Published By: Blue Eyes Intelligence Engineering & Sciences Publication Pvt. Ltd.
Optimization Process Parameters of Submerged Arc Welding Using Taguchi Method p value given in the last column of ANOVA Table is less than 0.05, this means the factor corresponding to that value of p is significant. In present studied the p value for welding current, arc voltage, welding speed are coming lesser than 0.05, so it significant. F value given in ANOVA Table also indicates the significance of factors, higher the F value higher is the significance of that factor. Table 10 ANOVA for ultimate tensile Source Welding Current Arc Voltage Welding Speed Error Total
Seq. D.o.F Adj. SS SS 219.56 219.56 2.0 649.56 649.56 2.0 208.22 208.22 2.0 2.0 8.22 8.22 8.0 219.56 219.56
Adj. MS
2.
3. 4. 5.
6.
F
P 7.
109.78
26.7 0.036
324.78
79.0 0.012
8.
9.
104.11 25.32 0.038
10.
4.11 109.78
26.7 0.036
11.
ANOVA for HB macro- Hardness ANOVA Table for ultimate tensile is given in Table 11, that’s indicates that p values for welding current, arc voltage, welding speed are less than 0.05 when macro-hardness is taken as response, so it significant.
12.
13.
Table 11 ANOVA for HB macro-hardness Source Welding Current Arc Voltage Welding Speed Error Total
Shahnwaz Alam and Mohd.Ibrahim Khan, “Prediction of the Effect of SAW Process Parameters on Weld Bead Width for M.S. 1018 Steel”, (IJEIT) Volume 1, Issue 5, may 2012, 2277-3754. R. S. Chandel, H. P. Seow and F. L. Cheong, J Mater Process Technol, 72 (1997)124-128. L. J. Yang, R. S. Chandel and M. J. Bibby, J. Weld, 72 (1993) 11s-18s. Saurav Datta, Asish Band and Pradip Kumar Pal, “Modeling and optimization of features of bead geometry including percentage dilution in SAW using mixture of fresh flux and fused slag”, IJAMT, 2008 DOI 10.1007/s00170-006-0917-4, 36:1080–1090. Keshav Prasadand and D. K. Dwivedi, “Some investigations on microstructure and mechanical properties of SAW HSLA steel joints”, IJAMT, 2008 DOI 10.1007/s00170-006-0855-1. S. Kumanan, J. K. Gowthaman and Edwin Raja Dhas, “Determination of SAW process parameters using Taguchi method and regression analysis”, IJEMS, vol. 14, June 2007, 177-183 Ravinder Pal Singh, R.K. Garg and D.K. Shukla, “Parametric Effect on Mechanical Properties in Submerged arc welding process - A review”, (IJEST) Feb.2012, Vol. 4 No.02 0975-5462. N. Murugan, V. Gunaraj and J. Mater Process Technology, 168 (2005) 478-487. Y. S.Tarng,; W.H. Yang, studies the “Application of the Taguchi Method to the Optimization of the SAW’. Materials and Manufacturing Processes. 13 (3), 455-467 (1998). Ankita Singh; Saurav Datta; Siba Sankar Mahapatra; Tapan Singha and Gautam Majumdar.: “Optimization of bead geometry of SAW using fuzzy based desirability function approach. J Intell Manuf. DOI 10.1007/s10845-011-0535-3. R.S. Chandel; H.P. Seow; F.L. Cheong, studies the “Effect of increasing deposition rate on the bead geometry of SAW’. (JMPT). 72,124-128 (1999). R.S. Parmar, "Welding Processes and Technology", third edition, Khanna publishers, Delhi, India, P. 221, 2012.
D.o.F Seq. SS Adj. SS Adj. MS F P 2 224 224 112 112 0.009 2 2
78 74
78 74
39 37
2 8
2 378
2
1
39 0.025 37 0.026
IV. CONCLUSION The selection of the process parameters using Taguchi method for SAW welding, with ultimate tensile and HB macro-hardness has been studied. Experimental results have been shown that process parameters are: 1. Optimal parameters setting for ultimate tensile are, welding current = 400 amp, arc voltage = 36 V, welding speed = 30 cm/min. 2. Optimal parameters setting for HB macro-hardness are, welding current = 400 amp, arc voltage = 40 V, welding speed = 28 cm/min. 3. The effect of welding current on mechanical properties was found to be much higher than of the arc voltage and welding speed. ACKNOWLEDGMENT We would like to thank and express our appreciation to Dr. Ahmed A. Al-Khafagi for his assistance and help to accomplishment in this paper. REFERENCES 1.
Syarul Asraf Mohamata, Izatul Aini Ibrahima, Amalina Amira and Abdul Ghaliba, “The Effect of (FCAW) processes on different Parameters”, 2012 (IRIS 2012), 1497 – 1501.
152
Published By: Blue Eyes Intelligence Engineering & Sciences Publication Pvt. Ltd.