Nov 1, 2006 - capacity. The bridge's development extended from a recently completed bridging system study for the US Army Future. Combat System (Bank ...
OPTIMIZED DESIGN AND TESTING OF A PROTOTYPE MILITARY BRIDGE SYSTEM FOR RAPID IN-THEATER CONSTRUCTION Joseph P. Hanus, PE Lieutenant Colonel, US Army University of Wisconsin at Madison Madison, WI 53706
Lawrence C. Bank, PhD, PE Professor, Civil Engineering Department University of Wisconsin at Madison Madison, WI 53706
James C. Ray, PE Research Structural Engineer Engineer Research and Development Center Vicksburg, MS 39180
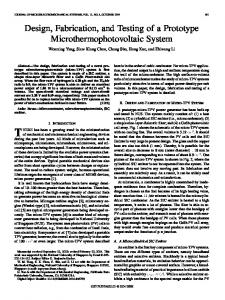
Gerardo I. Velazquez, PE Research Structural Engineer Engineer Research and Development Center Vicksburg, MS 39180 A multi-disciplinary approach to the selection and evaluation process ensured the best concepts were selected for further development (Bank et al., 2005). The concept selected and outlined in this paper involves folding bridge components that are expandable from a transportation configuration into a construction and operational configuration. Although the concept is closely related to some current military bridging systems, the innovative value is in the component details. The concept is shown in general in Figure 1. In Stage 1, the components are deployed to the theater of operations in a folded and/or nested configuration. In Stage 2, the support truss components are expanded, and in Stage 3 the stay-in-place form and reinforcement components are attached. Finally, in Stage 4, a cast-in-place deck with intheater concrete completes the bridge. A unique feature of the final bridge is that the truss top chord is also the deck for vehicles crossing. This critical component is the primary focus of the results presented in this paper. Truss Stay-In-Place-Form and Components Reinforcement Components
ABSTRACT A prototype military bridge system using in-theater concrete with a deployable, folding truss support, and stay-in-place-form system was designed and tested. The bridge’s primary advantage is a reduction in deployment requirements because of the use of in-theater materials. Numerical optimization was used in the design to reduce the deployable component weights. The results showed a potential 50% weight savings compared to the US Army Rapidly Emplaced Bridge. An experimental program investigated the critical deck component capacity, and physical and statistical analysis confirmed the deck has a military load class 70 axle load capacity.
1. INTRODUCTION The US Army Future Force doctrine requires rapidly deployable forces with minimal logistical requirements. The current US military bridging systems are logistically burdensome because they require the deployment of a complete bridge, i.e., all components must deploy from out-of-theater storage sites to in-theater construction sites. An innovative approach to solving this problem is necessary to reduce bridging logistical requirements. This paper will outline the development of an innovative bridge with both deployable and in-theater constructed components. The design parameters, component selection, and design basis using numerical optimization to achieve the minimal component deployment weight are discussed. The physical and statistical analysis of the test results on the system’s critical component confirm it’s crossing capacity.
Stage 1: Transportation Configuration
Stage 2: Expanded Bridge, Truss Support Components
Stage 3: Expanded Bridge with Stay-In-Place Forms and Reinforcement
The bridge’s development extended from a recently completed bridging system study for the US Army Future Combat System (Bank et al., 2005). In that study a wide range of concepts were systematically investigated and analyzed. Innovative materials, components, and systems were studied over a two year research program.
Stage 4: Completed Bridge with Cast-In-Place Deck
Approved for public release; distribution is unlimited.
Fig. 1. Concept Construction Sequence 1
Form Approved OMB No. 0704-0188
Report Documentation Page
Public reporting burden for the collection of information is estimated to average 1 hour per response, including the time for reviewing instructions, searching existing data sources, gathering and maintaining the data needed, and completing and reviewing the collection of information. Send comments regarding this burden estimate or any other aspect of this collection of information, including suggestions for reducing this burden, to Washington Headquarters Services, Directorate for Information Operations and Reports, 1215 Jefferson Davis Highway, Suite 1204, Arlington VA 22202-4302. Respondents should be aware that notwithstanding any other provision of law, no person shall be subject to a penalty for failing to comply with a collection of information if it does not display a currently valid OMB control number.
1. REPORT DATE
2. REPORT TYPE
01 NOV 2006
N/A
3. DATES COVERED
-
4. TITLE AND SUBTITLE
5a. CONTRACT NUMBER
Optimized Design And Testing Of A Prototype Military Bridge System For Rapid In-Theater Construction
5b. GRANT NUMBER 5c. PROGRAM ELEMENT NUMBER
6. AUTHOR(S)
5d. PROJECT NUMBER 5e. TASK NUMBER 5f. WORK UNIT NUMBER
7. PERFORMING ORGANIZATION NAME(S) AND ADDRESS(ES)
8. PERFORMING ORGANIZATION REPORT NUMBER
University of Wisconsin at Madison Madison, WI 53706 9. SPONSORING/MONITORING AGENCY NAME(S) AND ADDRESS(ES)
10. SPONSOR/MONITOR’S ACRONYM(S) 11. SPONSOR/MONITOR’S REPORT NUMBER(S)
12. DISTRIBUTION/AVAILABILITY STATEMENT
Approved for public release, distribution unlimited 13. SUPPLEMENTARY NOTES
See also ADM002075., The original document contains color images. 14. ABSTRACT 15. SUBJECT TERMS 16. SECURITY CLASSIFICATION OF: a. REPORT
b. ABSTRACT
c. THIS PAGE
unclassified
unclassified
unclassified
17. LIMITATION OF ABSTRACT
18. NUMBER OF PAGES
UU
8
19a. NAME OF RESPONSIBLE PERSON
Standard Form 298 (Rev. 8-98) Prescribed by ANSI Std Z39-18
2.
The deck component consists of the structural elements above the support component. This component includes deployed and in-theater materials. The stay-inplace form and reinforcement sub-component was designed with pultruded glass fiber-reinforced-polymer material that included plates and structural shapes for longitudinal and transverse stiffness. This material represents the state-of-art for light-weight bridging material. A commercially available sub-system, the GridForm System by Strongwell, was selected. This system had been successfully tested as a stay-in-place form and reinforcement system at the University of Wisconsin-Madison for use in Federal Highway Administration Innovative Bridge Research and Construction projects (Bank et al., 2006; Berg et al., 2006; Ringelstetter et al., 2006). A specific GridForm system was selected for its stiffness and strength characteristics. The selected system consisted of longitudinal 2-inch T-bars, with ½ inch diameter transverse bars, epoxied to a 1/8th inch plate. The longitudinal T-bar spacing was determined using numerical optimization while the transverse bar spacing was set at 4 inches based upon successful testing of similar systems.
BRIDGE DESIGN
2.1 Design Parameters The bridge was designed for Military Load Class (MLC) 30, which is the assumed classification for the US Army Future Combat System (Boeing, 2006). However, the design was checked with respect to overloading for an M1 tank, i.e., MLC 70. The bridge was designed to span 48 feet, which is based upon current US Army temporary bridging systems, i.e., the Wolverine and Rapidly Emplaced Bridge Systems (Connors et al., 2006-2007). The intent is for the new bridge to replace these current systems as a semi-permanent to permanent bridge. Additionally, the predominate length of bridge gaps in potential theater of operations includes 48-ft spans, according to a 2003 Bridge Study by the US Army Maneuver Support Center, Fort Leonard Wood, Missouri. The design and analysis focused on a single treadway, which carries half the required load. Two treadways is the simplest configuration (Fig. 2) or a full-width system is possible with three parallel treadways (Fig. 3). 48 ft
Concrete procured in-theater would be cast into the stay-in-place-form and reinforcement system. The concrete was assumed to be a standard 4,000 psi compressive strength mix with no additives. The US Army Mobile Concrete Mixer was the assumed transport and mixing vehicle with a material capacity of 8 cubic yards (Fig. 4) (United States. Dept. of the Army., 1979).
5 ft
13 ft 5 ft
Fig. 2. Treadway System 15 ft
Fig. 3. Full Width System 2.2. Component Selection The two primary components in the bridge are the support and the deck components. Several different materials and sub-components were considered, and the selection process considered strength to weight ratios and immediate application for testing, i.e., commercially available materials and sub-components were preferred.
Fig. 4. US Army Mobile Concrete Mixer 2.3 Design Basis The design basis was a composite of the US Army and civilian design codes. The US Army’s Military Nonstandard Fixed Bridging Field Manual was used to determine the required loadings for MLC 30, which included a single axle load, multiple axle loads, and a tank uniform load (United States. Dept. of the Army., 2002). This manual also identified load factors for live and dead load (1.7 and 1.4, respectively), a dynamic load allowance (15%), and the effective width for concrete decks (4ft + 0.06 Lspan). The US Army’s Trilateral Design and Test Code (TDTC) for Military Bridging and Gap-Cross Equipment was used to identify the material factors for the aluminum components (0.75 for yielding and 0.67 for
The support component, consisting of the structural elements below the deck, was configured as a truss with the ability to fold for deployment and expand for construction. The primary focus was on the strength and stiffness of this component during construction and operation of the bridge. The support component was designed with 7005 T53 aluminum, which is commonly used in military bridging. Hollow circular tube sections were selected to reduce the component weight while maintaining sufficient buckling resistance.
2
buckling) and the minimum treadway width of 5 feet for MLC 30 bridges (United States. Dept. of the Army., 1996). The Aluminum Association Design Manual was used to establish the strength limit state equations for the aluminum components (tensile and compression) (Aluminum Association., 2005). The American Concrete Institute’s “Guide for the Design and Construction of Structural Concrete Reinforced with FRP Bars was used to establish the material factors (0.65 for over-reinforced flexure and 0.75 for shear) and strength limit state equations (flexure, flexural shear, and punching shear) for the FRP deck components ” (American Concrete Institute., 2006).
3.
3.2 Support Component Optimization The support component was optimized as a nonlinear constrained problem (Haftka et al., 1992). The objective was to minimize the deployment weight, which was a function of the members’ cross-sectional area and lengths. The variables include the truss panel spans (48, 72, and 96 inches), the deck depth (4.25 to 10.25 inches), member cross-sectional areas and node locations. The vertical locations of truss nodes varied continuously in the optimization model. The upper chord nodes were limited by a maximum deck slope of 3% and the lower chord nodes were limited by a minimum gap depth of 48 inches. The constraints in the support component optimization were in accordance with the design basis and included deflection and strength limit states. The deflection limit was span/100, which was 5.76 inches. The strength limit states included tension and compression with appropriate reductions to prevent member buckling. The deck compression limit in the truss model was f’c/10. This constraint limited the deck compression stress to ensure sufficient capacity to act primarily as a flexural member in the deck component optimization. The member cross-sectional areas were related to the radius of gyration based upon commonly available sections and a 10:1 ratio of diameter to wall thickness.
NUMERICAL OPTIMIZATION
3.1 Objective and Trade-Off Decisions The optimization objective was to minimize the weight of the deployable components, i.e., support components, and stay-in-place-form and reinforcement components. A wide range of optimization techniques were considered, e.g., discrete vs. continuous, geometric vs. material, etc. However, the trade-off of rigorous theoretical optimization for practical application was required to advance the concept to experimental testing. The structural optimization analysis focused on a linear elastic analysis in the critical structural state with a cracked deck. This state assumed that the continuous cast deck was cracked at the truss nodes such that each deck component spanned between truss nodes in a pin-pin support configuration. The transition between the continuous deck and pin-pin deck would redistribute forces from the deck into the truss and shift negative end moment magnitudes to the center of deck spans. Hence, the pin-pin support configuration resulted in the largest truss forces and greatest center of deck span moments.
The required loadings for MLC 30 were applied to the system with multiple load cases for each axle, truck, and track loading. The load cases were applied sequentially to upper truss nodes, which simulated vehicles crossing the bridge. Hence, the number of constraints was multiplied by the number of load cases. For example, for the 48 inch truss panel system there were 111 constraints for each of the 45 load cases, which resulted in 4,995 constraints in the optimization model. A MATLAB program was written with the fmincon function to find the local minima within the design space. This function uses a Sequential Quadratic Programming (SQP) based optimization method with a BroydenFletcher-Goldfarb-Shanno (BFGS) algorithm for the Hessian estimation (MathWorks, 2006). The optimization results are shown in Figure 5 as continuous functions for each truss panel length with respect to a deck depth. There is a set of member cross-sectional areas and node locations for each discrete point on the functions.
The truss panel spans in the support component were set at discrete values of 48, 72, and 96 inches. The selection of these span lengths was based upon currently available stay-in-place-form systems. The cast-in-place deck depth range was from 4.25 to 10.25 inches. The 4.25 inch bound was based on minimal structural capacity. The 10.25 inches represented the capacity of two Mobile Concrete Mixers (United States. Dept. of the Army., 1979) for two treadways. Each mixer has the capacity to cast two 5.125 inches treadway decks.
As shown in Figure 5, the support component behavior indicated local minima at the deck depths of 6.40, 5.84, and 5.79 inches for the truss panel lengths 48, 72, and 96 inches, respectively. The associated support component weights for each of these minima were 538, 496, and 475 lbs, respectively. These values represent the ideal weight for the support component for a single
The bridge system optimization was decomposed into the two components for analysis and results combined for a total treadway system weight. The decomposition simplified the numerical optimization and provided insight into the individual component behavior which would have been masked in a single optimization model. 3
weight at 5.125 inch deck depth was 1,432 lbs, with a truss panel span of 72 inches and T-bar spacing of 3.00 inches. It was preferred to limit the number of mixers to one and sacrifice 122 lbs in total weight.
treadway. With each weight there is an associated set of cross-sectional areas and nodes, for the minimum deck depth for a particular truss panel length. 3.3 Deck Component Optimization
700
Support Component Weight (lb
The deck component was also optimized as a nonlinear constrained problem (Haftka et al., 1992). The objective was to minimize the deployment weight, which was a function of the reinforcement spacing and stay-inplace-form depth. The variables include the truss panel spans (48, 72, and 96 inches), the deck depth (4.25 to 10.25 inches), and spacing of the longitudinal T-Bars. The spacing variable was bound by the manufacturer’s limits of 1.2 to 12 inches. Multiple fabrication jig combinations were available and the spacing variable was left continuous between the limits with further refinement possible later in the analysis.
600 48 inch 72 inch 96 inch
500
400 4
The constraints in the deck component optimization were in accordance with the design basis and included deflection and strength limit states. The construction deflection limit was span/180, the live load deflection limit was span/100, and the strength limit states included flexural, flexural-shear, and punching shear. The single axle load was the most critical MLC 30 loading and it was applied at the center of the deck span between simple supports in the optimization model.
5
6
7 8 9 Deck Depth (inches)
10
11
12
Fig. 5. Support Component Optimization Results 1400
Deck Component Weight (lb)
1300
A second MATLAB program with fmincon was written to run the deck optimization model (MathWorks, 2006). The results of the optimization are shown in Figure 6 as continuous functions for each truss panel length with respect to the deck depth. There is a T-bar spacing for each discrete point on the functions. Note – the deck component weight includes only the elements which deploy, not the cast-in-place in-theater concrete.
1200 1100 1000 900
96 inch 72 inch 48 inch
800 700 4
The optimization did not find local minima within the deck depth range of 4.25 to 10.25 inches. However, the behavior indicates the functions are approaching local minima beyond a deck depth of 10.25 inches.
5
6
7 8 9 Deck Depth (inches)
10
11
12
Fig. 6. Deck Component Optimization Results
Support and Deck Component Weight (lb
1,800
3.4 Combined Component Optimization The combined support and deck component optimization results are shown in Figure 7. The minimum total system weight, across all the variables, was 1,310 lbs. The associated variable values were a truss panel span of 72 inches, a deck depth of 9 inches, and a T-bar spacing of 7.48 inches. Additionally, there was a set of support system cross-sectional areas and node locations with this minimum weight. However, further consideration was given to these results with respect to a practical implication. The depth of 9 inches requires two Mobile Concrete Mixers. The maximum deck depth for one Mobile Concrete Mixer is 5.125 inches. The minimum
1,700
1,600
1,500
1,400
96 inch 48 inch 72 inch
1,300 4
5
6
7 8 9 Deck Depth (inches)
10
Fig. 7 Combined Optimization Results 4
11
12
4.
EXPERIMENTAL PROGRAM
The critical component in the bridge was the deck because it is a non-traditional component in terms of material and structural application. It was fabricated with state-of-the-art pultruded glass fiber-reinforced-polymer material, and in the bridge it acts as the deck and top chord of the truss. Hence, it was the focus of the initial experimental program to investigate the bridge feasibility. 4.1 Objectives The experimental program's primary objective was to confirm the capacity of the optimized deck component. The testing was designed to investigate two primary variables in a replicated two-level factorial experiment. The variables in the investigation were axial load application and the addition of synthetic fibers to the castin-place concrete deck. The axial load application was chosen as a variable because the design basis did not explicitly address this member type. The compression stress in the deck was limited in the numerical optimization such that the flexural condition would dominate in the design. However, the effect of the axial load was not specifically included in the deck component optimization process. Hence, testing for its effect was important to understanding the deck component behavior. The addition of fibers to the concrete was also included because of the potential benefits. These fibers are commonly added to concrete for durability, crack control, and early strength development. However, their effect on the deck component strength was not known; hence, inclusion in the testing was needed. Both testing variables represented design elements that were not accounted for explicitly in the numerical optimization models because their effects were unknown. Such variables were ideal for the experimental program.
Fig. 8. Stay-In-Place Form and Reinforcement
Fig. 9. Stay-In-Place Forms Prepared to Cast Decks The specimens were tested with transverse loading that represented the MLC 30 axle load and tire pressure area. The specimens were then loaded until failure. Half of the specimens also included an axial load in accordance with the numerical optimization model: A = 0.85T + 14.5 (kips)
(1)
where A = applied axially load (kips), T = applied transverse load (kips).
4.2 Experiments
Figure 10 shows a specimen in the transverse only load frame and Figure 11 shows a specimen in the transverse and axial load frame. The transverse load was applied with a 200 kip hydraulic actuator and the axial load was applied with two 120 kip hydraulic jacks in a horizontal internally constrained load frame. The horizontal frame was designed to ensure the end rotations were free such that the results could be compared to the transverse only loaded specimens without end constraint effects. Both load frames represented simply supported deck components that would develop once negative moment cracking would occur above the truss panel points. It was assumed that such cracking would eventually occur in the system and the critical deck structural loading would occur in the simple supported configuration between truss panel nodes.
The deck specimens in the experiments were based upon the numerical optimization results. The specimens were 5 feet wide, 5.125 inches deep, and spanned 72 inches. The stay-in-place form and reinforcement system included longitudinal 2-inch T-bars spaced at 3 inches with transverse ½ inch diameter rods spaced at 4 inches. A 1/8-inch plate was epoxied to the bottom to act as the specimen’s form-work (Fig. 8). The specimens were constructed on simple supports that spanned 72 inches (Fig. 9), which simulated the in-field deck component casting on the support components. The nominal concrete compressive strength was 4,000 psi as it was in the numerical optimization model. A blended polypropylene fiber material was added at 5 lb per cubic yard to 4 of the 8 specimens for the fiberreinforced-concrete (FRC). 5
design equation was flexural shear followed by punching shear and then flexure. Hence, because the test specimens surpassed the flexural and punching shear design basis, they developed the larger flexural capacity. Additionally, the concrete strain at failure was an average of 4400 x 10-6, which is greater than the 3000 x 10-6 used in the flexural design basis equation. Also, the nominal concrete strength used in the flexural design basis equation was 4,000 psi; whereas the average strength was 5,410 psi. Hence, the effect of these design factors and assumptions contributed to the specimens’ over-strength. The load versus deflection graphs for the tests are shown in Figure 12. The specimens had an average deflection at ultimate load of 1.22 inches, which correlates to a span/60 for the 72 inch specimens. However, at the MLC 30 (13.5 kips) the average deflection was 0.086 inches or span/837, and at MLC 70 (25.5 kips) the average deflection was 0.176 inches or span/409. Both values meet the design requirements.
Fig. 10. Transverse Only Loaded Specimen
# 1 2 3 4 5 6 7 8
Fig. 11. Transverse and Axially Loaded Specimen Strain gages and displacement instrumentation were attached to the specimen to record the behavior and confirm consistent testing protocol. The specimens were constructed and tested in a random order to facilitate statistical analysis with an assumed experimental error normal distribution about zero.
Table 1. Test Results Concrete Ultimate Axial Strain FRC Load Load at Ultimate (kips) (x10-6) Yes No 83.2 4460 Yes No 90.1 4320 Yes Yes 80.6 3720 Yes Yes 81.2 4780 No No 96.8 3860 No No 90.9 3990 No Yes 98.0 4300 No Yes 89.6 5780 Average 88.0 4400
Concrete Strength (psi) 4910 5160 5530 5930 5130 5160 5620 5860 5410
100 80 Load (kips)
The eight specimens failed in a similar manner with flexural failure due to concrete crushing along the center of slab span. The failure was identified with center span cracking and associated concrete strains beyond the design value of 0.003. The ultimate loads, concrete strain at ultimate, and concrete strength are shown in Table 1.
60 40 20
4.3 Physical Analysis of the Results
0 0.0
The specimens exceeded the required axle load for MLC 30, i.e., 13.5 kips. The over capacity was due to the optimization design basis equations and assumptions. The specimen failure mode was flexural with concrete crushing. The concrete crushing was the result of the over-reinforced section, which was predicted in the flexural design basis equation. However, the controlling
0.2
0.4
0.6
0.8
1.0
Deflection (in)
Fig. 12. Deflection versus Load
6
1.2
1.4
The overall behavior of the specimens was nearly linear to failure. This type of non-ductile failure is not preferred, but is inevitable in over-reinforced FRP sections. The inherent safety factor of ductile members is replaced with larger factors of safety in such sections (Bank, 2006).
# 1 2 3 4 5 6 7 8
4.4 Statistical Analysis of the Results Statistical analysis of the results provided a qualitative confidence level to drawing conclusions with respect to the effects of the experiment variables and their effect on specific yields. In this test, the axial load and fiber reinforced concrete effects were analyzed with respect to the ultimate load. The ultimate load is the primary concern with the deck component design. The analysis procedure was in accordance with design of experiments techniques (Box et al., 1978). The confidence interval to test significance was based upon a Studentized M-Test alpha of 10% as follows: (100 − α )CI = Effect ± M (SE )
Table 3. Test Results Ultimate Load Actual Fitted Model (kips) 83.2 83.775 90.1 83.775 80.6 83.775 81.2 83.775 96.8 93.825 90.9 93.825 98.0 93.825 89.6 93.825
Specimen Axial Load Yes Yes Yes Yes No No No No
Residuals -0.575 6.325 -3.175 -2.575 2.975 -2.925 4.175 -4.225
The error assumption of IIDN((0,σ2). i.e., independently tests, identically tested, and distributed normally, was checked. The residual normal plot (Fig. 13) and the plot of the residuals with respect to test order (Fig. 14) were used in validating the error assumption. The assumption was accepted because residual values were normally distributed and did not display any patterns with respect to run order.
(2)
Residuals
where M = Studentized M-Test Value, 2.98, SE = standard error, 3.096 based upon a pooled variance, CI = confidence interval, 90%. The test variables were determined to be significant if their effect was beyond the confidence interval calculation in Eq (2), i.e., 2.98(3.096) = 9.225. The two variables and their combined effects are shown in Table 2 with the results of the significance tests.
8 6 4 2 0 -2 0 -4 -6 -8
20
40
60
80
100
Sample Percentile
Fig. 13. Normal Plot of Residual Values
Residuals
Table 2. Significance Test Term Effect Significance Test Axial Force -10.050 Yes Fiber Reinforced -2.900 No Concrete (FRC) Combined Effect of -2.850 No Axial Force and FRC Based upon the results only the axial force had a significant effect on the ultimate load. The fitted model with the grand mean and coefficient for the axial load effect was established as follows:
8 6 4 2 0 -2 -4 -6 -8 0
1
2
3
4 5 Run Order
6
7
8
Fig. 14. Residuals versus Run Order 4.5 Integrated Physical and Statistical Analysis
(3) y = 88.0 ± 5.025 x1 + ε ij ij where x1 = binary value of +1 without axial load and -1 with axial load, εij ~ error assumed IIDN(0,σ2).
Based upon the statistical results, the four specimens with axial load should be considered for establishing an assured capacity for the optimized deck component. The average and standard deviation of the four specimens with axial load were 83.8 and 4.36 kips, respectively. These four specimens included two with FRC and two without FRC. However, as statistically proved, the FRC did not significantly affect the specimen’s ultimate load.
Estimated fitted values for each test and associated residuals were calculated. The residuals represented the difference between the actual test and the fitted model. The results are shown in Table 3. 7
American Concrete Institute., 2006: Guide for the Design and Construction of Structural Concrete Reinforced with FRP Bars. ACI; 440.1R-06, American Concrete Institute, 44 pp. Bank, L. C., 2006: Composites for Construction: Structural design with FRP materials. John Wiley & Sons, 551 pp. Bank, L. C., J. S. Russell, J. P. Hanus, J. C. Ray, and G. I. Velaquez, 2005: Conceptual Studies for Rapidly Deployable Battlespace Gap Structures. W912H2-04P-0150, 182 pp. Bank, L. C., M. G. Oliva, J. S. Russell, D. A. Jacobson, M. Conachen, B. Nelson, and D. McMonigal, 2006: Double Layer Prefabricated FRP Grids for Rapid Bridge Deck Construction: Case Study. ASCE Journal of Composites for Construction, 10, 201-121. Berg, A. C., L. C. Bank, M. G. Oliva, and J. S. Russell, 2006: Construction and Cost Analysis of an FRP Reinforced Concrete Bridge Deck. Construction and Building Materials, 20, 515-526. Boeing: 2006 FCS Briefing Book. [Available online from www.boeing.com/defense-space/ic/fcs.html.] Box, G. E., J. S. Hunter, and W. G. Hunter, 1978: Statistics for Experimenters: An introduction to design, data analysis, and model building. Wiley, 653 pp. Connors, S. C. and C. F. Foss, Eds., 2006-2007: Jane's Military Vehicles and Logistics. 27th ed. Jane's Information Group, 1098 pp. Haftka, R. T. and Z. Gürdal, 1992: Elements of Structural Optimization. 3rd ed. Solid mechanics and its applications, Kluwer Academic Publishers, 481 pp. MathWorks, 2006: Optimization Toolbox, for use with MATLAB. The MathWorks, 478 pp. Ringelstetter, T. E., L. C. Bank, M. G. Oliva, J. S. Russell, F. Matta, and A. Nanni, 2006: Development of CostEffective Structural FRP Stay-in-Place Formwork System for Accelerated and Durable Bridge Deck Construction. Transportation Research Record, Washington, DC, National Research Council, 16 pp. United States. Dept. of the Army., 1979: Technical Manual 5-3895-372-10 for Concrete Mobile Mixer. Headquarters, Dept. of the Army, 176 pp. ——, 1996: Trilateral Design and Test Code for Military Bridges and Gap-Crossing Equipment. US Army Tank-Automotive and Armaments Command, 118 pp. ——, 2002: Field Manual 3-34.343 for Military Nonstandard Fixed Bridging. Headquarters, Dept. of the Army, 552 pp. ——, 2006: Technical Manual 5-5420-280-23&P for Rapidly Emplaced Bridge. Headquarters, Dept. of the Army, 956 pp.
5. CONCLUSIONS Several conclusions can be made from the numerical optimization and experimental program results for the innovative bridging system presented herein. The numerical optimization results indicate that significant weight savings can be achieved with this concept as a semi-permanent bridge. The US Army Rapidly Emplaced Bridge System (REBS) weighs nearly 11,000 lb (United States. Dept. of the Army., 2006). The numerical optimization results indicate a single deployable treadway could weigh less than 1,500 lbs. Although this is an ideal optimized weight, a reasonable assumption could be made that a full system, i.e., two treadways, with fully designed lateral support and connection details could weigh less than half of the REBS bridge system. As a result, when assault bridging systems are removed from gap crossing sites, two of the new bridges could be deployed for use as a semi-permanent bridge for the weight of one REBS. The physical and statistical analysis of the experimental results establishes the assured capacity of the optimized deck component at 75.1 kips (mean minus two standard deviations). This capacity provides an overall safety factor of 5.6 and 2.9 for MLC 30 and 70, respectively. The presented bridge requires additional analysis and testing, which is planned. Multiple deck component behavior, i.e. cracking across the truss nodes, and the connections between the deck and support components must be investigated. Additionally, the support component deployability must also be investigated. The results of these investigations and the results presented herein establish the significant potential of this bridge concept. Successful development of this innovative military bridge system will support the US Army Future Force doctrine and provide mobility support to US Army Future Combat System in future theaters of operation.
ACKNOWLEDGEMENTS The work reported herein was an extension of the US Army Battlespace Gap Defeat Project (Bank et al., 2005). FRP material was donated by Strongwell and concrete fiber reinforcement was donated by Propex Concrete Systems. The axial load frame was fabricated by Palmer Manufacturing with Enerpac hydraulic load equipment. The work was performed in the Structures Testing and Materials Lab at the University of Wisconsin – Madison. Permission to publish was granted by Director, Geotechnical & Structures Laboratory, US Army COE. REFERENCES Aluminum Association., 2005: Aluminum Design Manual: Specifications & Guidelines for Aluminum Structures. Aluminum Association, 568 pp. 8