16th European Signal Processing Conference (EUSIPCO 2008), Lausanne, Switzerland, August 25-29, 2008, copyright by EURASIP
OPTIMIZED SINGLE-VIEWER MODE OF MULTIVIEW AUTOSTEREOSCOPIC DISPLAY Atanas Boev, Mihail Georgiev, Atanas Gotchev and Karen Egiazarian Department of Signal Processing, Tampere University of Technology P. O. Box 553, FI-33101, Tampere, Finland phone: + 358 3 3115 4349, fax: + 358 3 3115 3857, email:
[email protected] web: sp.cs.tut.fi
ABSTRACT We propose an approach for optimizing the visual quality of a multiview 3D display for a single viewer. The approach combines eye-position tracking system with on-thefly visual optimization of multiview image content. The tracking algorithm uses the video input from a pair of offthe-shelf web-cameras and employs fast and robust face and facial feature detection algorithms to provide features for the subsequent stereo matching and distance estimation. Based on display measurements and having user’s eyes position, the following visual improvements are achieved: continuous head parallax for wide range of observation angles, cross-talk mitigation and brightness enhancement for a single viewer, and multi-view image compensation related to the distance of the observer. 1.
INTRODUCTION
Autostereoscopic displays form a modern trend in 3D visual technology area [1], [2], [3]. They are particularly attractive since they do not require the observer to wear special glasses while perceiving 3D scenes. Two types of auto-stereoscopic displays are most common. The first type works by tracking the observer’s eyes, and utilizes steerable (active) optics to beam different images towards each eye. Such displays are meant to be used by a single observer. The second type uses fixed optics, and beams a number of different images (views) in different directions; the directions are selected in such way, that the eyes of an observer standing in front of the screen perceive different images. This type can be used by multiple observers. The two types are known as creating eye-gaze-related image and fixed-plane image correspondingly [2], or as head position tracking displays, and multiview displays [3]. In this contribution we suggest an approach aimed at optimizing the latter type of displays for single observer. Based on empirical knowledge about the fixed optics effects, we design a system, which determines the observer’s position with respect to the display and steer the played images in a proper manner. 2.
MULTIVIEW DISPLAYS
Multiview displays use TFT screens for image formation [2][5]. The light generated by the TFT is split into multiple directions by the means of special optical layer (called also
lens plate or optical filter) mounted in front of the TFT. The intensity of the light rays passing through the filter changes as a function of the angle, as if the light is directionally projected [2], [5]. TFT displays recreate the full palette of colours in a scene by emitting light though red, green and blue coloured components (sub-pixels). The optical filter redirects the light of the sub-pixels towards different positions, as shown in Fig. 1a. eye-tracking cameras R G B R G B R G B
screen
1 2
1 2
1 2
1R
1R
a)
left eye
right eye
b)
screen L 1L
R
visibility 8R zones 1R 8L 1 2 34567 8 right eye
left eye
c)
2
1
d)
Figure 1 - Autostereoscopic displays: a) Optical filter, separating the image into multiple views; b) “active” 3D display with steerable optics; c) “passive” multiview 3D display; d) slanted optical filter.
Sub-pixels, visible from a particular direction, form an image also known as a view [2], [5]. Differently coloured components of one pixel belong to different views and one view is a combination of colour components (sub-pixels) of various pixels across the TFT screen. A group of red, green and blue sub-pixels that are visible from the same direction and appear close to each other are perceived as one fullcolour pixel. Such pixel, referred to as poxel [6], is a building block of the view seen from that direction. For every poxel, there is a certain angle, from which it is perceived with maximal brightness – we call that angle optimal observation
16th European Signal Processing Conference (EUSIPCO 2008), Lausanne, Switzerland, August 25-29, 2008, copyright by EURASIP
angle for the poxel. The vector, which originates at the poxel, and follows the optimal observation angle, is the optimal observation vector for the poxel. The active 3D displays use steerable optical filter and accommodate to the head movement of the user by continuously updating the position of the filter in respect to the TFT screen. Such displays use eye-tracking in order to point images precisely to the eyes of the observer. Typically, such displays create only two views, and are meant for a single observer (Fig. 1b), but initial steps are done towards development of a multiuser 3D display with steerable optics [3], [7]. R
G
B
R
G
B
R
G
B
R
R
G
B
R
G
B
R
G
B
R
R
G
B
R
G
B
R
G
B
R
R
G
B
R
G
B
R
G
B
R
R
G
B
R
G
B
R
G
B
R
R
G
B
R
G
B
R
G
B
R
R
G
B
R
G
B
R
G
B
R
R
G
B
R
G
B
R
G
B
R
R
G
B
R
G
B
R
G
B
R
a) 1 1 2 3 4 5 6 7 8 9 10 11 12 13 14 15 16 17 18 19 20 21 22 23 24
2
b) 3
4
5
6
7
8
r g b r g b r g b r g b r g b r g b r g b r g b 1 2 3 4 5 6 7 8 1 2 3 4 5 6 7 8 1 2 3 4 5 6 7 8 2 3 4 5 6 7 8 1 2 3 4 5 6 7 8 1 2 3 4 5 6 7 8 1 2 3 4 5 6 7 8 1 2 3 4 5 6 7 8 1 2 3 4 5 6 7 8 1 3 4 5 6 7 8 1 2 3 4 5 6 7 8 1 2 3 4 5 6 7 8 1 2 4 5 6 7 8 1 2 3 4 5 6 7 8 1 2 3 4 5 6 7 8 1 2 3 4 5 6 7 8 1 2 3 4 5 6 7 8 1 2 3 4 5 6 7 8 1 2 3 5 6 7 8 1 2 3 4 5 6 7 8 1 2 3 4 5 6 7 8 1 2 3 4 6 7 8 1 2 3 4 5 6 7 8 1 2 3 4 5 6 7 8 1 2 3 4 5 6 7 8 1 2 3 4 5 6 7 8 1 2 3 4 5 6 7 8 1 2 3 4 5 7 8 1 2 3 4 5 6 7 8 1 2 3 4 5 6 7 8 1 2 3 4 5 6 8 1 2 3 4 5 6 7 8 1 2 3 4 5 6 7 8 1 2 3 4 5 6 7 8 1 2 3 4 5 6 7 8 1 2 3 4 5 6 7 8 1 2 3 4 5 6 7 1 2 3 4 5 6 7 8 1 2 3 4 5 6 7 8 1 2 3 4 5 6 7 8 2 3 4 5 6 7 8 1 2 3 4 5 6 7 8 1 2 3 4 5 6 7 8 1 2 3 4 5 6 7 8 1 2 3 4 5 6 7 8 1 2 3 4 5 6 7 8 1 3 4 5 6 7 8 1 2 3 4 5 6 7 8 1 2 3 4 5 6 7 8 1 2 4 5 6 7 8 1 2 3 4 5 6 7 8 1 2 3 4 5 6 7 8 1 2 3 4 5 6 7 8 1 2 3 4 5 6 7 8 1 2 3 4 5 6 7 8 1 2 3 5 6 7 8 1 2 3 4 5 6 7 8 1 2 3 4 5 6 7 8 1 2 3 4 6 7 8 1 2 3 4 5 6 7 8 1 2 3 4 5 6 7 8 1 2 3 4 5 6 7 8 1 2 3 4 5 6 7 8 1 2 3 4 5 6 7 8 1 2 3 4 5 7 8 1 2 3 4 5 6 7 8 1 2 3 4 5 6 7 8 1 2 3 4 5 6 8 1 2 3 4 5 6 7 8 1 2 3 4 5 6 7 8 1 2 3 4 5 6 7 8 1 2 3 4 5 6 7 8 1 2 3 4 5 6 7 8 1 2 3 4 5 6 7
c)
d)
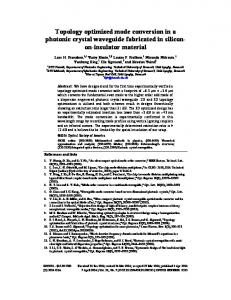
Figure 2 - Slanted optical filter: a) slanted lenticular sheet, b) slanted parallax barrier, c) sub-pixels, which belong to one view and d) interspersed viewing regions of the views
Passive 3D displays generate group of views by using fixed optics. For a large number of head positions, the observer’s eyes fall into the visibility zones of different views and perceive a scene at different angles as depicted in Fig. 1c. Two types of optical filters are commonly used – lenticular sheet [4] which redirects the light by refraction, and parallax barrier [5] which works by blocking the light in certain directions. The optimal observation vectors for all poxels of the same view are designed to intersect in a tight spot in front of the multiview display, as marked with “1” in Fig. 1d. From this spot, the view is perceived with its maximal brightness, this is the view’s optimal observation spot. Outside the optimal observation spot, there is a range of observation angles, from which a given view is still visible, even though with diminished brightness. We refer that range to as the visibility zone of a view. Since binocular depth cues require horizontal disparity, most multiview displays have their views ordered in horizontal direction as well. When moving in horizontal direction in front of the screen, the observation point will fall into the visibility zone of each view in a con-
secutive order. As the observation point moves past the visibility zone of the last view, the first view comes into visibility again, as shown in Fig. 1c. The same set of subpixels is visible from a number of angles – for example the same image will be seen from observation angles labeled “1” and “1R” on Fig. 1a. Slanted optical sheet (Fig. 2a) or slanted parallax barrier (Fig. 2b) have been used to ensure smooth transition between the visibility zones and to balance the horizontal vs. vertical resolution of a view. While generally improving the visual quality, such solution introduces problems on its own. Due to the slant, there is specific correspondence of the pixels which belong to a certain view and the addressable sub-pixels of the display. In order to visualize multiple images on a multiview display, the images should be combined and their pixels reordered, following the configuration of sub-pixels belonging to each view. Such process is called interdigitation [2] or interzigging [8]. Each view should be resampled on a nonorthogonal grid similar to the one shown in Fig. 2c. Such resampling requires specially designed anti-aliasing filters, thoroughly studied in [8]. Another consequence of the slanted optical filter is interspersing of the viewing regions. Any observation spot falls into the viewing zones of different views, as depicted in Fig. 2d. As a result, images which belong to many views are simultaneously visible, even with a single eye, which can be regarded as inter-view crosstalk. The crosstalk manifests itself as multiple contours around object shapes, scattered in horizontal direction. More detailed study of crosstalk in multiview 3D displays has been presented in a previous work [9]. Being optimized to produce images with acceptable quality for a wide range of observation positions, a multiview display should work equally well for single or multiple observers. As such, it does not require computationally demanding real-time eye-tracking. However, if such eyetracking functionality is presented, the visual quality can be further optimized for particular observation point. For a single observer, when the position and distance to the screen are known, a visually improved image can be delivered using suitable image transformations. We present such an approach in the following two sections. 3.
EYE-POSITION TRACKING SYSTEM
3.1 System overview In order to determine the position of the viewer’s eyes we have developed a stereo-vision application working on stereo-camera video streams. The development has been inspired by similar systems [7], [22]. While we have used standard approach to stereo vision, we also employed our original techniques for face and facial feature detection. In our system, the input data is taken simultaneously from two identical cameras placed in known position near the display (Fig. 3). The system includes modules for camera calibration, rectification, face and facial detection and tracking and stereo-matching (Fig. 4a). While a single observer is looking at the display, the system returns face position in surrounded tracking windows in the two cameras and the positions of pupils and philtrums inside windows. The dis-
16th European Signal Processing Conference (EUSIPCO 2008), Lausanne, Switzerland, August 25-29, 2008, copyright by EURASIP
parity between the tracked pupils and philtrums are used as clues to estimate depth. The application has been developed in C++ utilizing computer vision functions from the OpenCV library [17].
screen L 1L
R
8L 1 2 3 left eye
1R 45 6 7 8
8R
right eye
Figure 3 – Eye-position tracking setting For camera calibration, we have followed the approach in [18] and utilized a camera calibration toolbox [19]. The calibration module estimates and saves camera parameters for focal length, principal point, skew and lens distortions. These parameters are subsequently applied for rectification and lens distortion correction [20]. Rectified images facilitate the stereo-matching and depth estimation, turning it to 1Dtype of triangulation. In our application, we used off-theshelf cameras and performed precise stereo disparity measurements using an optical calibration marker from different positions to the cameras to obtain the disparity-to-depth relation function. Additionally, a simple depth-map estimator utilizing facial landmarks has been implemented to visualize the 3D position of the tracked face [21]. The distance between the cameras is 6cm, and each camera captures in QVGA resolution. The angle, at which the user observers the screen is estimated with precision greater than 0.3 degrees, which is 5 times greater than the visibility zone of each view (Fig. 1c). The accuracy, with which the distance between the observer and the display is estimated, is value dependant as shown in Fig. 4b. We further describe our face and facial detection modules. 3.2 Face detection The face detection module applies a two-stage hybrid technique. First, image areas having colour close to skin colour are detected and candidate face areas are determined. Second, feature-based face detection is performed in a slidingwindow mode for the candidate areas only. The skin detection algorithm utilizes two histogram coltracking cameras
3.3 Facial feature detection The facial detection module employs Dual-Tree Complex Wavelet Transform (DT-CWT) features and Bayesian classifier to detect three facial landmarks: the two pupils and the philtrum (the region between nose and mouth). The DTCWT has been chosen as a low-cost alternative to Gabor transform for real-time feature extraction implementation [15], [16]. In our setting, the DT-CWT coefficients have been used to form landmark jets. Consider a spatial area of 16x16 pixels around a landmark. A four-scale DT-CWT is applied to this area, with six differently-oriented sub-bands per scale. The jet is composed by twenty four matrices with dimensions as shown in Fig. 4c. Each of these matrices contains the magnitude of the sub-band coefficients in the neighbourhood of the landmark of interest in the face image.
20
Stereo Capture and Image Preprocessing Lens Distortion Correction Rectification Face & Facial Feature Detector Stereo Matching and Disparity Estimation Depth Calibration
Estimation accuracy (cm)
R
L
Camera Calibration Parameters Estimation
our models for the skin and non-skin respectively [10]. The histograms have been calculated using training skin and nonskin images in HSV colour space, for the chrominance channels (2-D histograms). A maximum likelihood ratio threshold is used to classify the processed pixel as skin colour pixel or non-skin colour pixels [11]. Connectivity analysis is carried out to eliminate background pixels and to unite skincolour pixels. Thus, face candidate areas are formed and the subsequent face detection is run for these areas only. The second stage is a feature-based face detection, which operates on the luminance channel of the colour image. It is a modification of the adaptive boosting algorithm [12], used recently by Viola and Jones [13] for simultaneously finding the best set of significant features of the pattern of interest (the face) and training a suitable classifier for that pattern. In our modification, optimal atomic decompositions are selected from various dictionaries of anisotropic wavelet packets to provide an adequate feature extraction [14]. Then, the adaptive boosting algorithm [12] is applied for finding the optimal subset of atoms. In contrast to the original Voila and Jones’ threshold-type of weak learner, we employ a Bayesian-type of weak learner. It leads to a final strong classifier being able to place non-convex and even non-closed decision boundaries [14]. The cascade combination of skin-colour detection and Adaboost type of classification makes the whole system very fast and reliable.
15
10
5
0 50
Facial Depth Estimation
a)
75 100 125 150 175 200
Distance from the screen (cm)
b)
c)
Figure 4 – Eye-position tracking: a) block-diagram of the system, b) Feature jet based on DT-CWT and c) depth estimation accuracy
16th European Signal Processing Conference (EUSIPCO 2008), Lausanne, Switzerland, August 25-29, 2008, copyright by EURASIP
VIEW OPTIMIZATION
One disadvantage of multiview displays is the limited parallax freedom in multi-user mode, i.e. the same set of views can be observed from different angles. For example, if different users are positioned in the areas, marked with “L” and “R” in Fig. 1c, they would see the same 3D image. If there is only one observer, different images can be shown when the user stays in the central, “L” or “R” areas, and as result the user would see the same 3D scene from different angles. Furthermore, if the views are gradually updated with observations of the scene from new angles, this would produce a 3D scene with continuous parallax as the user changes his position in respect to the screen. For example, when the user’s head is positioned as seen in Fig. 1c, he perceives a combination of views with numbers between 2 and 7. If the user moves to the left, views 1, 2 and 3 show the 3D scene at the same angles as before, and views from 6 to 8 (now seen in area “L”) are updated with observations of the scene from new angles. As the position of the user’s eyes is tracked, the content of the views can be continuously updated to allow the user to observe the same 3D scene from wider range of angles. Typically, a multiview display has lower brightness and contrast compared to 2D display of the same class since the light coming from the former is distributed between the views. Also, the observation zones of the neighbouring views are interspersed (Fig. 2d) which creates “ghosting” artefacts and deteriorates the quality of a 3D scene [2]. The plot in Fig. 5a shows the visibility of different views across different observation angles, while the plot in Fig. 5b depicts the visibility of different views for one observation point [9]. Each view is mainly affected by light contribution from its two immediate neighbours. Consider a test image, in which all pixels of one view are green, all pixels of its left neighbouring view are red, and all pixels of its right neighbour are blue; all other views are black. Various combinations of these three colours are visible on the display from different observation points, due to the cross-talk. The effect is illustrated in Fig. 5c. If the position of the observer is known, re-arranging
1
S4
1 2 3 4 5 6 7 8
0.8 0.6 0.4
0.8 0.7
0.5 0.4
0.2
0
5
10 15 20 25 observation point
S3
0.3
0.1
0.2 0
S5
0.6
visibility visibility
4.
the images contained in the different views can simultaneously increase the brightness and mitigate the crosstalk for the given observation angle. For example, if the observer is positioned as in Fig.1c, his left eye would see a combination of views 2, 3 and 4, and his right eye would see a combination of views 5, 6 and 7. When no eye-tracking is used, views 2, 3 and 4 contain different observation of the same scene, allowing an observer to see 3D effect regardless of the exact position of his head. However, a mixture of these different observations result in multiple contours around object shapes (i.e. cross-talk generated “ghosting” artefacts). When eyetracking suggests the left eye of the observer is in the visibility zone of view 3, views 2, 3 and 4 can be prepared to contain the same image – the one intended to be seen in view 3. This way, instead of creating double edges, the light of views 2 and 4 would merely contribute to the overall brightness of view 3. If similar steps are done for views 5, 6 and 7, the user would perceive fully stereoscopic scene, with increased brightness and reduced “ghosting” artefacts.
visibility
For modeling a particular landmark class, we have trained Gaussian mixture model (GMM) for each sub-band in the jet [16]. Referring to Figure 4b, each matrix slice in the jet will be represented by a GMM after training leading to 6x4 = 24 models. We have used utmost 5 Gaussian components for each slice. Three classes are distinguished corresponding to pupil, philtrum and non-landmark respectively. The Gaussian mixture models for each class have been trained by supervised learning. Then, they are used as class likelihoods in the discriminant function of Bayes classifiers with equal priors for each class. For classifying a test point in a face as belonging to one of the three classes, we compute the transform jet and extract each slice in the jet and evaluate it against the models of the three classes corresponding to the same level and direction as the slice. The matrix slice belongs to the class yielding the maximum discriminant. The classification results of every individual slice in the jet are combined to decide the class of the test point.
30
0
15
15
hor
is o 10 n ta
screen y
a)
al
10
l a x5is
t ic e rx vscreen
5 0
16
ax
is
0
b)
c) Figure 5 – Crosstalk in multiview displays: a) visibility of views vs observation angle, b) visibility of views from single observation point vs screen coordinates, c) test images photographed from distances (from left to right) 90cm, 120cm, 150cm (optimal), and 180cm
The optical filter of a multiview display works by passing light penetrating it at a certain angle. However, different parts of the screen surface are seen at slightly different angles, and the filter is designed to allow all sub-pixels belonging to a certain view to be seen from one spot, as marked with “1” in Fig. 1d (the optimal observation spot for that view). From an observation point closer to the screen, as the one marked with “2” in the figure, different combination of sub-pixels is seen. In the central part of the display the same sub-pixels are seen through the optical filter as before. Close to the right edge of the screen, instead of the sub-pixels seen before, their right neighbours are visible. Following the sub-pixel map from Fig. 2c, these are the pixels which belong to the view number next in the order. Similarly, the left neighbours of the previously seen sub-pixels would be seen close to the right edge of the screen. For example, when observing from the optimal observation point of view 4, the subpixels belonging to that view are predominantly seen along the whole surface of the screen, as shown in Fig. 5c. When moving closer to the display, parts of view 3 are predominantly seen close to the left edge, and parts of view 5 dominate around the right edge, as seen in the same figure. Moving away from the
16th European Signal Processing Conference (EUSIPCO 2008), Lausanne, Switzerland, August 25-29, 2008, copyright by EURASIP
display causes the neighbouring pixels of the opposite side to be predominantly seen. When the distance between the display and the observer is known, the 3D scene can be compensated for the given depth by redirecting the sub-pixels to a neighbouring view in the opposite direction. For an observation point closer than the optimal, sub-pixels along the right end of the image should be redirected to a view with smaller number and the ones along the left edge to a view with greater number. The correspondence between the observation distance and the amount of redirection varies across the screen surface, and can be approximated by a series of test measurements. More details about such measurements are given in [23]. 5.
CONCLUSIONS
We have proposed a system for optimizing the visual quality of a multiview 3D display for a single viewer. We have embedded fast and robust face and facial feature detection algorithms to provide features for stereo matching and subsequent eye position detection. We have utilized previously measured display characteristics such as cross-talk and distance-dependent interdigitation topology deviations to achieve continuous head parallax for wide range of observation angles, cross-talk mitigation and brightness enhancement for a single viewer, and multi-view image compensation related to the distance of the observer. 6.
ACKNOWLEDGMENTS
This work is supported by EC within FP6 under Grant 511568 with the acronym 3DTV and by the Academy of Finland, project No. 213462 (Finnish Centre of Excellence program (2006 - 2011). We thank Harish Essaky Sankaran, Vladislav Uzunov, Isabela Serano, and Pauli Tuomola for providing source codes for face and facial feature detection. REFERENCES [1] L. Onural, T. Sikora, J. Ostermann, A. Smolic, M. R. Civanlar and J. Watson: “An Assessment of 3DTV Technologies,” NAB Broadcast Engineering Conference Proceedings 2006, pp. 456-467, Las Vegas, USA, April 2006. [2] S. Pastoor, “3D displays”, in (Schreer, Kauff, Sikora, edts.) 3D Video Communication, Wiley, 2005. [3] P. Surman, K. Hopf, I. Sexton, W.K. Lee, R. Bates, “Solving the 3D problem - The history and development of viable domestic 3-dimensional video displays”, In (Haldun M. Ozaktas, Levent Onural, Eds.), Three-Dimensional Television: Capture, Transmission, and Display (ch. 13), Springer Verlag, 2007. [4] C. van Berkel, D. Parker and A. Franklin, “Multiview 3D LCD,” in Proc. SPIE Vol. 3012, pp. 32-39, 1996. [5] A. Schmidt and A. Grasnick, "Multi-viewpoint autostereoscopic displays from 4D-vision", in Proc. SPIE Photonics West 2002: Electronic Imaging, vol. 4660, pp. 212221, 2002. [6] D. Marr and T. Poggio, “Cooperative computation of stereo disparity”, Science, vol. 194, pp. 283-287, 1976.
[7] P. Surman, I. Sexton, K. Hopf, W. K. Lee, R. Bates, W. Ljsselsteijn, E. Buckley, ‘Head tracked single and multi-user autostereoscopic displays’, Proc of Visual Media Production, 2006. CVMP 2006. 3rd European Conference, pp.144-152, 2006. [8] J. Konrad and P. Angiel, “Subsampling models and anti-alias filters for 3-D automultiscopic displays”, IEEE Trans. Image Processing, vol.15, no.1, pp. 128-140, Jan. 2006. [9] A. Boev, A. Gotchev and K. Egiazarian: “Crosstalk Measurement Methodology for Auto-Stereoscopic Screens”, IEEE 3DTV Conference, Kos, Greece, May 7-9, 2007. [10] M.J. Jones and J.M. Rehg, ‘Statistical color models with application to skin detection’, Int. Journal of Computer Vision, vol. 46, No. 1, 2002, pp. 81-96. [11] I. Serano and P. Tuomola, Skin color based image preprocessing, Tech. report, Tampere University of Technology, January 2006. [12] Y. Freund and R. Schapire, “A Decision-Theoretic Generalization of Online Learning and an Application to Boosting”, Journal of Computer and System Sciences, vol. 55, no. 1, pp. 119-139, 1997. [13] P. Viola and M. Jones, “Robust Real-Time Face Detection”, International Journal of Computer Vision, vol. 57, no. 2, pp. 137-154, 2004. [14] V. Uzunov, A. Gotchev, K. Egiazarian, J.Astola “Face Detection by Optimal Atomic Decomposition”, Proceedings of the SPIE, Volume 5916, pp. 160-171 (2005). [15] N G Kingsbury, Complex wavelets for shift invariant analysis and filtering of signals, Journal of Applied and Computational Harmonic Analysis, vol. 10, no 3, May 2001, pp. 234-253. [16] H. Essaky Sankaran, A. Gotchev, K. Egiazarian, and J. Astola, “Complex wavelets versus Gabor wavelets for facial feature extraction: a comparative study”, Proceedings of SPIE, vol. 5672, pp. 407-415, 2005. [17] Open Source Computer Vision Library, available online at http://www.intel.com/technology/computing/ opencv/”. [18] J. Heikkila and O. Silven “A Four-step Calibration Procedure with Implicit Image Correction”, in proc. Comp. Vision and Patt. Recogn., pp.1106-112, June 1997. [19] K. Strobl, and W. Sepp, “Camera Calibration Toolbox”,http://www.dlr.de/rmneu/en/desktopdefault.aspx/tabid-3925/ [20] A. Fusiello, “Tutorial on Rectification of Stereo Images”, University of Udine, Italy, available at http://homepages.inf.ed.ac.uk/rbf/CVonline/LOCAL_COPI ES/FUSIELLO/tutorial.html, [21] S. Birtchifield, C. Tomasi, “Depth Discontinuities by Pixel-to-Pixel Stereo”, in Comp. Vision 6th Int. Conf., pp. 1073-1080, January 1998. [22] faceLAB 4, http://www.seeingmachines.com/ [23] A. Boev, A. Gotchev, K. Egiazarian, ’Visual Artefacts caused by slanted lenticular sheets in multiview displays: a reverse engineering experience’ submitted to Journal of Advances in Signal Processing.