Send Orders for Reprints to
[email protected] Combinatorial Chemistry & High Throughput Screening, 2017, 20, 1-8
1
RESEARCH ARTICLE
Optimized Virtual Screening Workflow: Towards Polynomial Scoring Functions for HIV-1 Protease
Target-Based
Val Oliveira Pintroa and Walter Filgueira de Azevedo Jr a,b,* a
Laboratory of Computational Systems Biology, School of Sciences, Pontifical Catholic University of Rio Grande do Sul, Av. Ipiranga, 6681 Partenon Porto Alegre-RS, Brazil, 90619-900; bGraduate Program in Cellular and Molecular Biology, School of Sciences - Pontifical Catholic University of Rio Grande do Sul (PUCRS), Av. Ipiranga, 6681, Porto Alegre-RS 90619-900, Brazil Abstract: Background: One key step in the development of inhibitors for an enzyme is the application of computational methodologies to predict protein-ligand interactions. The abundance of structural and ligand-binding information for HIV-1 protease opens up the possibility to apply computational methods to develop scoring functions targeted to this enzyme.
ARTICLE HISTORY Received: July 31, 2017 Revised: November 3, 2017 Accepted: November 7, 2017 DOI: 10.2174/1386207320666171121110019
Objective: Our goal here is to develop an integrated molecular docking approach to investigate protein-ligand interactions with a focus on the HIV-1 protease. In addition, with this methodology, we intend to build target-based scoring functions to predict inhibition constant (Ki) for ligands against the HIV-1 protease system. Method: Here, we described a computational methodology to build datasets with decoys and actives directly taken from crystallographic structures to be applied in evaluation of docking performance using the program SAnDReS. Furthermore, we built a novel function using as terms MolDock and PLANTS scoring functions to predict binding affinity. To build a scoring function targeted to the HIV-1 protease, we have used machine-learning techniques. Results: The integrated approach reported here has been tested against a dataset comprised of 71 crystallographic structures of HIV protease, to our knowledge the largest HIV-1 protease dataset tested so far. Comparison of our docking simulations with benchmarks indicated that the present approach is able to generate results with improved accuracy. Conclusion: We developed a scoring function with performance higher than previously published benchmarks for HIV-1 protease. Taken together, we believe that the approach here described has the potential to improve docking accuracy in drug design projects focused on HIV-1 protease.
Keywords: Docking, HIV-1 protease, machine learning, drug design, SAnDReS 1. INTRODUCTION Type 1 human immunodeficiency virus (HIV-1) protease (HIV-1 PR) is an important target for development of antiHIV drugs, for reviews see [1, 2]. The HIV-1 PR is an aspartyl protease and its activity is required for cleavage of the Gag and Gag-Pol polyprotein precursors during virion maturation, producing mature proteins in the infectious HIV virion. Differently from other aspartyl proteases [3], the structure of the HIV-1 protease has a dimeric quaternary structure [4,5]. The HIV PR is composed of two symmetrical identical subunits (each 99 residues long) [5]. Each monomer consists of three domains: a flap domain (residues 33-62), a core domain (10-32 and 63-85), and a terminal domain (1-4 and 96-99). *Address correspondence to this author at the Laboratory of Computational Systems Biology, School of Sciences - Pontifical Catholic University of Rio Grande do Sul (PUCRS), Av. Ipiranga, 6681, Porto Alegre-RS 90619-900, Brazil; Tel/Fax: ++55-51-3353-4529; E-mails:
[email protected];
[email protected] 1386-2073/17 $58.00+.00
From the computational systems biology standpoint, HIV-1 PR comprises an attractive biomolecular system for an integrated analysis of three-dimensional information and ligand-binding affinity data. There are 490 crystallographic structures for HIV PR deposited in the Protein Data Bank (PDB) [6], search carried out on July 26th 2017. Since PDB allows to filter data for inhibition constant (Ki), we can join structural information with affinity data and build up a dataset with experimentally determined structures for which binding affinity data is known. This wealth of functional and structural information opens the possibility for application of computational biology methods [7], in order to create a mathematical model to predict ligand-binding affinity for this target protein. Several computational studies have been previously conducted on HIV-1 PR, for recent studies see [8-12]. As far as we know, this is the first time that an extensive proteinligand docking simulation (over 70 crystallographic structures used for validation purposes) and targetedpolynomial scoring function development have been carried © 2017 Bentham Science Publishers
2 Combinatorial Chemistry & High Throughput Screening, 2017, Vol. 20, No. 9
Pintro and Azevedo Jr
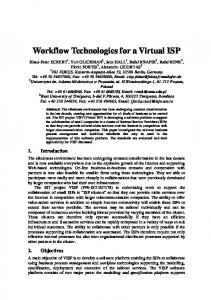
out for HIV PR. The main objective of the present work is to integrate the structural and binding affinity data to build polynomial scoring functions targeted to the HIV-1 PR system. We aim to use standard scoring functions (MolDock and PLANTS scores) as terms of a polynomial equation and through supervised machine learning techniques to build a targeted-based scoring function for HIV-1 PR. In addition, we also propose an integrated molecular docking approach to investigate the correlation of docking results with scoring functions. This approach is based on the program SAnDReS [13] and uses as docking engine the Molegro Virtual Docker [14]. Moreover, we built a new dataset with decoy and active ligands and employed a novel polynomial scoring function to rank results of a virtual screening using this dataset to evaluate the performance of polynomial function as a binary classifier system. Analysis of the prediction performance using enrichment factors and receiver operating characteristic (ROC) curve is presented here. We also carried out comparisons with previously published benchmarks for HIV-1 PR [15, 16]. 2. METHODS 2.1. Docking In the present study, we applied Molegro Virtual Docker (MVD) [14, 17, 18] and SAnDReS [13] to carry out proteinligand docking simulations. All ligands were prepared using default charge values for the program MVD. Protein atomic charges were defined according to default parameters of MVD. For all structures in the dataset, the one with highest crystallographic resolution was chosen as the most adequate for re-docking simulations. MVD has four search algorithms: MolDock Optimizer (MDO) (based on differential evolution [19]), MolDock Simplex Evolution (MDSE) (a modified algorithm based on Nelder-Mead local search algorithm [20]), Iterated Simplex (IS) (based on Nelder-Mead algorithm), and iterated simplex with ant colony optimization (ISACO) based on the method proposed elsewhere [21]. In addition, MVD has four scoring functions, which are described in the next section. For each scoring function, it is possible to consider water molecules in the biological system. Taken together, we can represent the combination of search algorithm, scoring functions, and the presence of water molecules as a binary tree represented in Fig. (1). For each protocol represented in the Fig. (1), 500 poses were generated and the one with lowest score is considered the best pose for the simulation. 2.2. MVD Scoring Functions MVD makes use of fast scoring functions to evaluate pose binding energy, MolDock Score (EMolDock Score) and PLANTS Score (EPLANTS). These functions are described elsewhere [14, 22, 23]. We also calculated the scoring functions using MVD for each structure in the ensemble, using the crystallographic
Fig. (1). Binary tree representing 32 docking protocols. In the tree, S represents each of the four search algorithms: MDO, MDSE, IS, and ISACO. For each algorithm, we have two scoring functions (P: PLANTS Score and M: MolDock Score). For each scoring function, we can have grid option (G) or non-grid option (N). The grid-based scoring functions pre-calculate potential-energy values on an evenly spaced cubic grid in order to speed up calculations. In addition, we also have a simulation without water (D) or with waters (W).
position of the active ligand. Our goal here is to test the accuracy of scoring functions in predicting binding affinity. All atomic charges for ligands and receptors in the dataset were assigned as described in the previous section. 2.3. SAnDReS Workflow For analysis of docking results, we used the program SAnDReS [13]. Initially, we used the SAnDReS program to retrieve Ki information from the PDB, this data is expressed in nM (10-9 M). Calculation of statistical parameters such as correlation coefficients (Spearman’s rank (ρ) and Pearson’s (R) correlation coefficients), p-values, maximum, minimum and mean values was carried out using SAnDReS. Besides statistical analysis of correlation between docking root-mean square deviation (RMSD) and scoring functions, SAnDReS can also carry out statistical analysis of scoring functions and binding affinity (log(Ki)). SAnDReS calculates the correlation between experimental binding affinity and predicted values (scoring functions). The SAnDReS/MVD workflow is briefly described in the next sub-sections. 2.3.1. Filtering Dataset Preceding statistical analysis of the ensemble of structures, SAnDReS carries out data filtering, in order to eliminate repeated ligands in the dataset. In the next step, SAnDReS reads each PDB entry in the ensemble of structures, and select those structures for which water molecules are close to the active ligand defining a docking sphere centered at the ligand structure. 2.3.2. Docking Simulations We performed re-docking simulations of the active ligand in the high-resolution structure using MVD, where the 32 protocols were applied. SAnDReS evaluates the correlation between scoring functions and docking RMSD for each protocol. In addition, SAnDReS also calculates docking accuracy (DA1) and extended docking accuracy (DA2), as defined elsewhere [13, 24, 25].
Optimized Virtual Screening Workflow
Combinatorial Chemistry & High Throughput Screening, 2017, Vol. 20, No. 9 3
2.3.3. Ensemble Docking Once the best docking protocol was selected in the previous step, it is applied to an ensemble of structures using MVD for the docking simulations. Here we use SAnDReS to analyze the correlation between docking RMSD and scoring functions and docking accuracies (DA1 and DA2). 2.3.4. Binding Affinity from Crystallographic Structures In this step, we used the program SAnDReS to evaluate the correlation between predicted and experimental binding affinities. We used the scoring functions (MolDock and PLANTS scores) implemented in the program MVD to evaluate binding affinity. The scoring function calculation was performed using the crystallographic positions of the ligand and the protein target. 2.3.5. Polynomial Scoring Function SAnDReS is able to build novel polynomial scoring functions, where each term in the equation is a scoring function previously determined by the program MVD. Supervised machine learning techniques were used to determine the weight of each term in the polynomial equation [26]. The 71 structures in the HIV-1 dataset were separated in two datasets, the training set, with 51 structures and the test set, with 20 structures. The percentage of training set ligands is approximately 70%, as suggested elsewhere [27]. 2.3.6. Decoys and Actives SAnDReS can merge the actives being studied in the dataset (actives for which there are crystallographic structures) and part of the decoys available in the DUD-E [16] dataset. In this study, we employed as actives the ligands in the dataset of HIV-1 PR crystal structures. The decoys were randomly chosen from the DUD-E. We used SAnDReS to calculate enrichment factors (EF), as previously defined [28]. In addition, SAnDReS generates Receiver Operating Characteristics (ROC) curves for evaluation of scoring function performance.
Table 1.
PDB access codes for HIV-1 PR dataset.
PDB access codes 1A8G,1AJV,1AJX,1BWB,1D4H,1D4I,1D4J,1D4K,1D4L,1D4Y,1EBW, 1EBY,1EBZ,1EC0,1EC1,1EC2,1EC3,1G35,1HIH,1HPO,1HVH,1HXW, 1IIQ,1MTR,1ODW,1ODY,1PRO,1TCX,1VIK,1W5V,1W5W,1W5X,1W5Y ,1XL2,1XL5,1ZJ7,1ZSF,1ZTZ,2AID,2AVM,2AVS,2BPV,2BPY,2BQV,2C EJ,2CEM,2CEN,2HS1,2PYN,2RKG,2UPJ,2UXZ,2UY0,2WKZ,3AID,3D1 Y,3MXD,3MXE,3OXV,3OXX,3QAA,3QIP,3UPJ,4CP7,4FE6,4HE9, 4U8W, 4UPJ,5UPJ, 6UPJ, 7UPJ
3. RESULTS AND DISCUSSIONS 3.1. Re-docking Using the x-ray crystallographic resolution as a selection criterion, SAnDReS identified the structure 2HS1 [30] as the highest resolution entry in the HIV-1 PR dataset. This crystallographic structure was employed for re-docking simulations, using the 32 protocols described in the Fig. (1). Protocol 23 generated the highest Spearman’s rank correlation coefficient, with RMSD = 1.427 Å for the lowest score pose in a simulation where 500 poses were generated (supplementary material 1). Table 2 brings the statistical analysis for all scoring functions tested in the protocol 23. The Spearman’s rank correlation coefficient ranges from -0.370 to 0.818. The highest correlation were observed for PLANTS, Interaction, Protein, and Docking scoring functions, which indicates a strong correlation between these scoring functions and docking RMSD, with p-value < 0.001 for all functions. Fig. (2) shows the scatter plot for PLANTS Score vs RMSD for 500 poses generated with protocol 23. RMSD is the RMSD for the lowest scoring function value. ρ is Spearman’s rank-order correlation coefficient. pvalue1 is related to ρ, R2 is the squared Pearson’s correlation coefficient, p-value2 is related to R2. This legend is also valid for Tables 3 and 4.
2.4. HIV-1 Protease Dataset Our dataset is composed of HIV-1 PR (Enzyme Classification, (EC) 3.4.23.16) structures solved by X-ray diffraction crystallography for which Ki information is available. Data was filtered to eliminate repeated ligands and structures without crystallographic waters close to the binding site. In the case of repeated ligands, SAnDReS selects the structure with higher crystallographic resolution. The principle behind the criterion to include only structures with water molecules close to the active ligand, is based on the importance of water mediated intermolecular interactions for binding affinity [29]. After filtering, a total of 71 structures were obtained using the criteria described above. From now on, this dataset will be referred to as HIV-1 PR dataset. The PDB access codes for all structures in the HIV-1 PR dataset are shown in Table 1.
Fig. (2). Scatter plot for PLANTS Score and docking RMSD for redocking results. In the plot, au represents arbitrary units.
4 Combinatorial Chemistry & High Throughput Screening, 2017, Vol. 20, No. 9
Table 2.
Pintro and Azevedo Jr
Re-docking results. Scoring Function
RMSD (Å)
ρ
p-value1
R2
p-value2
-122
0.813
1.857.10-183
PLANTS Score
1.427
0.818
6.239.10
MolDock Score
9.492
0.799
5.551.10-112
0.202
2.895.10-26
Re-rank Score
9.492
0.631
7.178.10-57
0.102
2.558.10-13
Interaction Score
6.030
0.818
4.173.10-122
0.277
5.825.10-37
Protein Score
6.030
0.818
1.659.10-121
0.274
1.714.10-36
-17
0.003
2.362.10-1
Internal Score
18.196
-0.370
1.129.10
H-Bond Score
7.517
0.658
2.319.10-63
0.225
1.765.10-29
LE1 Score
9.492
0.799
5.578.10-112
0.202
2.895.10-26
LE3 Score
9.492
0.631
7.178.10-57
0.103
2.558.10-13
Docking Score
1.427
0.818
6.239.10-122
0.803
1.857.10-183
As we can see in the Fig. (2), we have two clusters of docking results. One for high-score poses, and another with low-score poses. Analysis of high-score poses indicates that four poses are relatively close to an alternative binding site in the structure of HIV-1 PR, with RMSD < 6.5 Å relatively to the second ligand bound to the alternative binding site. This site has been previously described for the crystallographic structure 2HS1 [30]. On the other hand, analysis of rest of the high-score poses indicated that they are randomly distributed around the HIV-1 binding site. Therefore, we cannot say that our approach was able to fully identify the secondary binding site. In the Fig. (3), we also show the lowest score pose, with a RMSD = 1.427 Å.
%, which indicates that the present approach is able to generate reasonable results, considering docking accuracy and the higher number of structures in the present study. Fig. (4) shows the scatter plot for LE3 score against docking RMSD. LE3 Score is calculated dividing Re-rank Score [14] by non-hydrogen atom count. Re-rank Score is calculated only for the top ranked poses at the end of docking simulation. Specifically, the Re-rank Score uses a weighted combination of the terms used by the MolDock Score mixed with a Lennard-Jones potential. In the LE3 Score, the values obtained for Re-rank Score are divided by the number of non-hydrogen atoms in the ligand, which aims to avoid overestimation of scoring function values for larger ligands [14]. For HIV-1 PR dataset, such normalization generated the highest correlation between docking RMSD and scoring function values. It has been previously shown that inclusion of Lennard-Jones terms in scoring functions improves overall prediction performance for docking simulations [31]. For HIV-1 PR dataset, it shows to work better, when compared with the other scoring functions described elsewhere [13].
Fig. (3). HIV-1 PR binding sites. Upper-right is the alternative binding site. At the center, we have the active site.
3.2. Ensemble Docking We applied the protocol 23 to all structures in HIV-1 PR dataset (supplementary material 2). Analysis of correlation of docking results (RMSD) with scoring functions is shown in Table 3. As we can see, the Spearman’s rank correlation coefficient ranges from -0.236 to 0.406. The highest correlation coefficients (ρ= 0.406 and p-value1 = 4.448.10-4 , R2 = 0.063 and p-value2 =3.444.10-2) were obtained for ligand efficiency 3 (LE3) Score. For LE3 Score, the RMSD for the lowest scoring function value is 0.586 Å. Extended docking accuracy was 45.07 % for all structures in the dataset. Previously published results, with a dataset composed of 31 crystallographic structures complexed with inhibitors [25] showed extended docking accuracy below 45
Fig. (4). Scatter plot for LE3 Score and docking RMSD for HIV-1 PR dataset. In the plot, au represents arbitrary units.
Optimized Virtual Screening Workflow
Table 3.
Combinatorial Chemistry & High Throughput Screening, 2017, Vol. 20, No. 9 5
Docking results for HIV-1 PR dataset.
Scoring Function
RMSD (Å)
ρ
p-value1
R2
p-value2
-2
0.225
2.974.10-5
PLANTS Score
4.173
-0.236
4.750.10
MolDock Score
6.735
0.361
1.982.10-3
0.005
5.566.10-1
Re-rank Score
9.917
0.232
5.163.10-2
0.035
1.166.10-1
Interaction Score
2.270
0.280
1.814.10-2
0.079
1.721.10-2
Protein Score
2.270
0.279
1.834.10-2
0.078
1.872.10-2
-2
0.036
1.109.10-1
Internal Score
0.650
0.268
2.391.10
H-Bond Score
7.941
-0.084
4.838.10-1
0.006
5.074.10-1
LE1 Score
0.529
0.368
1.578.10-3
0.017
2.765.10-1
LE3 Score
0.586
0.406
4.448.10-4
0.063
3.444.10-2
Docking Score
4.173
-0.236
4.750.10-2
0.225
2.974.10-5
3.3. Scoring Functions We used the crystallographic position of ligands for the structures in HIV-1 PR dataset and applied scoring function implemented in the program MVD to predict binding affinity (supplementary material 3). Results for correlation coefficients between scoring functions and log(Ki) for the structures in the HIV-1 PR dataset are shown in Table 4. The most significant correlation was observed for Interaction Score (ρ= 0.38 and p-value = 0.001084). Squared correlation (R2) analysis generated poor results, with R2 < 0.2 for all scoring functions. Fig. (5) shows the scatter plot for Interaction Score against log(Ki). Interaction Score calculates the total interaction energy between the ligand and the protein [14].
polynomial equation involving PLANTS, Interaction, and LE3 Scores. We generated a total of 511 new polynomial scoring functions using SAnDReS. Table 5 summarizes the results for training and test set data for the original scoring functions and 12 top ranked polynomial equations. The best result was obtained for polynomial equation 504 with ρ = 0.525 (p-value < 0.001) for the training set (51 structures) (supplementary material 4) and ρ = 0.368 (p-value = 0.1106) for a test set with 20 structures (supplementary material 5). Fig. (6) shows the scatter plot for polynomial equation 504 vs log(Ki), with training set data.
Fig. (6). Scatter plot for polynomial equation 504 (Score504) vs log(Ki) for 51 structures in HIV-1 PR training set. In the plot, au represents arbitrary units. Fig. (5). Scatter plot for Interaction Score vs log(Ki) for HIV-1 PR dataset. In the plot, au represents arbitrary units.
3.4. Polynomial Scoring Functions Polscore methodology [32] implemented in the program SAnDReS [13] makes possible to test different scoring schemes, using polynomial equations where their terms are taken from the original scoring functions generated by the molecular docking programs. Here, we consider a
Below we have polynomial equation 504 (score504), with coefficients determined by regression analysis, score 504 = - 5.685144 + 0.011990.(PLANTS) + 0.004743.(Interaction) + 0.001676.(LE3) - 0.000024.(PLANTS.Interaction) + 0.000106.(PLANTS.LE3) - 0.000040.(Interaction.LE3)
6 Combinatorial Chemistry & High Throughput Screening, 2017, Vol. 20, No. 9
Table 4.
Correlation between scoring functions and log(Ki). Scoring Function
Table 5.
a
Pintro and Azevedo Jr
ρ
p-value1
R2
p-value2
-2
0.010
3.962.10-1
PLANTS Score
0.199
9.576.10
MolDock Score
0.190
1.116.10-1
0.003
6.595.10-1
Re-rank Score
0.226
5.784.10-2
0.001
7.637.10-1
Interaction Score
0.380
1.084.10-3
0.004
5.947.10-1
Co-factor Score
-0.245
3.943.10-2
0.007
4.782.10-1
Protein Score
0.222
6.320.10
-2
0.015
3.030.10-1
Water Score
0.073
5.443.10-1
0.000
9.858.10-1
H-Bond Score
-0.054
6.574.10-1
0.003
6.290.10-1
LE1 Score
0.212
7.560.10-2
0.017
2.783.10-1
LE3 Score
0.028
8.173.10-1
0.000
8.581.10-1
Correlation between scoring functions and log(Ki). Scoring Function
ρa
p-valuea
ρb
p-valueb
PLANTS Score
0.264
6.162.10-2
0.010
9.674.10-1
MolDock Score
0.218
1.247.10-1
0.086
7.193.10-1
Re-rank Score
0.350
1.184.10-2
-0.086
7.169.10-1
Interaction Score
0.479
3.795.10-4
0.080
7.383.10-1
Co-factor Score
-0.143
3.176.10
-1
-0.384
9.459.10-2
Protein Score
0.223
1.154.10-1
0.165
4.877.10-1
Water Score
0.043
7.660.10-1
0.214
3.658.10-1
H-Bond Score
0.027
8.525.10-1
-0.288
2.181.10-1
LE1 Score
0.187
1.886.10-1
0.256
2.750.10-1
LE3 Score
0.045
7.559.10
-1
-0.140
5.563.10-1
Polscore#0000137
0.476
4.099.10-4
0.223
3.438.10-1
Polscore#0000201
0.461
6.725.10-4
0.236
3.161.10-1
Polscore#0000139
0.456
7.692.10-4
0.158
5.060.10-1
Polscore#0000152
0.518
9.975.10-5
0.404
7.737.10-2
Polscore#0000155
0.487
2.909.10
-4
0.341
1.406.10-1
Polscore#0000061
0.509
1.354.10-4
0.323
1.642.10-1
Polscore#0000203
0.467
5.540.10-4
0.253
2.824.10-1
Polscore#0000099
0.439
1.284.10-3
-0.009
9.699.10-1
Polscore#0000171
0.449
9.391.10-4
0.205
3.851.10-1
Polscore#0000506
0.492
2.438.10-4
0.467
3.786.10-2
Polscore#0000440
0.524
8.065.10
-5
0.350
1.306.10-1
Polscore#0000504
0.525
7.707.10-5
0.368
1.106.10-1
b
For training set data. For test set data.
The polynomial equation 504 uses PLANTS, Interaction, LE3, PLANTS. Interaction, PLANTS.LE3, and Interaction. LE3 scoring functions as explanatory variables. The highest regression coefficient was obtained for PLANTS Score. In addition, among three hybrid terms of the polynomial equation, two terms have the participation of PLANTS
Score. It has been shown, that this scoring function is usually superior than the other scores at estimating binding affinity [21], which also seems to be true for the structures in the HIV-1 PR dataset.
Optimized Virtual Screening Workflow
Combinatorial Chemistry & High Throughput Screening, 2017, Vol. 20, No. 9 7
3.5. Decoys and Actives
ABBREVIATIONS
In order to test the ability of polynomial equations to predict decoy and active ligands, we used SAnDReS to build a dataset with the ligands identified in the complex structures of the HIV-1 PR dataset as actives and added 639 decoys randomly selected from DUD-E database to generate a dataset with actives and decoys. We carried out a virtual screening simulation, using the protocol 23 focused on the protein structure 2HS1, as previously described (supplementary material 6). Analysis of EF and the area under the curve for ROC plot (AUC) (supplementary material 7) generated AUC > 60 % for at least 14 polynomial scoring functions, which confirms the prediction power of polynomial equations. If we consider the previous results, we could say that polynomial equation 504 shows a better performance when compared with original scoring functions shown in Tables 4 and 5. Fig. (7) shows ROC curve for polynomial equation 504. Furthermore, equation 504 (AUC = 84.899 % and EF1 = 7.5) shows a better performance compared to the previously published benchmarks for HIV-1 PR (AUC = 59.58 % and EF1 = 4.7) [15, 16].
AUC
=
Area under curve
AU
=
Arbitrary units
DA
=
Docking accuracy
DUD-E
=
Directory of useful decoys, enhanced
EC
=
Enzyme classification
EF
=
Enrichment factor
HIV-1 PR
=
Type 1 human immunodeficiency virus protease
IS
=
Iterated simplex
ISACO
=
Iterated simplex with ant colony optimization
Ki
=
Inhibition constant
LE
=
Ligand efficiency
MDO
=
MolDock optimizer
MDSE
=
MolDock simplex evolution
MVD
=
Molegro virtual docker
PDB
=
Protein data bank
p-value1
=
P-value for Spearman's rank correlation coefficient (ρ)
p-value2
=
P-value for Pearson's correlation coefficient (R)
RMSD
=
Root-mean-square deviation
ROC
=
Receiver operating characteristics
SAnDReS
=
Statistical analysis of Docking results and Scoring functions
CONSENT FOR PUBLICATION Not applicable. Fig. (7). ROC Curve for Polynomial Function 504.
CONFLICT OF INTEREST
CONCLUSION
The authors declare no conflict of interest, financial or otherwise.
The novel approach for molecular docking simulation against HIV-1 PR showed docking RMSD below 3.0 Å for over 45% of structures in the dataset. In addition, application of Polscore approach, implemented in the program SAnDReS generated polynomial scoring functions with predicting power higher than previously published benchmarks [15, 16], if we consider enrichment factors and AUC values. Taken together, these results strongly indicate that the present approach to molecular docking against HIV1 PR is a promising strategy, which can be used to explore a virtual space composed of polynomial scoring functions. Such method allows finding the scoring function that is more adequate to the biological system being investigated [33]. In addition, since the SAnDReS method allows using scoring function obtained from any docking program, the present workflow can be applied to development of targeted-scoring functions generated from other docking and/or scoring function programs.
ACKNOWLEDGEMENTS This work was supported by grants from Conselho Nacional de Desenvolvimento Científico e Tecnológico (CNPq, Brazil) (Process Numbers: 472590/2012-0 and 308883/2014-4). VOP acknowledges support from PUCRS/BPA fellowship and CNPq fellowship. WFA is senior researcher for CNPq (Brazil). SUPPLEMENTARY MATERIAL Supplementary material is available on the publisher’s website along with the published article. REFERENCES [1]
Pang, X.; Liu, Z.; Zhai, G. Advances in non-peptidomimetic HIV protease inhibitors. Curr. Med. Chem., 2014, 21(17), 1997-2011.
8 Combinatorial Chemistry & High Throughput Screening, 2017, Vol. 20, No. 9 [2] [3]
[4] [5]
[6] [7] [8] [9]
[10] [11]
[12]
[13]
[14] [15] [16] [17]
Berti, F.; Frecer, V.; Miertus, S. Inhibitors of HIV-protease from computational design. A history of theory and synthesis still to be fully appreciated. Curr. Pharm. Des., 2014, 20(21), 3398-3411. Canduri, F.; Teodoro, L.G.; Fadel, V.; Lorenzi, C.C.; Hial, V.; Gomes, R.A.; Neto, J.R.; de Azevedo, W.F. Jr. Structure of human uropepsin at 2.45 A resolution. Acta Crystallogr. D Biol. Crystallogr., 2001, 57(Pt 11), 1560-1570. Miller, M.; Jaskólski, M.; Rao, J.K.; Leis, J.; Wlodawer, A. Crystal structure of a retroviral protease proves relationship to aspartic protease family. Nature, 1989, 337(6207), 576-579. Navia, M.A.; Fitzgerald, P.M.; McKeever, B.M.; Leu, C.T.; Heimbach, J.C.; Herber, W.K.; Sigal, I.S.; Darke, P.L.; Springer, J.P. Three-dimensional structure of aspartyl protease from human immunodeficiency virus HIV-1. Nature, 1989, 337(6208), 615-620. Berman, H.M.; Westbrook, J.; Feng, Z.; Gilliland, G.; Bhat, T.N.; Weissig, H.; Shindyalov, I.N.; Bourne, P.E. The Protein Data Bank. Nucleic Acids Res., 2000, 28(1), 235-242. Kitano, H. Systems biology: a brief overview. Science, 295, 16621664. Strom, T.A.; Durdagi, S.; Ersoz, S.S.; Salmas, R.E.; Supuran, C.T.; Barron, A.R. Fullerene-based inhibitors of HIV-1 protease. J. Pept. Sci., 2015, 21(12), 862-870. Ferreira, L.G.; Andricopulo, A.D. Fragment-Based QSAR and Structural Analysis of a Series of Hydroxyethylamine Derivatives as HIV-1 Protease Inhibitors. Comb. Chem. High Throughput Screen., 2015, 18(5), 464-475. Ibrahim, M.; Saleh, N.A.; Elshemey, W.M.; Elsayed, A.A. Computational Notes on Fullerene Based System as HIV-1 Protease Inhibitors. J. Comput. Theor. Nanosci. 2010, 7, 224-227. Ibrahim, M.; Saleh, N.A.; Hameed, A.J.; Elshemey, W.M.; Elsayed A.A. Structural and electronic properties of new fullerene derivatives and their possible application as HIV-1 protease inhibitors. Spectrochim. Acta A Mol. Biomol. Spectrosc., 2010, 75(2), 702-709. Ibrahim, M.; Saleh, N.A.; Elshemey, W.M.; Elsayed, A.A. Fullerene derivative as anti-HIV protease inhibitor: molecular modeling and QSAR approaches. Mini Rev. Med. Chem., 2012, 12(6), 447-451. Xavier, M.M.; Heck, G.S.; de Avila, M.B.; Levin, N.M.; Pintro, V.O.; Carvalho, N.L.; Azevedo, W.F. Jr. SAnDReS a Computational Tool for Statistical Analysis of Docking Results and Development of Scoring Functions. Comb. Chem. High Throughput Screen., 2016, 19(10), 801-812. Thomsen, R.; Christensen, M.H. MolDock: a new technique for high-accuracy molecular docking. J. Med. Chem., 2006, 49, 33153321. Huang, N.; Shoichet, B.K.; Irwin, J.J. Benchmarking sets for molecular docking. J. Med. Chem., 2006, 49(23), 6789-6801. Mysinger, M.M.; Carchia, M.; Irwin, J.J.; Shoichet, B.K. Directory of useful decoys, enhanced (DUD-E): better ligands and decoys for better benchmarking. J. Med. Chem., 2012, 55(14), 6582-6594. De Azevedo, W.F. Jr. MolDock applied to structure-based virtual screening. Curr. Drug Targets, 2010, 11(3), 327-334.
[18] [19] [20] [21] [22]
[23]
[24] [25] [26]
[27]
[28] [29] [30]
[31] [32] [33]
Pintro and Azevedo Jr Heberlé, G.; de Azevedo WF Jr. Bio-inspired algorithms applied to molecular docking simulations. Curr. Med. Chem., 2011, 18(9), 1339-1352. Storn, R.; Price, K. Differential evolution - a simple and efficient heuristic for global optimization over continuous spaces. J. Global Optim., 1997, 11, 341–359. Nelder,J.A.; Mead, R.A. Simplex method for function minimization. Comput. J., 1965, 7, 308-313. Korb, O.; Stutzle, T.; Exner, T.E. Empirical Scoring Functions for Advanced Protein-Ligand Docking with PLANTS. J. Chem. Inf. Model., 2009, 49(1), 84-96. Azevedo, L.S.; Moraes, F.P.; Xavier, M.M.; Pantoja, E.O.; Villavicencio, B.; Finck, J.A.; Proenca, A.M.; Rocha, K.B.; de Azevedo, W.F. Recent progress of molecular docking simulations applied to development of drugs. Curr. Bioinform., 2012, 7(4), 352-365. Heck, G.S.; Pintro, V.O.; Pereira, R.R.; de Ávila, M.B.; Levin, N.M.B.; de Azevedo WF. Supervised machine learning methods applied to predict ligand-binding affinity. Curr. Med. Chem., 2017, 24(23), 2459-2470. Vieth, M.; Hirst, J.D.; Kolinski, A.; Brooks III, C.L. Assessing energy functions for flexible docking. J. Comp. Chem., 1998, 19(14), 1612-1622. Ballante, F.; Marshall, G.R. An automated strategy for bindingpose selection and docking assessment in structure-based drug design. J. Chem. Inf. Model., 2016, 56, 54-72. Pedregosa, F.; Varoquaux, G.; Gramfort, A.; Michel, V.; Thirion, B.; Grisel, O.; Blondel, M.; Prettenhofer, P.; Weiss, R.; Dubourg, V.; Vanderplas, J.; Passos, A.; Cournapeau, D.; Brucher, M.; Perrot, M.; Duchesnay, E.. Scikit-learn: Machine Learning in Python. J. Mach. Learn. Res., 2011, 12, 2825-2830. Cichero. E.; Cesarini, S.; Mosti, L.; Fossa, P. CoMFA and CoMSIA analyses on 1,2,3,4-tetrahydropyrrolo[3,4-b]indole and benzimidazole derivatives as selective CB2 receptor agonists. J. Mol. Model., 2010, 16(9), 1481-1498. Brooijmans, N., Kuntz, I.D. Molecular recognition and docking algorithms. Annu. Rev Biophys. Biomol. Struct., 2003, 32, 335-373. Milanetti, E.; Raimondo, D.; Tramontano, A. Prediction of the permeability of neutral drugs inferred from their solvation properties. Bioinformatics, 2016, 32(8), 1163-1169. Kovalevsky, A.Y.; Liu, F.; Leshchenko, S.; Ghosh, A.K.; Louis, J.M.; Harrison, R.W.; Weber, I.T. Ultra-high resolution crystal structure of HIV-1 protease mutant reveals two binding sites for clinical inhibitor TMC114. J. Mol. Biol., 2006, 363(1), 161-173. Wu, M.Y.; Dai, D.Q.; Yan, H. PRL-Dock: protein-ligand docking based on hydrogen bond matching and probabilistic relaxation labeling. Proteins, 2012, 80(9), 2137-2153. Azevedo, W.F. Jr.; Dias, R. Evaluation of ligand-binding affinity using polynomial empirical scoring functions. Bioorg. Med. Chem., 2008, 16(20), 9378-9382. de Ávila, M.B.; Xavier, M.M.; Pintro, V.O.; de Azevedo, W.F. Jr.. Supervised machine learning techniques to predict binding affinity. A study for cyclin-dependent kinase 2. Biochem. Biophys. Res. Commun., 2017, 494, 305-310.