Optimizing a physical security configuration using a highly detailed simulation model
Marechal, T.M.A.1,2 *, Smith, A.E.2, Ustun, V.2, Smith, J.S.2, Lefeber, A.A.J.1
1
Eindhoven University of Technology, Department of Mechanical Engineering, Section Systems Engineering.
Eindhoven, the Netherlands. 2
Auburn University, Department Industrial and Systems Engineering. Auburn, AL, USA.
* Corresponding author. Email:
[email protected]
Abstract This chapter focuses on using a highly detailed simulation model to create a physical security system to detect intrusions by human agents in a building thereby minimizing the expected loss of such intrusions. Security consists of human guards and fixed security cameras. The problem is represented as a binary optimization problem and a new heuristic is proposed to perform the security configuration optimization, the Hybrid Genetic Ant Optimization (HGAO). This heuristic combines a genetic algorithm and an ant colony optimization. HGAO is compared with a genetic algorithm for two security optimization scenarios.
1. Introduction When a building or a set of buildings need a physical security system to prevent intrusions, it can be hard to find a configuration that is cost effective but also performs the security task adequately. Especially when both human guards and security cameras are used it is difficult to find a near-optimal configuration because of the number of potential designs. How many guards are needed and where should each walk? How many cameras are needed, where should each be located and at what direction should each point-? These questions are usually answered by using intuition and common sense. The problem when using intuition and common sense is that it is possible to over-secure or under-secure a certain part of the building. Oversecuring results in costs that are higher than necessary while under-securing might lead to intruders breaking in successfully, potentially with catastrophic consequences. In this chapter describes the use of a highly detailed simulation model to find a superior security configuration for an example building. The building has to be protected against intruders who want to steal items from within the building. One could, for example, envision a sensitive area where important paperwork is to be protected from being stolen by an external enemy or, possibly a weapon or fuel storage depot that has to be secured from enemy intrusions. In this chapter, a stochastic simulation model is coupled with a heuristic optimizer to find a security configuration that is as cost effective as possible while keeping the probability that an intruder breaks in and steals one or more items at an acceptably low level. The simulation is used to probabilistically evaluate security configurations while the heuristic is used to put forth candidate security configuration designs. In the next section a literature review is given. A simulation model of an actual building with guards, security cameras and intruders has been made. The objective functions and the
2
constraints are given in the 3rd section. In section 4 more details on the simulation are given. The binary problem representation and the newly developed optimization method (HGAO) are explained in detail in the 5th section. In the 6th section the outcome of the HGAO heuristic on two security optimization problems is given. Conclusions are drawn in section 7. Finally, recommendations for further research are given in section 8.
2. Literature review In this section, literature with respect to the optimization problem and literature with respect to simulation are given. After that a review on heuristics that are strongly related to the heuristic used are provided. 2.1 Optimization problem Physical security systems to prevent intrusions have been studied in literature before. However, the studies typically focus on only a small part of the security system, for example on the working of a single movement sensor or a single laser sensor. Only a very small number of studies focus on more comprehensive security systems. In [7] an in-depth study on several sensor configurations to protect one single valuable item is described. In [3] several optimization approaches are performed to find a good security sensor configuration for a greatly simplified model. In that study the probability of detection is a decreasing function of distance between intruder and sensor. It is suggested that empirical research methods should be done to investigate in what way distances from different sensors influence detection probabilities. In [5] arcs and nodes are used to evaluate a security system with Markov processes. Success probabilities for different arcs of the intruder path are estimated in advance. The main focus is to find the way at which an intruder has the highest probability to do harm, using low-detailed information. In [6] performances of complete security systems are tested. In that study the testing is done both by
3
applying low detailed analytical estimates and by applying simulation using human participants. For the latter purpose a real-time connection to a virtual reality model has been used to incorporate real human behavior. To the best of our knowledge, the only studies on using a highly detailed simulation to evaluate physical security systems are [4] and [10]. In [4] an effective sensor network configuration to detect nuclear, biological or chemical attacks is determined. Detailed information such as location and specifications of buildings and different meteorological situations are used. Note that the type of problem in [4], detecting a nuclear, biological or chemical attack, is quite different from this study. In [4], mitigation of the threat is an aim over just detection while this chapter will focus on detection. In [10] a simulation using simple agents to represent intruders and guards is introduced. Many realistic features such as doors, windows, locks and security cameras have been implemented in the simulation. The simulation is used to evaluate predefined security configurations. No literature describes using a highly detailed simulation to optimize the security system. In this chapter the simulation of [10] is used as a base. Some additional features have been added and a graphical engine has been built in. Some minor modifications have been made and some additional features have been added to put even more detail into the simulation. Furthermore the line-of-sight module that evaluates whether an intruder can be seen by a guard or not has been replaced by a faster line-of-sight module, as described in [11]. 2.2 Optimization heuristics Because of the large search space of the decision variables (camera numbers and locations, guard numbers and paths) and the relatively lengthy simulation needed to evaluate each proposed security configuration, the problem is posed as a binary (combinatorial) problem
4
and solved with a heuristic. The optimization is performed with a new hybrid heuristic, combining aspects of a binary genetic algorithm and of a binary ant colony optimization. Binary genetic algorithms have been used before in various research fields, two of the many examples are [1] and [12]. Binary ant colony optimization has been used before too, for example in [7] and in [8]. In [2] a means to turn continuous problems into binary problems has been developed, so continuous problems can be solved as binary problems too, expanding the use of the binary optimization method described in this study.
3. Problem formulation The simulation, the objective function and the constraints are devised in such a way that several different optimization problems can be solved. 3.1 Objective function The objective is to minimize the total costs which are all viewed as periodic (annual in this case). Total costs consist of guard salary, yearly camera value deduction, damage to the building caused by an intruder and the value of any stolen items. Total costs
=
Guard salary
+
Camera value deduction
+
Damage to building
+
Value of stolen items Eq. 1
Guard salary depends on the number of guards – each additional guard incurs the same additional annual salary. Camera value deduction depends on the number of cameras in the same manner. That is, both guard costs and camera costs are linear. Damage to buildings can consist of the breaking of doors, windows or locks when an intruder attempts to break in. Furthermore an intruder can also induce damage at other points in the building, for example when s/he is collecting an item to steal (if for instance the item was stored in a locked display case that has to be broken).
5
Items are only accounted to be stolen if the intruder exits the building with the item. If the intruder gets caught before leaving the building or the area of buildings, the item itself does not contribute to the total costs. Damage that has been done to the building before the moment that an intruder gets caught does contribute to total costs. The camera value deduction accounts for camera depreciation and possible maintenance costs, as well as power to operate it. In practice the camera value deduction per year is negligible compared to the guard salary; however, there was no reason to leave it out of the objective function. One might at a first glance think that if camera costs are negligible, the numbers of cameras in the optimal case will be extremely large. In section 4 it is explained why this is not the case. 3.2 Constraints While the total cost is the objective, the security requirement is handled as a constraint. This can be varied to suit the scenario considered. If for example a storage depot for explosives is to be secured, this constraint must be set to a very high probability of intruder detection and apprehension. In this chapter two constraint functions have been created. The minimum required fraction of intruders that get caught by a guard can be set as a constraint (the apprehension constraint). Furthermore the minimum required fraction of intruders that will be detected at some point can be set (the detection constraint). An intruder is detected either if a guard directly sees the intruder, or if the guard sees the intruder on a surveillance monitor. Fraction of apprehended intruders
≥
h1
Eq. 2
Fraction of detected intruders
≥
h2
Eq. 3
3.3 Possible optimization problems
6
In the objective function (Eq.1) any of the four factors that contribute to the cost can be turned off if desired. The objective function has been described in this way to enable a variety of security problems to be tackled. If none of the factors are turned off, the objective will be to find the security configuration with lowest yearly costs. In that case some intruders might break into the building, causing damage to doors or windows. It might even be the case that some intruders steal one or more items without being caught. If one would not want intruders to ever succeed in stealing an item, h1 in Eq.2 should be set to 1. One could also choose to turn off the third and fourth factors in the objective function (Eq.1) to find the security configuration that is as cheap as possible, ensuring that no more than a fraction of 1-h1 intruders break in and steal an item. One could also choose to only turn off the fourth factor, for example if the value of stolen items cannot be expressed in terms of money. The simulation and optimization are created in such a way that it is also possible to fix the cameras used (or not to use any cameras) and optimize the guards for that camera configuration. It is also possible to consider monitored cameras only without guard paths. The optimization problems described above are just a few of the possibilities. Because of the fact that the simulation and the optimization are strongly decoupled and because of the fact that many factors can either be turned on or off, the simulation and optimization can be used to solve a variety of optimization problems.
4. The simulation Simulation is the tool that is used to verify the security designs in this chapter. When a promising design (a security configuration) has been identified, it is fed into the simulation. Based on this input, the simulation produces an output, i.e. the expected total costs, see Eq.1.
7
Due to stochastic behavior in the simulation, the simulation is run numerous times for each design. Although the simulation is very detailed, many assumptions have been made to simulate and run intruder scenarios and to test security configurations. It is hard to devise realistic scenarios that cover the range of possibilities. One should for instance answer the question where intruders would break in, how often they would break in and how they would behave once they were inside. One should also make several assumptions regarding guard behavior. However, to assist with this task the real-time graphical visualization of the simulation can immediately show if anything unrealistic is happening. Section 4.1 describes the building that has been used in the simulation. In section 4.2 features of the simulation are given. Section 4.3 describes assumptions that have been made in the simulation. In section 4.4 the intruder scenarios are defined. Section 4.5 describes the possible guard patrol paths and section 4.6 describes the camera features. 4.1 The building The purpose of this study is to find a good security configuration for a certain building or set of buildings. The building that was chosen for study is a three floor actual newly constructed building. The building has one elevator and two stairways. All together, there are just over 100 rooms. The building has nine doors to the outside and 99 windows to the outside. A few simplifications have been made: all three floors are considered identical (except for doors to the outside which only exist at the ground floor), doors are assumed to be exactly as thick as walls, and both stairways and the elevator are modeled as rectangular hollow shafts. 4.2 Simulation features
8
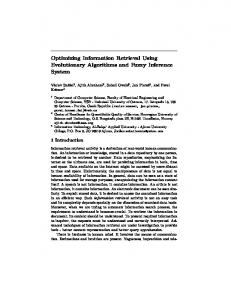
The goal of the simulation is to see how well a certain security configuration behaves for a depicted set of intruder scenarios. The model used to describe the physical components of the facility is based on the model described in [11]. In the visualization one can see the intruders and the guards moving around and one can see the cameras. One can also see the areas that guards and cameras can view at each moment in time. Although the graphical representation is a 2-D visualization, the entire model is 3-dimensional. The goal of the real-time graphical representation is to verify that the simulation model works as intended. Intruders and guards walk a predefined path with a predefined speed at each arc of the path. Behavior of intruders is not determined on the fly, so an intruder will not alter his/her behavior if s/he sees a camera or a guard. “Barriers” are ceilings, floors, walls, doors and windows. Doors and windows are “portals.” Doors and windows can be opened, closed or even locked. Intruders can break locks of doors or windows. An agent (guard or intruder) can go to another floor by using the elevator or the stairs. A line-of-sight algorithm calculates whether a guard can see an intruder or not. This depends on the distance between the guard and the intruder, on the direction a guard is looking towards and on (non transparent) barriers obstructing the guard’s view. The view of cameras is projected on surveillance monitors located in central bank. Whether the intruder can be seen by the camera is also determined by the line-of-sight algorithm. An intruder who is seen by a camera can only be detected if a guard is actually looking at the surveillance monitors. Only a fixed number of camera views can be projected on the surveillance monitors at the same time, if there are more cameras a switch is made every few time units. Figure 1 shows a typical “screen shot” of the simulation. In this figure, solid black lines are portals and the cameras, guards and intruder are all shown with their line of sight calculation for that moment in time.
9
3 A
B
C
D
1
2
Simulation time
3 2 3 A: Zoom out B: Zoom in C: Change viewing angle D: Exit Simulation
3
1: Intruder 2: Guard 3: Camera
Figure 1. Screen shot of the 2 D graphic visualization of the simulation. 4.3 Simulation assumptions The main assumptions made in the simulation are: -
Initially all outside doors and windows along with some of the inside doors are locked.
-
A guard can go through every door quickly (that is, has a key for locked doors).
-
An intruder can go through any door or window, but if the door or window is locked it will take considerably more time.
-
Intruders can induce costs at any point in the building, defeating a locked door or window will induce costs, but an intruder can also cause damage at other places.
-
A guard does not realize that an intrusion has occurred if s/he detects that the state of a door or window has been changed.
-
An intruder walks slower if carrying a heavy item that has been stolen.
10
-
There is never more than one intruder at a given time.
-
An intruder is detected if a guard sees her/him. A guard sees the intruder with a certain probability if the intruder is in the area the guard is physically capable to see.
-
If an intruder is in sight of a camera, the intruder is detected with a certain probability if that camera is projected on the surveillance monitor and a guard is watching the surveillance monitor.
-
No attempt has been made to simulate guards that actually chase the intruder. A calculation is done to determine the time an intruder has left after detection before s/he is caught. The amount of time depends on the distance between guards and the intruder, on the guard’s running speed and on the floor the guards and intruder are. If the intruder is detected via camera, the guards first need a few seconds to determine where to go to. This delay could be caused by communication between guards on the intruder position for example.
-
An item is only considered stolen if the intruder exits the building with it.
4.4 Intruder scenarios To test the optimization heuristic, certain intruder scenarios, candidate guard patrol paths and candidate camera options and positions have been defined. All of these settings can easily be changed to test for different situations. For this study, 40 intruder scenarios have been defined with the following assumptions: -
The number of times intruders try to break in per year is fixed.
-
The largest proportion of the costs caused by an intruder consists of the value of stolen item(s).
11
-
An intruder will only break-in via a door or window on the first floor. However, some intruders go to the second or third floor via the stairs or via the elevator after breaking in on the ground floor.
-
Intrusion scenarios where intruders go to the second or third floor of the building are less likely to happen than intrusion scenarios where intruders stay at the first floor.
-
Some intruders only steal one item, some intruders steal multiple items at the same place, and some intruders go in and out of the building several times each time stealing one or more items.
-
Intruders do not always exit the building at the same place where they entered, but in most cases they do.
-
In general, intruders move fast, except when they are carrying a heavy item.
4.5 Guard patrol paths 17 candidate guard patrol paths have been defined. The following assumptions have been made: -
Some guard paths are outside the building, some are inside the building.
-
Guard salary is $31 per hour per guard.
-
The building needs to be guarded for 60 hours a week, 52 weeks a year.
4.6 Camera features 41 candidate camera positions have been defined. The following assumptions have been made: -
Some of the cameras are outside the building, others are inside the building.
-
Some cameras have predefined scanning movement possibilities, other cameras look in a fixed direction all the time.
-
The width of a camera view is 50 degrees.
12
-
The camera costs are $500 per camera per year. These costs are caused by maintenance and camera value deduction. Costs of surveillance monitors, wires and data storage devices are neglected (or considered loaded into the camera cost).
5. Optimization heuristics Because of the complexity of the objective function evaluation and the large search space size, heuristics are considered for optimization. Heuristics require a solution encoding, a method to evaluate solutions, a method to move to or to identify new candidate solutions and a termination mechanism. 5.1 Security configuration representation and evaluation The problem is described as a binary problem, where each solution consists of two strings with binary digits, one string lists possible camera locations while the second string lists possible guard paths. For each predefined candidate camera location or guard path, there is one digit. If the digit is set to 0 this means that the candidate camera location or guard path is not used, if the digit is set to 1 the candidate camera location or guard path is used in the security configuration. Summing over the camera string yields the number of cameras while the same is true for guards when summing over the guard string. Each solution is evaluated by the mean of three runs of the simulation. If the mean of these three indicates infeasibility (does not meet the detection / apprehension constraint), the solution is discarded. Otherwise, the solution is considered for inclusion in the population. A more precise simulation set of 30 runs is done for each solution which has a higher fitness than worst solution in the current population and has a fitness which is not more than 10% lower than the fitness of the best solution in the population. The mean of these 30 runs is used as the
13
evaluation. The reason for this two step evaluation is that the simulation takes quite a bit of CPU time, and this method conserves it.1 5.2 The need for an effective heuristic There are 41 candidate camera locations and 17 candidate guard paths resulting in a 58 dimensional binary solution space. The number of cameras and guards used in the security configuration is also determined by the heuristic, therefore there are 258 ≈ 2.9 x 10¹⁷ solutions. Because there is stochastic behavior in the simulation (for example, door or window opening time), each solution has to be tested many times to obtain the distribution of results. Because of this and because the highly detailed simulation is computationally expensive, there is a need for a very effective heuristic. Two popular heuristics inspired by nature are combined into a new hybrid algorithm, the hybrid genetic ant optimization (HGAO). HGAO combines properties of GA and ACO, which for this problem can be more effective than either heuristic alone. In general ACO converges faster than GA, because ACO especially depends on local information (pheromone level of each single digit) and GA especially relies on global information (fitness of entire solution). Specifications of the GA and the ACO are given in section 5.2 and 5.3 respectively. 5.3 GA In the genetic algorithm strings can been seen as chromosomes and digits can be seen as genes. For more information on GA, see [1]. Initializing the GA is done as follows: First, random initial solutions are created. This is done by choosing a random number between 0 and 1 for each initial solution, then for each bit in the string, another random number is chosen between 0 and 1. At each bit place, if the random number is larger than string random number, a
1
For a number of solutions, the 30 runs were also compared with 600 runs. It was ascertained that 30 runs provided the same results as 600 runs, and therefore for this simulation, was deemed sufficient for optimization.
14
1 is assigned for that bit, otherwise a 0 is assigned. After initialization, a genetic algorithm consists of four stages; selection, recombination, mutation and updating. Selection
The two parents that are used for creating the next child(ren) can be selected in
various ways. In this chapter single round tournament selection is used. For each parent two individuals from the population are chosen at random. The fittest of these two individuals will be one of the next parents. In this paper two parents only create one child. Recombination
In this chapter equal probability gene cross-over (also called uniform
crossover) is used. For each gene, there is a 50% chance that the gene (0 or 1) of the first parent is used and a 50% chance that the gene of the second parent is used. Mutation
In this chapter gene flipping probability is used. This means that for every gene
the probability that the gene flips (either from 0 to 1 or from 1 to 0) is defined. The probability is set to 0.05. Using this probability for gene flipping results in some strings with no mutations and some strings with one or several mutations. Updating
Usually whenever an entire population has been created and tested, the fittest
solutions are selected following a certain strategy and these solutions create a new generation, termed a general GA. However, because of the computational effort of evaluation, an incremental GA is used here. After two parents create the child, it will only be added to the population if its fitness is higher than the fitness of the solution with the lowest fitness in the population. Solutions that are not feasible with respect to the constraints described in section 3 will be discarded immediately. Pseudo code GA Repeat Create one random individual Evaluate solution If feasible Add to population Until (number of individuals = max population size) Repeat
15
Select 2 parents by tournament selection Apply genetic operators to generate new individual Evaluate solution If feasible & fit enough Add to population and remove worst individual Until too many steps without improvement OR max calculation time reached OR maximum number of iterations are done
Figure 2. Pseudo code of the genetic algorithm 5.4 ACO In the ant colony optimization algorithm, strings can be seen as paths and each digit can be seen as a dimension. So if a string consists of n digits, the problem is n-dimensional. For each dimension there is a pheromone concentration. This concentration is a real number, the probability that an ant walks into this dimension (that, the probability that the search moves in to this solution), depends on this pheromone concentration. The pheromone levels are initialized by initially setting all values to 0.5 (or, to a random walk). For more information on ACO, see [7]. An ant colony algorithm consists of three stages; path picking, pheromone increase and pheromone decrease. Path picking In this chapter double probabilistic path picking is used. First the number of digits that will be set to 1 in the next solution will be determined via a probability. The mean of this probability equals the number of digits that were set to 1 in the corresponding string in the previous solution. Once the numbers of digits that will be set to 1 in each string (guard string and camera string) are determined, the actual digits that are set to 1 are chosen in a probabilistic way using the pheromone concentration. Pheromone increase For cameras, whenever a camera detects an intruder, the pheromone level for its corresponding digit is raised. For a guard path, the pheromone level is increased when the guard actually catches an intruder. Also, the pheromone level of a guard increases if the guard
16
detects an intruder on the surveillance monitor. Note that even for solutions that are infeasible with respect to the constraints given in section 3 the pheromone levels can increase. Pheromone decrease The ACO in this paper uses min/max criteria. Whenever a pheromone level exceeds a maximum value, the pheromone levels for all genes on that string will be scaled down by the same fraction in such a way that the highest pheromone level equals the maximum value. Whenever a pheromone level comes below a minimum value, this pheromone level is set to the minimum value. This prevents pathological behavior of the ACO search. Pseudo code ACO For every bit Set initial pheromone concentration Repeat Create one random individual Evaluate solution Update pheromone levels Until n random individuals have been created Repeat
Create new individual based on pheromone levels Evaluate solution Update pheromone levels Until too many steps without improvement OR max calculation time reached OR maximum number of iterations are done
Figure 3. Pseudo code of the ant colony optimization 5.5 HGAO In HGAO each new solution is created either by GA or by ACO. The idea behind this is that whenever an ACO solution is created, it will be close to the previous solution in the solution space. If this results in lower fitness, the next solution will probably be created using GA. However, if the ACO solution results in a higher fitness, the probability that the next solution will be created by ACO again is high. This provides a balance between the strengths and success of each heuristic. Which one of the two heuristics (GA or ACO) is used for creating the next solution depends on the value of variable Xp in the HGAO heuristic. Xp is a real value ranging from Xmin (Xmin≥0) to Xmax (Xmax≤1). The value of Xp directly represents the probability that the next 17
solution will be created using ACO. If a solution is not created by ACO, it is created by GA. Xmin and Xmax are static real values, they are both set before the optimization starts. Xp is a real value that changes during the optimization. For this work Xmin was set to 0.2 and Xmax was set to 1. This means that at least 20% of the solutions are created using the ACO approach and in the other extreme case all solutions are created using ACO approach. There are many ways to update Xp. In this work a simple decision strategy is chosen. Xp is only updated after testing an ACO solution. If the ACO solution gave a good result (feasibility and high fitness), the value of Xp will be increased by Xadd, so the probability that the next solution will be created using ACO will be higher. If the ACO solution gave a bad result (infeasibility or low fitness), the value of Xp will be decreased by Xsubstract, so the probability that the next solution will be created using ACO will be lower. Xadd and Xsubstract are set to the relatively high values 0.4 and 0.2, respectively, so Xp can fluctuate rapidly. The idea behind this decision strategy is that the GA effectively scans the global search space while the ACO part specializes in local optimization. Pseudo code HGAO For every bit Set initial pheromone levels Set initial Xp (Xp = probability that next individual is created by ACO strategy) Repeat Create one random individual Evaluate solution Update pheromone levels If feasible Add to population Until too many steps without improvement OR max calculation time reached Repeat If (random number between 0 and 1 < Xp) Create new solution based on pheromone levels Evaluate solution Update Xp Else Apply genetic operators to generate new solution Evaluate solution Update pheromone levels If feasible & fit enough Add to population and remove worst individual
18
Until too many steps without improvement OR max calculation time reached OR maximum number of iterations are done
Figure 4. Pseudo code of the hybrid genetic ant optimization
6. Results The optimization methods and the simulation have been written in such a way that various security optimization problems can be solved. In this section results of two different optimization problems are given. Results of the GA and of the HGAO will be compared. Furthermore an in depth look at the HGAO heuristic’s behavior will be given. The optimization problem described in section 6.1 is large and complicated. This problem is where all possibilities of the simulation and optimization are tested. The optimization problem in section 6.2 is a smaller one and this problem is chosen to get an overview of the effects of setting constraints and of using alternative numbers of guards. A population of 30 is used by each algorithm for each problem. 6.1 Test 1: Unconstrained full optimization The goal of this optimization is to find the lowest total cost security configuration. Both cameras and guards can be used. No constraints are used, that is, no minimum levels of detection or apprehension are set. The reason for optimizing this problem is that it is a large and complicated problem. It would be difficult to find a good security configuration for this problem using only common sense and intuition. Forty intruder scenarios are considered, 41 possible camera locations and 17 possible guard paths. The optimization is terminated when number of intruder runs reaches three million, resulting in testing approximately 13.5K different security designs and taking about 48 hours of desktop PC computing time. Note that the theoretic search space is 2(40+41+17) = 7.9 x 1028. 6.1.1 Results
19
The same problem was optimized using GA and HGAO. Both the GA and the HGAO are run for approximately 13500 iterations, which takes approximately two days (each algorithm) on a current desktop computer. Recall that the simulation itself is the greatest consumer of computational resources. Figure 5 shows a typical run of each algorithm as computational time
Thousands
(and thus, iterations) increase (note that the x axis is log scale). 1800 1600
1400
Total costs
1200 1000 800 600
400 200
0 1
10
100
1000 Iteration number
GA
10000
100000
HGAO
Figure 5. Total costs of the best solution of each optimization approach as search progresses One can see that both algorithms have similar performance. In the beginning they perform exactly the same with respect to the total costs of the best solution so far. This is due to the fact that initial solutions for the GA are created with the same seeding in both methods. The GA has a population size of 30, so it is seeded with 30 individuals. In the end, HGAO finds a slightly better solution than the GA (see Table 1). Interestingly, each optimization ends up in a different optimum. Both find that the only guard that should be
20
used is the guard that watches the surveillance monitors all the time (except when an intruder is detected, in which case the guard leaves the monitors to attempt to apprehend the intruder). Both optimizations find that 27 of the 41 candidate cameras should be used. Cameras specified for the upper floors were chosen to view the elevator or stairwells, as these are the only access points from below. Each method finds a different camera configuration (see Figure 6 for specifics). The security configuration of the HGAO results in a 0.2% higher detection probability and a 0.5% higher apprehension probability than the security configuration found by the GA. Due to these probabilities the costs induced by intruders are 3.6% lower for the HGAO configuration. A little more than half of the total costs are security costs (guards and cameras) while the rest are costs incurred by break-ins. In the lowest cost security configuration about 96% of the intruders get caught.
B
B
B
B
Bt B
Ht Gt
B
Ht
B
B B
B
B Gt Ht
H
B
G
B
B H
G
B
B
21
G
B
B
H G
B
Figure 6. Optima from HGAO and GA (ground, second and third floors from top to bottom). H: camera only used in HGAO, G: camera only used in GA, B: camera used in both, t: camera can turn, it scans a larger surface. 22
To investigate whether HGAO finds the slightly better solution because of stochastic behavior in the simulations or because the HGAO is a better heuristic for this problem, a more in depth analysis is done in section 6.1.2. Table 1: Results of optimizations with GA and with HGAO
Detection probability Probability of getting caught Number of guards used Number of cameras used Guard costs Camera costs Intruder caused costs Total Costs
GA 0.967 0.956
HGAO 0.969 0.961
1 27 $96,720,(46.1% of total costs) $13,500,(6.4% of total costs) $99,720,(47.5% of total costs) $209,904
1 27 $96,720,(47.6% of total costs) $13,500,(6.7% of total costs) $92,572,(45.6% of total costs) $202,792
6.1.2 In-depth look at the HGAO behavior The idea behind the decision strategy of HGAO is that the ACO part will efficiently search local areas of promising solutions (see sections 5.2 and 5.5). This means that in most cases the ACO part should find (near-) optimal solutions for each optimum. If this is the case, the majority of solutions that are good enough to be added to the population should be created by ACO. Furthermore, the best solution that is found at any iteration is most likely to be found by ACO. However, it turns out that for this problem only 13.3% of the solutions that are fit enough to be added to the simulation are ACO solutions. All other solutions are created by the GA. Of the best solutions so far, only 16.0% were found by the ACO part while the total fraction of solutions created by the ACO was 34.1%. From these statistics, one can infer that an ACO
23
solution is less likely to be a good solution than a GA solution. This outcome contradicts the expected behavior of the HGAO and the fact that HGAO slightly outperformed GA can be attributed to the stochastic behavior of both methods. 6.2 Test 2: Constrained optimization with guards only The goal of the second test is to consider the optimization problem with no cameras. This might be an applicable approach in conflict situations where military units move often or in emergency situations (such as just after a natural or manmade disaster) where no camera infrastructure is available. In this case, a constraint on the minimal fraction of intruders that get caught is set to various values. The trade-offs in numbers of guards, security and total costs and fraction of apprehension will be examined. Up to 17 candidate guards (with their predefined paths) are considered, resulting in a search space of 217 = 131K. The optimization termination criterion was 300K intruder runs, equivalent to 1,597 possible security designs (for each chosen level of security). Both GA and HGAO found the same security configurations for each optimization, regardless of constraint value. Calculation times were also similar. Therefore no separate results of GA and HGAO are given. Note that in some cases the optimal security configuration is not located on a constraint, but is located in the feasible area slightly away from the constraint. If for instance h1 is set to 0.95, at least 95% of the intruders must get caught by a guard. Due to the integer number of guards, the outcome might be that if h1 is set to 0.95 the probability that an intruder gets caught is 0.97. In Figures 7 and 8 the probabilities of getting caught are not the constraint value, they are the actual probability belonging to the security configuration found. Both figures do not provide results for lower probabilities than 0.899, because if no constraints (or very loose constraints) are used, the best solution (i.e., lowest total costs) has a probability of
24
being caught of 0.895. Furthermore, regardless of constraint level, the final solution of the optimization never has less than three guards.
Number of guards
12
10 8 6
4 2 0 0.88
0.9
0.92 0.94 0.96 Probability of being caught
0.98
1
Total costs Thousands
Figure 7. Number of guards needed versus probability of being caught
1200 1000 800 600 400 200 0 0.88
0.9
0.92
0.94
0.96
0.98
1
Probability of being caught
Figure 8. Total cost versus probability of being caught When more guards are used, more intruders get caught, so the costs caused by intruders decrease. However, when more guards are used, the guard costs increase. From Figures 7 and 8 one can conclude that for strict constraints, the more guards used, the higher the total costs are. This means that the major part of the total costs must consist of guard salaries. That this is indeed
25
the case can be seen in Table 2. This table shows the total costs and the fraction of costs caused by guard salaries. Table 2: Costs for various probabilities of being caught for an intruder found by HGAO Probability of being caught 0.899 (optimal with respect to total costs) 0.957 0.962 0.972 0.976 0.981
Guard salary costs
Intruder caused costs *
$290,160 (67.5% of total costs) $386,880 (86.8% of total costs) $483,600 (89.2% of total costs) $580,320 (92.1% of total costs) $677,040 (93.0% of total costs) $967,200 (95.6% of total costs)
$139,566 (32.5% of total costs) $58,838 (13.2% of total costs) $58,525 (10.8% of total costs) $49,806 (7.9% of total costs) $51,012 (7.0% of total costs) $44,825 (4.4% of total costs)
Total costs
$429,726 $445,718 $542,125 $630,126 $728,052 $1,012,025
* Note that the costs caused by the intruder for a probability of being caught of 0.976 are slightly higher than for a probability of 0.972. This is caused by stochastic behavior of the simulation. For the optimal case with respect to total costs, three of the 17 candidate guards are required if no constraints are set. The number of guards needed to obtain a certain probability that an intruder gets caught seems to increase exponentially until it reaches a level of 10 guards (with 98.1% probability of apprehension). After 10 guards, no further improvement in the probability of being caught can be made. This is not caused by a flaw in the simulation nor in the optimization heuristic, rather it is due to the fact that the predefined candidate guard patrol paths are not above 98.1% effective. When all 17 possible guards are used, still 98.1% of the intruders get caught. To increase that percentage, more and / or different candidate guard paths would need to be defined. Figures 9 and 10 show two of the optimal configurations – one with three guards and one with six guards. The three guard solution consists solely of paths around the exterior of the building. With six guards, two more are added to the ground floor, both inside the building, while one is stationed on the second floor.
26
Figure 9. Best solution with three guards (probability of apprehension = 89.9%). Thick line: guard walks in circles. Other lines: guards walk over this line back and forth.
27
Figure 10. Best solution with six guards (probability of apprehension = 97.2%). Thick line: guard walks in circles. Other lines: guards walk over this line back and forth. Dotted line: guard walks on second floor. On all other lines the guard walks on the ground floor (or outside).
7. Discussion This chapter described the use of heuristic optimization coupled with detailed stochastic simulation to design physical security systems. Because of the computational effort needed for the simulation, the optimization routine needs to be efficient as it searches a very large combinatorial space. The heuristics described have the advantage that they can be terminated at any point and still return good solutions, and in fact, almost always experience diminishing returns over search time with respect to the objective function (see Figure 5 for example). Furthermore, the objectives and constraints are quite flexible in this method so that various problems could be posed and solved using the same simulation and the same optimization
28
framework. Trade-offs between alternative security levels and the investment needed can be ascertained. There are drawbacks to the approach. One is that candidate guard patrol paths, camera locations and details, and possible intruder scenarios have to be defined in advance. Defining these can be time consuming as well as conceptually challenging. The optimization only uses this predefined data, therefore the security design consists of elements among the pre-specified ones. A second drawback is the optimization itself. Heuristics are not guaranteed to find optima, and it is even difficult to know how close to optimal the results are. The heuristics herein discard infeasible solutions, that is those which do not meet the security constraint. It may be advantageous to include these in the population as a source of valuable information for the search mechanism. A final drawback is the simulation model. Adding more detail to it can make things even more realistic. Currently, intruder behavior is independent of security (that is, guards and cameras). This is clearly not the actual case and the simulation would be improved by adding the facility for guards, cameras and intruders to interact. This might be done by creating a network of arcs and nodes and let intruders and guards decide which arc to take at each node on the fly, based on one or several decision variables. Guards should be able to notice certain state changes (for example opening or closing doors) that have occurred, which would indicate an intrusion without seeing the intruder. Guards could then act upon this observation. However, as a first step in combining detailed simulations with optimization for design of secure facilities, this work offers value and promise. The method is not designed to be “black box”; rather it is designed to supplement human decision making to effect rigorous and defensible decisions. Certainly, when designing for securing, it is vital to know to the best degree possible the ramifications of alternative designs, and to identify all superior designs. This
29
method accomplishes these goals effectively, and should thereby be a valuable tool for security decisions.
30
9. References 1.
Ananda Rao, M., Srinivas, J., Murthy, B.S.N. Damage Detection in Vibrating Bodies using Genetic Algorithms. Computers and Structures, vol. 82, pp. 963–968. 2004
2.
Bu, T.-M., Yu, S.-N., Guan, H.-W. Binary-coding-based Ant Colony Optimization and its Convergence. Journal of Computer Science and Technology English Language Edition, vol. 19(4), pp. 472-479. 2004
3.
Cavalier, T.M., Conner, W.A., Del Castillo, E., Brown, S.I. A Heuristic Algorithm for Minimax Sensor Location in the Plane. European Journal of Operational Research, vol. 183, pp. 42-55. 2007
4.
Hamel, D., Chwastek, M., Farouk, B., Dandekar, K., Kam, M. A Computational Fluid Dynamics Approach for Optimization of a Sensor Network. 2006 IEEE International Workshop on Measurement Systems for Homeland Security, Contraband Detection & Personal Safety IEEE, Cat No. -06EX1330C, pp. 38-42. 2006
5.
Jones, D.A., Turnquist, M.A., Nozick, L.K. Simulation of Imperfect Information in Vulnerability Modeling for Infrastructure Facilities. Proceedings of the 2005 Winter Simulation Conference, ed. Kuhl, M.E., Steiger, N.M., Armstrong, F.B., Joines, J.A., pp. 965-971. 2005
6.
Jordan, S.E., Snell, M.K., Madsen, M.M., Smith, J.S., Peters, B.A. Discrete-event Simulation for the Design and Evaluation of Physical Protection Systems. 1998 Winter Simulation Conference Proceedings, pp. 899-907. 1998
7.
Kong, M., Tian, P. A New Ant Colony Optimization Applied for the Multidimensional Knapsack Problem. Simulated Evolution And Learning (SEAL) conference 2006, pp. 142149. 2006
31
8.
Nahas, N., Nourelfath, M. Ant System for Reliability Optimization of a Series System with Multiple-choice and Budget Constraints. Reliability Engineering and System Safety, vol. 87, pp. 1–12. 2005
9.
Olario, S., Nickerson, J.V. Protecting with Sensor Networks: Perimeters and Axes. Military Communications Conference (MILCOM) 2005, vol. 3, pp. 1780-1786. 2005
10.
Smith, J.S., Peters, B.A., Jordan, S.E., Snell, M.K. Distributed Real-time Simulation for Intruder Detection System Analysis. Proceedings of the 1999 Winter Simulation Conference, ed. Farrington, P.A., Nembhard, H.B., Sturrock, D.T., Evans, G.W., pp. 1168-1173. 1999
11.
Ustun, V., Yapicioglu, H., Gupta, S., Ramesh, A., Smith, J.S. A Conceptual Architecture for Static Features in Physical Security Simulation. Proceedings of the 2005 Winter Simulation Conference, ed. Kuhl, M.E., Steiger, N.M., Armstrong, F.B., Joines, J.A., pp. 958-964. 2005
12.
Yeo, B.-K., Lu, Y. Array Failure Correction with a Genetic Algorithm. IEEE Transactions on Antennas and Propagation, vol. 47(5), pp. 823-828. 1999
32
T.M.A. Marechal is a master’s student in systems engineering at Eindhoven University of Technology in The Netherlands. Currently he is working on his final thesis at Antwerp University. He performed a master’s project at Auburn University, resulting in this chapter. Marechal has a BS in mechanical engineering from Eindhoven University of Technology. His primary research interests are in simulation and optimization. Alice E. Smith is Professor and Chair of the Industrial and Systems Engineering Department at Auburn University. Previous to this position, she was on the faculty of the Department of Industrial Engineering at the University of Pittsburgh, which she joined in 1991 after industrial experience with Southwestern Bell Corporation. Dr. Smith has degrees in engineering and business from Rice University, Saint Louis University and University of Missouri - Rolla. Dr. Smith has served as a principal investigator on over $3.5 million of sponsored research and holds one U.S. patent and several international patents and has authored more than 60 publications in journals which have garnered over 500 citations (Web of Science). Dr. Smith holds editorial positions on INFORMS Journal on Computing, Computers & Operations Research, International Journal of General Systems, IEEE Transactions on Evolutionary Computation and IIE Transactions. Dr. Smith is a fellow of IIE, a senior member of IEEE and SWE, a member of Tau Beta Pi, INFORMS and ASEE, and a Registered Professional Engineer in Industrial Engineering in Alabama and Pennsylvania. Jeffrey S. Smith is Professor of Industrial and Systems Engineering at Auburn University. Prior to this position, he was on the faculty of the Industrial Engineering Department at Texas A&M University. In addition to his academic positions, Dr. Smith has held professional positions with Electronic Data Systems (EDS) and Philip Morris USA. Dr. Smith has a BS in Industrial Engineering from Auburn University and MS and Ph.D. degrees in Industrial Engineering from
33
Penn State University. His primary research interests are in manufacturing systems design and analysis and discrete event simulation. Erjen Lefeber received the M.Sc. degree in applied mathematics in 1996 and the Ph.D. degree in tracking control of nonlinear mechanical systems in 2000, both from the University of Twente, Enschede, The Netherlands. Since 2000, he has been an Assistant Professor in the Systems Engineering Group of the Department of Mechanical Engineering at Eindhoven University of Technology, Eindhoven, The Netherlands. His current research interests include modeling and control of manufacturing systems.
34