S1S1S1. SnSnSn. CEE. Replication Manager. Figure 1: System architecture of a service-oriented system. i.e., different time-varying arrival rates. We assume that ...
Proceedings of the 2011 Winter Simulation Conference S. Jain, R. R. Creasey, J. Himmelspach, K. P. White, and M. Fu, eds.
OPTIMIZING SERVICE REPLICATION IN CLOUDS
Mathias Bj¨orkqvist
Lydia Y. Chen
IBM Research Zurich Lab S¨aumerstrasse 4, R¨uschlikon, Switzerland
IBM Research Zurich Lab S¨aumerstrasse 4, R¨uschlikon, Switzerland Walter Binder University of Lugano Lugano, Switzerland
ABSTRACT The load on today’s service-oriented systems is strongly varying in time. It is advantageous to conserve energy by adapting the number of replicas according to the recent load. Over-provisioning of service replicas is to be avoided, since it increases the operating costs. Under-provisioning of service replicas leads to serious performance degradation and violates service-level agreements. To reduce energy consumption and maintain appropriate performance, we study two service replication strategies: (1) arrival rate based and (2) response time based policy. By simulation, we show that the average number of service replicas and response time can be reduced especially when combining our proposed replication strategies and load balancing schemes. 1
INTRODUCTION
Service-oriented systems, composed of distributed web services, are commonly hosted in cloud environments (Alonso, Casati, Kuno, and Machiraju 2004, Papazoglou, Traverso, Dustdar, and Leymann 2008). Clients’ requests, consisting of multiple invocations of web services, show a strong time varying behavior, e.g., time of day and day of the week effects (Arlitt and Jin 2000). Such systems process clients’ requests by invoking corresponding types of service compositions, which are often represented as business processes or as workflows of services and typically deployed upon startup of the system.In this paper, the term “composition” refers to any composition of Web services, and the term “composition execution engine (CEE)” refers to middleware for executing compositions, such as BPEL engines (Bianculli, Binder, and Drago 2010). A dedicated engine, i.e., composition execution engine, invokes corresponding services, of which multiple replicas are deployed on different system components. Providers of service-oriented systems aim at delivering performance targets specified in service-level agreements in a cost effective manner. Clearly, the performance of the systems hinges on the scalability of the CEE and service replicas in processing time-varying requests. When a CEE effectively distributes loads onto service replicas, the response time, i.e., service composition invocation time and the corresponding queueing times, can be reduced (Bj¨orkqvist, Chen, and Binder 2010) without incurring extra operational cost. Statically providing a maximum number of service replicas may guarantee the required performance at a high operation cost, i.e., the cost is directly proportional to the number of active service replicas. Related studies (Chen, Das, Qin, Sivasubramaniam, Wang, and Gautam 2005, Lin, Wierman, Andrew, and Thereska 2011) show that dynamically and accurately adjusting service capacities, i.e., the number of active service replicas, according to clients’ workloads leads to a significant cost saving without performance
978-1-4577-2109-0/11/$26.00 ©2011 IEEE
3312
Bj¨orkqvist, Chen, and Binder degradation. Consequently, to strike a good balance between performance targets and operational cost, it is crucial to control the number of active replicas for each service, as well as to choose invocation distributing algorithms at the CEEs. Optimal provisioning of service replicas are mainly shown for simple web hosting systems (Gandhi, Gupta, Harchol-Balter, and Kozuch 2010, Lin, Wierman, Andrew, and Thereska 2011), i.e., clients send requests directly to a single service, modeled as a single queue with multiple servers. The load balancing effect among service replicas is thus not considered by most existing studies on dynamic service provisioning. The optimal rule of thumb is to control the number of service replicas as a non-decreasing function of arriving requests. However, it is not clear what the optimal replication policy is for service systems consisting of CEEs and multiple services with multiple replicas. The interaction of load balancing among multiple replicas and replication policies is not well understood. In this paper, we consider a provider of a service-oriented system, which consists of a CEE as well as different service replicas. The CEE handles all clients’ requests by executing compositions and invoking services. Consequently, all the workload and performance metrics related to service replicas can easily be collected by the CEE. Various load balancing schemes, e.g., join the shortest queue (JSQ), can easily be embedded in the CEE when invoking a service from a replica. To minimize the operational cost while maintaining target performance metrics, we develop a service replica controller in the CEE, which adjusts the number of active service replicas based on observed statistics, e.g., the arrival rate and response time. Essentially, the CEE decides which service replica to invoke when executing compositions, and it decides when to activate a particular service replica, respectively when to reduce the number of active replicas. In particular, our performance objective is to minimize the number of active service replicas while maintaining a target system utilization. To such an end, we first consider two load balancing algorithms, random, a completely load oblivious one, and join the shortest queue algorithm, an almost optimal strategy (Gupta, Harchol-Balter, Sigman, and Whitt 2007, Whitt 1986) in different system scenarios. To dynamically adjust the provisioning of replicas according to the workloads, we develop a service replica controller based on two policies, which activate and deactivate the active number of service replicas in slotted windows. The first policy is based on the observed service arrival rates, denoted as A-policy. The second policy controls the number of active service replicas via observed response time, referred to as R-policy. The scientific contributions of this paper are twofold. First, we build a service-oriented system model, which captures key system features, i.e., a CEE and multiple service replicas. In turn, we investigate how a CEE can dynamically adjust the replicas provisioning by adopting load balancing algorithms and service replication policies. Secondly, we develop two service replication policies, A-policy and R-policy, for service-oriented systems. Both policies are very effective in reducing the number of active servers while maintaining the performance targets, i.e., utilization and response time. This paper is organized as follows: The system architecture is explained in Section 2. The proposed service replication policies are described in Section 3. Section 4 contains the experimental results. Section 5 concludes this paper. 2
A SERVICE-ORIENTED SYSTEM
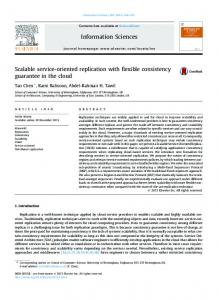
The basic components of a service-oriented system, depicted in Figure 1, are clients, a CEE, and service replicas. In the following, we first explain the client requests of different types of service compositions and how the CEE invokes the corresponding services from active service replicas. Secondly, we illustrate the algorithms in the service invoker. The service replica controller and its replication policies are introduced in the next section. 1. Clients and Request workloads Clients send their requests to the CEE. We categorize workload requests into multiple types, each of which are defined by the flows/composition of available services in the system. A request may consists of multiple service invocations. Each type of workload request has different characteristics,
3313
Bj¨orkqvist, Chen, and Binder Clients
CEE (Replicated)
Service Types (Replicated) S1 SS 11 S1
C1 CEE Cm
Sn Sn Sn Sn
Replication Manager
Figure 1: System architecture of a service-oriented system. i.e., different time-varying arrival rates. We assume that each request type is a Poisson process (Kleinrock 1976). For example, a system considered has two kinds of services, S1 , S2 . Two types of requests’ service compositions are {S1 , S2 }, and {S2 , S2 }. For the first type of workload, S1 is first invoked and then S2 , whereas S2 is invoked twice consecutively in the second type of workload. 2. Composition Execution Engine (CEE) Once a request is received by the CEE, it immediately starts executing the requested workload. The CEE uses one of T threads, to select and invoke the corresponding services, which are defined in the composition of request workload. During the time when service invocation is executed on replicas, the CEE threads are idling. Note that we interchangeably use replicas and service replicas. The CEE invokes the services in a stateless fashion, i.e., each service invocation decision is made independently of the previous invocations. For example, when the composition of a request is {S1 , S2 }, a CEE thread randomly selects and invokes one of the service 1 replicas. After the invocation of service 1 is completed, the CEE thread proceeds to invoke service 2 from one of its replicas. We assume a CEE has a single queue and multiple threads, which can only process a single request at a time. All clients’ requests are served by CEE threads in a FCFS scheduling discipline. The service selection and invocation of each thread is done independently from the others. A highlylevel queueing schematic of a service-oriented system is illustrated in Figure 2. We further assume that a CEE thread has a time overhead, tc , to select and invoke services specified in the request compositions and tc is modeled by an exponential distribution with a rate µc . 3. Services and service replicas The system hosts multiple types of services, denoted by Si , each of which has ni number of active replicas. A maximal number of service replicas, N, can be used among all service types, i.e., ∑i ni ≤ N. Service replicas can be activated or deactivated in slotted windows by the service replica controller. When the controller deactivates a replica, the replica receives no more invocation requests, but it still needs to complete the processing of any remaining service invocations in its queue. When a replica is activated, it takes negligible warm up time before starting to process the incoming service invocation requests. We model each service replica as a simple queueing system with one queue and one server, as shown in Figure 2. An active replica processes service invocation requests sent by the CEE in a FCFS manner, and the invocation time is assumed exponentially distributed with a rate µi The response time of an service invocation is the sum of the invocation time and the queueing time at the service replica.
3314
Bj¨orkqvist, Chen, and Binder
Figure 2: An abstract queueing model of a service-oriented system.
2.1 Service Invoker As the CEE executes clients’ requests and invokes compositions of services from replicas, performance metrics, e.g., the invocations at replicas’ queues, and average response time of service invocation, can be collected from the CEE with a low overhead. As a result, we focus on centralized algorithms to design the service invoker as well as the service replica controller described in the following section. For all services in a composed request, the service invoker selects one of the available replicas to send the request to via load balancing algorithms. The two load balancing algorithms considered are random and Join the Shortest Queue (JSQ). The random algorithm is completely load oblivious, whereas JSQ is load aware and efficient in reducing response time (Gupta, Harchol-Balter, Sigman, and Whitt 2007, Bj¨orkqvist, Chen, Vukolic, and Zhang 2011) and balancing loads on replicas. 3
SERVICE REPLICA CONTROLLER AND REPLICATION POLICY
Intuitively, over-provisioning of service replicas may lead to a low response time of service invocations and low utilization of active replicas, whereas under-provisioning of replicas leads to the opposite. For a system provider, in addition to fulfilling client requests with low response times, it is crucial to manage the replicas in a cost effective manner, i.e., keep the number of active replicas low and the active replicas well utilized. Consequently, we aim to control service replicas such that the utilization of the active replicas is maintained at a target value and the response time is low. Nonetheless, the lower the number of activated replicas is, the more cost savings can be achieved. The service replica controller here can activate and deactivate service replicas of different services in slotted windows. At the beginning of a control window, statistics are collected from all active replicas and replicas are then set to be activated or deactivated according to the replication policy. To achieve a target utilization and low response time with a minimal number of active replicas, we develop two replication policies: an arrival rate based policy (A-policy) and a response time based policy (R-policy). 3.1 Arrival Based Policy: A-Policy To capture the time-varying nature of the request workloads, the A-policy collects the arrival rates, λi (t), i ∈ {1, . . . I}, of all services in all control windows, t ∈ {1, . . . T }. Note that λi (t) is the aggregate number of arrivals to all replicas of service i. As the utilization of the active replicas needs to be kept at a target
3315
Bj¨orkqvist, Chen, and Binder value, U ∗ , the A-policy activates a number of service i replicas, ni (t), such that Ui (t) =
λd i (t) ≤ U ∗ , ∀i,t µi ni (t)
where λd i (t) is the estimate of λi (t) and µi is the average invocation rate of a single server i replica. The A-policy uses the most recently observed value as a prediction for λd i (t), i.e., using the arrival rate of the previous control window, λd i (t) = λi (t − 1), ∀i,t. Essentially, the A-policy controls ni (t) by ni (t) = d
λi (t − 1) e, ∀i,t. µiU ∗
The A-policy aims to maintain the target utilization of system without optimizing the response time of service invocations. As the arrival rates are aggregated from all active replicas, the A-policy overlooks the impact of the load balancing algorithm used in the service invoker. 3.2 Response Time Based Policy: R-Policy The R-policy aims to maintain the target utilization of the service replicas by monitoring the average response time of the service invocations over active service replicas, Ri , which implicitly incorporates the effect of load balancing algorithms used at the invoker. The R-policy first computes the target response time, R∗i , based on the target utilization and system model described below. Thereafter, it increases or decreases the number of service replicas depending on the difference of observed response time, Ri (t), and R∗i . To compute the target R∗i from U ∗ , we assume all active replicas are equally utilized at the target utilization, U ∗ , in all control windows. With such an assumption, the response time of all active replicas can be predicted by the single service replica, which is a well analyzed simple queueing system. Furthermore, we propose to compute R∗i base on a simple M/M/1 queueing system (Kleinrock 1976), R∗i =
1/µi . 1 −U ∗
(1)
Note that M/M/1 is an simple first order estimation, which may not be accurate on all workloads, e.g., different statistical distribution, different systems scenarios, and different service invocation algorithms. The R-policy adjusts the number of replicas by incrementing (decrementing) χ i (χ d ) the number of existing active service replicas at the beginning of the windows. When observing that Ri (t − 1) is above R∗ , the R-policy activates χ i more replicas for service i. To avoid a severe under-provisioning of replicas, the R-policy is conservative in deactivating replicas, i.e., replicas are deactivated only when R(t − 1) < R∗ α, where 0 < α < 1. The higher the α value is, the more aggressive the R-policy is in decrementing the number of service replicas. For example, the R-policy sets R∗ = 5, χ i = χ d = 2, and α = 0.8. When R(t − 1) is observed to be less than 5 ∗ 0.8 time units, two service replicas will be deactivated. When R(t − 1) is more than t time units, two extra service replicas will be activated. Note that the values of χ i , χ d and α can be optimized by training the controller with different workloads, but such an optimization procedure is out of the scope of this paper. 4
EVALUATION
In this section, we evaluate the proposed replication policies combined with service invocation algorithms by the saving of replicas and target performance metrics, i.e., the response time and the utilization of the 3316
Bj¨orkqvist, Chen, and Binder replicas. We first describe the simulated environment and clients’ workload requests in two different system scenarios. Our evaluation results, based on the average of ten simulation runs, show that both service replication policies, the A-policy and the R-policy, can effectively reduce the consumption of replicas, especially when using the JSQ balancing algorithm, while maintaining the target utilization and minimizing the response time of service invocations. 4.1 Simulator We built an event-driven simulator of service-oriented systems, shown in Figure 2, in Java. Clients generate requests, which ask for different types of service compositions. A CEE has T = 500 threads to select and invoke composed services in a request in a parallel fashion. The processing time of selecting and invoking a service by a CEE thread is modeled using an exponential distribution with a rate µc = 2. The service invoker uses random or JSQ algorithms for selecting service replicas on a per service invocation basis. The service replication controller uses either the A-policy or the R-policy to activate/deactivate replicas of all services at the beginning of a window, which has a fixed length of 500 seconds. In particular, we consider the following two specific system scenarios and their request workloads: •
•
System scenario I: The system provides a single kind of service, namely S0 . Clients’ requests correspond to three types of request workloads (or service compositions): {S0 }, {S0 , S0 }, and {S0 , S0 , S0 }. The maximum number of replicas available is 25. The arrival rates of each workload type is depicted in Figure 3 (a). The average service rate of a single service replica is µ0 = 1, following an exponential distribution. System scenario II: The system provides two services, namely S0 and S1 . Clients requests correspond to three types of request workload (or service compositions): {S1 , S1 , S0 }, {S0 , S0 , S1 }, and {S1 , S0 , S1 }. The maximal number of replicas available for S0 and S1 are 28 and 18, respectively. The arrival rate of each type is depicted in Figure 3 (b). The average service rate of a single service replica for S0 and S1 are µ0 = 1 and µ1 = 1.5, following exponential distributions. 8
4
Type 1 Type 2 Type 3
3 2.5 2 1.5 1
6 5 4 3 2 1
0.5 0 0
Type 1 Type 2 Type 3
7 request arrival rate
request arrival rate
3.5
5
window no.
10
0 0
15
(a) System scenario I.
5
window no.
10
15
(b) System scenario II.
Figure 3: Arrival rates of different types of clients’ requests (service compositions). Note that we further assume client requests of all types arriving at both system scenarios to be Poisson processes with average rates as depicted in Figure 3. Moreover, we assume the request arrival rates to be constant within a control window. We set the target utilization of the active service replicas to be 80%, U ∗ = 0.8, for both the A-policy and the R-policy under both system scenarios. Following Eq. 1, the target response time is R∗ = 5 for the 3317
Bj¨orkqvist, Chen, and Binder Table 1: System scenario I. Replication policy Invocation algorithm Replica savings [%] U0 [%] R0 [s]
A-policy random JSQ 26.65 26.58 73.05 73.26 5.6 1.68
R-policy random JSQ 15.08 24.05 62.99 70.41 5.03 4.31
Static Policy random 0 53.27 2.67
R-policy. The other parameters used in the R-policy are the number of replica increments, χ i , the number of replica decrements, χ d , and the response time tolerance threshold for deactivating replicas, α. As optimal values of those parameters depend very much on the workloads, we specify them in the subsections of system scenarios. We collect the following performance metrics when evaluating the two proposed policies combined with the invocation balancing algorithms: •
• • •
Replica savings. This is computed as the average number of active replicas normalized by the maximal number of replicas available for each service. Using this metric, one can estimate the cost savings, given the target performance. Ui , average utilization of active replicas of Si . This is computed from the utilization of the active replicas of service i, Ui (t), across all control windows. Ri , the average response time of an invocation of service i. In particular, to achieve U ∗ = 80%, the R-policy adjusts the number of active replicas by maintaining Ri = 5. The average response time of all types of client requests, each of which consists of one or more service invocations. This value includes the CEE processing time, the service invocation time and the corresponding queueing times.
For the purpose of comparison, we additionally simulate the static replication policy which keeps the number of active service replicas at the maximum, in combination with the random policy. 4.2 System Scenario I The control parameters used in the R-policy are χ i = 1, χ d = 1, and α = 0.8. Essentially, the R-policy activates one more replica when the observed response time of service invocation is more than R∗ = 5, whereas it deactivates one replica when the observed response time is less than 4 (5 · 0.8). We summarize the simulation results of scenario I in Table 1. In Figure 4, we illustrate the run-time results of a single simulation run under the A- and R- policies combined with JSQ. The following observations can be made: •
•
•
In general, the A-policy can achieve a better replica saving and target utilization value, U ∗ = 80%, than the R-policy. As the A-policy does not consider the impact of invocation algorithms, there is no difference in replica savings between random and JSQ. On the contrary, the R-policy can achieve higher replica savings under JSQ than random. JSQ can efficiently decrease the response time of service invocation, especially when the number of replicas are well provisioned. Under the A-policy and JSQ, the response time is lower than with the static policy while achieving a better replica utilization and cost saving. From the perspective of the response time, the R-policy indeed achieves its target values, i.e., 5, for both random and JSQ algorithms, though the average utilization of active replicas, U0 , is slightly below the target value. As the R-policy only activates and deactivates one replica at a time, it adjusts the number of service replicas in a smooth manner. Consequently, the values of R0 (t) and U0 (t) depicted in Figure 4 (b) both oscillate more with the R-policy than with the A-policy. Clearly, the incremented and decremented number of replicas specified in R-policy are highly correlated with the workload. The optimal parametrization of the R-policy will be future work.
3318
Bj¨orkqvist, Chen, and Binder Table 2: System scenario II. Replication policy Invocation algorithm Services replicas saving [%] Ui [%] Ri [s]
R-policy random JSQ S0 S1 S0 S1 11.17 11.12 18.79 20.74 69.45 72.55 75.54 81.10 7.75 4.66 8.93 4.81
Static policy random S0 S1 0 0 61.63 64.64 3.39 2.45
From Figure 4 (a), it can clearly be seen that the A-policy can maintain the target utilization values with a maximum of one window delay, due to the last value prediction of arrival rates. Nevertheless, such a prediction scheme for arrival rates may not be optimal for highly varying request workloads. 20
10
10
20 10 0
n0(t)
20 10 0
10 5 0
R0(t) [s]
10 5 0
100 50
2
4
6
8 10 window no.
12
14
U0(t) [%]
0
U0(t) [%]
0 n0(t)
λ0
20
R0(t) [s]
λ0
•
A-policy random JSQ S0 S1 S0 S1 15.40 11.33 14.93 11.30 72.94 72.86 72.87 73.01 9.79 4.20 3.24 1.23
(a) A-policy with JSQ.
100 50
2
4
6
8 10 window no.
12
14
(b) R-policy with JSQ.
Figure 4: System scenario I: run time results of all control windows.
4.3 System Scenario II The control parameters used in the R-policy are χ i = 3, χ d = 1, and α = 0.8. Essentially, the R-policy activates three more replicas when the observed average response time of service invocation in a window is more than R∗ = 5, whereas it deactivates one replica when the observed response time is less than 4. We summarize the simulation results of scenario II in Table 2. We illustrate the run-time results of a single simulation run under the A- and R-policies combined with JSQ in Figure 5. The workload in scenario II is more dynamic than scenario I, as shown by λi (t). Compared to scenario I, the replica savings of both A- and R-policies decrease. Moreover, the difference in replica savings between the A- and R-policies diminishes. For S0 , the R-policy combined with the random algorithm can have a better replica saving, lower utilization, and lower response time than the A-policy with the random algorithm. This implies that the last value prediction for arrival rates used in the A-policy may not optimal. On the other hand, the parameters used in the R-policy appear to be reasonable choices. The utilization of active replicas for all services under both policies are well kept under the target values, whereas the invocation response times are quite above the target response time, 5, especially for S0 . Similar to scenario I, one can make the observation that (1) JSQ reduces response time effectively under a given policy, (2) the values of Ui (t) and Ri (t) fluctuate more under the R-policy, and (3) the difference between JSQ and random is smaller when applying the R-policy.
3319
25 20 15
1
10 5 0
s0
100
s0 4
6
8 10 window no.
12
14
1
s0
20
s1
10 5 0
s0
100
s0
i
1
2
S
10
s
s1
S0
R (t) [s]
Ri(t) [s]
i
s1
25 20 15 30
n (t)
s0
20 10
Ui(t) [%]
λ
S
30
50
i
S0
Ui(t) [%]
ni(t)
λi
Bj¨orkqvist, Chen, and Binder
50
(a) A-policy with JSQ.
s
1
2
4
6
8 10 window no.
12
s1
14
(b) R-policy with JSQ.
Figure 5: System scenario II: run time results of all control windows. 4.4 Response Times of Client Requests & Service Invocation We depict the response times of client requests, which are configured into three types in scenarios I and II, in Figure 6. For scenario I, the request response times are well captured by the response time of service invocations and CEE processing time. Specifically, applying the A-policy and JSQ results in the lowest request response times. Similarly, for scenario II, the request response times are well reflected by the invocation response times under both policies and algorithms, except the R-policy combined with JSQ. When applying the R-policy with JSQ, the replica controller is so aggressive in saving replicas that all active service replicas, as well as the CEE, become very saturated (see replica savings in Table 2). Although the CEE here has a high number of threads, it is still limited in accommodating all the arriving requests immediately and the queueing times are incurred at the CEE. 20
15
40
A−policy & rnd A−policy & JSQ R−policy & rnd R−policy & JSQ
35 30
A−policy & rnd A−policy & JSQ R−policy & rnd R−policy & JSQ
10
[s]
[s]
25 20 15 5
10 5
0
Type 1
type 2
0
Type 3
(a) System scenario I.
Type 1
Type 2
Type 3
(b) System scenario II.
Figure 6: The average response time of all three types of client requests.
5
CONCLUSION
In this paper, we study a service-oriented system hosting a CEE and multiple services. To achieve the objectives of reducing the operational cost, maintaining the system utilization, and minimizing the invocation response time, we develop two service replication policies, namely A-policy and R-policy, in combination with different load balancing algorithms, random and JSQ. Our simulation results show that both proposed policies can achieve the objectives under different system scenarios and request workloads well. In particular, when applying the A-policy with JSQ, replica saving can be maximized and a very low response time 3320
Bj¨orkqvist, Chen, and Binder maintained, compared to the static provisioning of a maximal number of replicas. In the future we will explore our proposed replication policies using real system traces and develop auto tuning mechanisms for workload prediction, used in the A-policy, and control parameters, used in the R-policy. REFERENCES Alonso, G., F. Casati, H. A. Kuno, and V. Machiraju. 2004. Web Services - Concepts, Architectures and Applications. Data-Centric Systems and Applications. Springer. Arlitt, M., and T. Jin. 2000. “Workload Characterization of the 1998 World Cup Web Site”. IEEE Transaction on Network 14 (3): 30–37. Bianculli, D., W. Binder, and M. L. Drago. 2010. “Automated Performance Assessment for Service-oriented Middleware: A Case Study on BPEL Engines”. In Proceedings of ACM International World Wide Web Conference (WWW), edited by M. Rappa, P. Jones, J. Freire, and S. Chakrabarti, 141–150. Bj¨orkqvist, M., L. Y. Chen, and W. Binder. 2010. “Load-Balancing Dynamic Service Binding in Composition Execution Engines”. In Proceedings of IEEE Asia-Pacific Services Computing Conference (APSCC), edited by S. Wu and B. Zhou, 67–74. Bj¨orkqvist, M., L. Y. Chen, M. Vukolic, and X. Zhang. 2011. “Minimizing Retrieval Latency for Content Cloud”. In Proceedings of IEEE INFOCOM, edited by L. M. Ni and W. Zhang, 1080–1088. Chen, Y., A. Das, W. Qin, A. Sivasubramaniam, Q. Wang, and N. Gautam. 2005. “Managing Server Energy and Operational Costs in Hosting Centers”. In Proceedings of ACM SIGMETRICS, edited by D. L. Eager, C. L. Williamson, S. C. Borst, and J. C. S. Lui, 303–314. Gandhi, A., V. Gupta, M. Harchol-Balter, and M. A. Kozuch. 2010. “Optimality Analysis of EnergyPerformance Trade-off for Server Farm Management”. Performance Evaluation 67 (11): 1155–1171. Gupta, V., M. Harchol-Balter, K. Sigman, and W. Whitt. 2007. “Analysis of join-the-shortest-queue routing for web server farms”. Perform. Eval. 64 (9-12): 1062–1081. Kleinrock, L. 1976. Queueing Systmes. Wiley. Lin, M., A. Wierman, L. L. H. Andrew, and E. Thereska. 2011. “Dynamic Right-sizing for Power-proportional Data Centers”. In Proceedings of IEEE INFOCOM, edited by L. M. Ni and W. Zhang, 1098–1106. Papazoglou, M. P., P. Traverso, S. Dustdar, and F. Leymann. 2008. “Service-Oriented Computing: A Research Roadmap”. Int. J. Cooperative Inf. Syst. 17 (2): 223–255. Whitt, W. 1986. “Deciding Which Queue to Join: Some Counterexamples”. Operation Research 34 (1): 55–62. AUTHOR BIOGRAPHIES ¨ MATHIAS BJORKQVIST Mr. Bj¨orkqvist is a software engineer at IBM Zurich Research Lab since 2007. He received a MSc degree in Computer Science from Helsinki Technical University in 2007, and also completed undergraduate studies at Institute Eurecom. He is a member of IEEE, and co-editor of the Use Cases document in the Technical Committee for standardizing the Key Management Interoperability Protocol (KMIP) in OASIS. LYDIA Y. CHEN Dr. Lydia Chen is a performance analyst at IBM Zurich Research Lab since 2007. She received PhD in Operations Research and Industrial Engineering from Penn State University. She completed undergraduate studies at National Taiwan University and British Columbia University. She has published papers in conferences, e.g., Sigmetrics and INFOCOM. She has served as a TPC member on a number of networking and performance conferences, including INFOCOM, GLOBECOM, and ICC. She is a member of the ACM and IEEE. WALTER BINDER Walter Binder is an assistant professor at the Faculty of Informatics, University of Lugano, Switzerland. He holds a MSc., a PhD., and a venia docendi from the Vienna University of
3321
Bj¨orkqvist, Chen, and Binder Technology, Austria. Before joining the University of Lugano, he was post-doctoral researcher at the ´ Artificial Intelligence Laboratory, Ecole Polytechnique F´ed´erale de Lausanne (EPFL), Switzerland. His main research interests are in the area of dynamic program analysis, virtual execution environments, aspect-oriented programming, resource management, and service-oriented computing.
3322