Dodecahedron sound sources are widely used for acoustical measurement purposes as they ... sound sources was investigated by Tarnow2 and was based on.
Preprint version of the paper published on the Journal of Acoustical Society of America 134(3):2013, 2037-2048
Optimizing stepwise rotation of dodecahedron sound source to improve the accuracy of room acoustic measures Francesco Martellotta Dipartimento ICAR, Politecnico di Bari, via Orabona 4, I70125 Bari, Italy
Dodecahedron sound sources are widely used for acoustical measurement purposes as they produce a good approximation of omnidirectional radiation. Many evidences show that such an assumption is acceptable only in the low-frequency range (namely below 1 kHz), while at higher frequencies sound radiation is far from being uniform. In order to improve the accuracy of acoustical measurements obtained from dodecahedron sources, international standard ISO 3382 suggests an averaging of results after a source rotation. This paper investigates the effects of such rotations, both in terms of variations in acoustical parameters and spatial distribution of sound reflections. Taking advantage of a spherical microphone array, the different reflections patterns were mapped as a function of source rotation, showing that some reflections may be considerably attenuated for different aiming directions. The paper investigates the concept of averaging results while changing rotation angles and the minimum number of rotations required to improve the accuracy of the average value. Results show that averages of three measurements carried out at 30° angular steps are closer to actual values and show much less fluctuation. In addition, an averaging of the directional intensity components of the selected responses stabilizes the spatial distribution of the reflections.
I.
not a concern for most architectural acoustics measurements. However, an increased interest towards the extremes of the audible spectrum, combined with the need to measure impulse responses (IRs) with a flat frequency response over the spectrum, mostly for auralization purposes, presented researchers with conflicting needs. Considerable lowfrequency power can only be achieved by larger loudspeaker diaphragms and cabinets, but this affects the isotropic behavior of the source, limiting it to lower frequencies. Conversely, using smaller sources to improve omnidirectional behavior in the high-frequency region clearly reduces the emitted power. In order to produce enough power and isotropic behavior over a broader spectrum of interest, Behler3 proposed a three-way loudspeaker made of a small dodecahedron (8.5 cm diameter) for high frequency emission, a larger dodecahedron (25 cm diameter) for medium frequencies, and a sub-woofer to cover the low frequency part from 50 Hz to 250 Hz. With proper equalization, the system provides a relatively flat omnidirectional response up to 12.5 kHz. As the centers of the three sources are not coinciding, being mounted along a vertical axis, two different measurements are made using only one dodecahedron at a time to improve accuracy. The IRs are then combined through a complex sum. For auralization purposes, the perfect coincidence of the sound sources was deemed to be less important so the three components could be run simultaneously. In recent years several investigations have been carried to clarify how the non-isotropic behavior of the sound sources may affect the measured parameters. In particular, as ISO 3382 often suggests the use of single-number parameters averaged over different octave bands, Witew and Behler4 analyzed how different dodecahedron sound sources affect the measurements when they are rotated about their vertical axes. Results showed that larger errors appeared at frequencies above 1 kHz when conventional sources where used, while the three-way source behaved generally better. A more detailed study was carried out by San Martin et al.5 who used two conventional dodecahedron sources in different
INTRODUCTION
Measurements of objective parameters in architectural acoustics play an important role in characterizing room behavior and how the sound propagates. In particular, the wellknown correlations between objective measures and subjective attributes of the sound field are often determining to assess the quality of a room. In addition, the correctness and reliability of a set of measurements is of major importance to get reproducible results between different teams, to make comparisons between different rooms, to calibrate and analyze virtual models, and to perform auralizations. An important reference to help both researchers and professional acousticians to get reliable measurements is the ISO standard 3382-11 which has been recently updated and extended. The standard describes the characteristics that the different components of the measurement chain must have, defines the best approach to analyze the results, and the frequency range of interest. In particular, the standard requires that the sound source must be as omnidirectional as possible, an aspect that is assessed by verifying that the maximum level deviations, averaged over a gliding 30° arc in free field conditions, comply with given values (with a maximum deviation of ±6 dB at 4 kHz). One of the most successful attempts to obtain such omnidirectional characteristics using electro-acoustical sound sources was investigated by Tarnow2 and was based on the use of platonic solids with a sufficient number of faces. The best performance was predicted for dodecahedron and icosahedron shapes, which theoretically ensured a nearly isotropic behavior up to a normalized frequency of 3 ka, where k is the wavenumber (2πf/c) and a is the source radius. This means that a radius of 0.12 m may ensure isotropic behavior up to 1 kHz. Since then, such shapes have become a sort of industry standard that is widely accepted by the scientific community. For many years, the high-frequency directivity and low-frequency sound power limitations were
1
Preprint version of the paper published on the Journal of Acoustical Society of America 134(3):2013, 2037-2048 attempt to clarify this point has been made by Hak et al.12 who analyzed the maximum deviations of sound pressure level resulting from equi-angular rotations of a dodecahedron source. They concluded that a minimum of five equi-angular steps is required to minimize level fluctuations below 0.5 dB independent of source-receiver distance. They found this number assuming equi-angular rotations over the whole 360° range to get the most general results, independent of the theoretical 120° symmetry that dodecahedron sources should have and that could be impaired by irregularities in individual loudspeakers. However, if the polar pattern of the source exhibits the 120° symmetry, the number of rotations could be likely kept within the limit prescribed by ISO standard (allowing faster measurements), without loss of accuracy. The present paper discusses the effects of source rotation on sound level and other acoustic parameters, and aims at proposing an optimal combination of rotation angles capable of providing more reliable acoustical parameters, even in the high-frequency range. The averaging of measured IRs from selected rotation angles is finally discussed in order to understand whether such an approach can be used not only to get better measurements, but also to improve IRs used for auralization purposes.
concert halls, analyzing the fluctuations of acoustic parameters as a function of source rotation (over a 120° angular span) with reference to subjective limens of perception, the so called just noticeable difference (JND). Results showed that above 1 kHz significant fluctuations appeared, and the most sensitive parameters were sound strength (G), clarity (C50), and interaural cross-correlation coefficient (IACC), with a significant role played by direct sound (mostly dependent on the lobe position). Further studies by San Martin and Arana6 showed through simulation that in a concert hall a significant percentage of seats may be affected by noticeable differences in acoustic parameters as a function of frequency (up to 80% at 8 kHz), depending on source orientation and its placement in the room. The need for truly omnidirectional sound sources encouraged many researchers to find possible alternatives to dodecahedron sources. Leishman et al.7 investigated whether other regular polyhedrons may perform better than dodecahedrons while keeping fixed two geometrical parameters (mid-radius or volume). Results showed, among other things, that no shape behaved much better than the others over a broad bandwidth. However, a tetrahedron source was found to be a reliable alternative to a dodecahedron as it showed the most uniform radiation in the high-frequency range. The above-mentioned limits of electro-acoustic sources, particularly in the high-frequency range, stimulated interest in purely impulsive sources that have been long criticized for their lack of repeatability and questionable directional properties.8,9 So, sound sources like the “clapper”10 or the classic balloons11 have been carefully characterized both in terms of spectrum and directivity. In the first case, directional fluctuations of about 3 dB appeared in the low frequency range, increasing to 5 dB above 1 kHz. In the second case fluctuations below 500 Hz were in the 6-9 dB range, decreasing to about 4 dB above 1 kHz. Consequently, neither source complied with ISO requirements in the low-frequency range, while they satisfy the requirements in the high frequency range. In particular, Patynen et al.11 confirmed, as observed by Griesinger9, that the directivity pattern of a popped balloon is influenced by the pin-prick point. A lowfrequency energy peak occurs in that direction while a highfrequency peak occurs in the opposite direction. Regardless, none of the mentioned impulsive sources represent a reliable alternative to electro-acoustic sources. At this point, it is clear that most sources complying with the directivity limits stated by ISO 3382-1 can nonetheless cause audible variations in perceived sound and significant variations in measured parameters, depending on the source orientation. The three-way source developed by Behler may represents a noteworthy exception, but its usage is currently limited. A possible alternative that could help aid the use of conventional dodecahedron sources is found in Annex A.4 of ISO 3382-1, which states, “If the source directivity is close to the minimum limits, the measurement should be repeated with the source turned in at least three steps totally. The resulting parameters related to the different angles of the source should be arithmetically averaged.” The standard does not specify how the source should be rotated, leaving the question open as to which is the best combination of angles to be used. An
II.
METHODS
A.
Measurement technique
Two commercially available sound sources were used for the investigation. The first (L1) was a 38 cm diameter dodecahedron with a dedicated equalization circuit built into the amplifier. It was capable of providing a nearly flat frequency response from 40 Hz to 20 kHz. According to its technical specifications, the source complies with ISO 3382 requirements. The second source (L2) was a 31 cm spherical enclosure with twelve loudspeaker drivers and an additional sub-woofer. The system had a usable bandwidth from 40 Hz to 12.5 kHz and directivity again complying with ISO 3382. Impulse responses were obtained by deconvolving a 7 s logarithmic sine sweep generated using MATLAB according to the method of Müller and Massarani13. The sweep covered the frequencies from 40 Hz to 12.5 kHz (through the 8 kHz octave band). As a first check, the two sources were analyzed in a very dry room to characterize their direct sound behavior at 1.5 m and confirm that the ISO 3382 directivity requirements were actually met. The room had internal dimensions of 3.7 x 2.5 x 2.4 m, with an average mid-frequency (500 Hz-1 kHz) reverberation time of 0.09 s that grows up to 0.35 s at 63 Hz. For both sources the sound level distribution along the whole 360° arc (in 5° steps) was determined using a GRAS 40AR microphone and results were averaged for groups of six consecutive responses to give the “gliding” 30° arc values. Time windowing was applied to the direct sound to exclude any additional reflections. As shown in Fig. 1, both sources comply with ISO 3382 requirements, with maximum deviations that are well below the prescribed limits. The dry room measurements were also used to characterize the polar emission of both sources, as described in Sec. III.A.
2
Preprint version of the paper published on the Journal of Acoustical Society of America 134(3):2013, 2037-2048 The sources were then moved to a reverberant chamber (with a volume of 200 m3) filled with sound absorbing materials to keep the reverberation time relatively low (1.3 s at midfrequencies on average) and approximate conditions usually found in performance spaces. At this stage, the source-receiver distance was set to 5 m and the whole set of acoustic parameters was calculated using IRs recorded through a SoundField MKV microphone.
two different microphones located in symmetrical positions (even though the room furniture was not perfectly symmetrical) at 5 m and 10 m distances. The first microphone was the same SoundField MKV used in the reverberant chamber, while the second was an mh Acoustics Eigenmike32 (EM32), a spherical array with 32 electret microphones embedded in a rigid sphere with a diameter of 84 mm. In both cases, B-format signals were retrieved and used to obtain directional maps of the sound reflections according to the procedure described by Martellotta.14 The larger room dimensions and the relatively dry acoustics (due to heavy upholstered seats and a sound-absorbing ceiling) were expected to emphasize the influence of source directivity on both direct sound and early lateral reflection measurements.
B. Statistical analysis of the results In the first step of the research, level deviations from omnidirectional behavior were normalized with reference to maximum values measured in each octave band. However, in the remaining part of the work the parameter fluctuations induced by source rotation were explored with reference to the sensitivity of listeners to small changes in sound fields. In fact, variations for a given room acoustics parameter become significant only if they can be perceived as such by a listener. From this point of view an important factor to be considered is the JND, the smallest change in a parameter that can be perceived by a listener (actually by at least 50% of a statistically significant sample of listeners). Several studies have been carried out previously, defining the JNDs for many acoustical parameters under different acoustic conditions.15-18 In addition, reference values are given in Annex A of ISO 3382-1, which are those used in the present study. Once the JND values are known, the fluctuations of acoustic parameters due to source rotations become problematic only if the uncertainty in their measurements is higher than the subjectively perceivable change. In statistical terms, the measurement uncertainty is the parameter that characterizes “the dispersion of the values that could reasonably be attributed to the measurand”,19 and can be expressed as a function of the standard deviation (SD) and of the desired confidence interval (i.e., the desired probability that the measurand will fall within the interval defined by the uncertainty). A 99.7% confidence interval will result in an uncertainty equal to three times the SD, a 95% confidence interval will give a measurement uncertainty of twice the SD, and a 68% confidence interval will result in an uncertainty equal to one SD. From the subjective point of view this means that if we want the uncertainty to be within one JND with a 95% probability (meaning there is only a 5% chance that subjects will perceive an audible difference) the SD should not be larger than half the JND of the parameter under discussion. If the SD for the given parameter equals the corresponding JND, this will result in a 68% probability that a listener will not perceive any difference as the source rotates. It is clear that each measurement can be affected by several possible sources of error distributed along the measurement chain. However, in the present case, only those effects due to source rotation were investigated, while an effort was made to keep all other variables fixed.
Figure 1 – Results of directivity test according to ISO 3382. Maximum variation estimated from averages over 6 consecutive measurements of direct sound at 5° steps at 1.5 m distance from the source.
Figure 2 – Schematic plan and section of the Aula Magna of the Faculty of Engineering of The Politecnico di Bari.
Finally, the first source, having the wider frequency response and, as will be shown later, a slightly less uniform directional behavior, was moved to a much larger room, the Aula Magna of the Faculty of Engineering of the Politecnico di Bari. The room has a volume of 1200 m3, 270 seats, and an average mid-frequency reverberation time of 0.77 s. The source and microphones were located according to the graphical layout given in Fig. 2. Taking advantage of the source symmetry, the number of 5° rotations was reduced to 24, covering a 120° arc. Measurements were carried out using
3
Preprint version of the paper published on the Journal of Acoustical Society of America 134(3):2013, 2037-2048
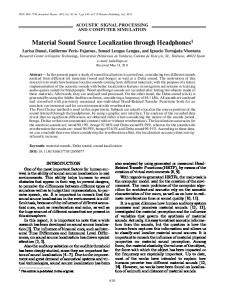
Figure 3 – Directional distribution of sound pressure levels measured over a 5 ms time window (direct sound) in a dry room at 1.5 m distance for source 1 along the horizontal plane (a) and at an elevation of 15° (b), and for source 2 along the horizontal plane (c)
III.
EXPERIMENTAL RESULTS
A.
Dry room measurements
were early decay time (EDT) and lateral fraction (LF), followed by clarity measures (C50 and C80). Source L2 showed better performance, with significant variations appearing only above 1 kHz and affecting primarily LF.
After the first set of measurements in the dry room, the directional characteristics of the selected dodecahedrons were clearly visible. In agreement with the dodecahedron geometry, a substantially hexagonal pattern appeared along the horizontal plane (see Fig. 3a), with level variations (for source L1) that were generally below 3 dB at 1 kHz and up to 9 dB at 4 kHz. A second identical microphone was set at the same distance but with an elevation of 15°, so the lobes of the three faces aimed upward from the equatorial plane could be better intercepted. As expected, this microphone showed (Fig. 3b) three lobes at 4kHz and above (with fluctuations up to 15 dB), a nearly hexagonal pattern at 1 kHz, and two side lobes appeared at ±30° from the main lobe at 2 kHz (see Fig. 3b). Apart from the results at 2 kHz, the observed behavior was coherent with the geometrical features of the dodecahedron. These observations suggest that at higher frequencies even a slight rotation of the sound source might significantly affect the direct sound (by up to 10 dB) and consequently the early reflections in a room. Depending on the angle of incidence from the source, a given reflection might be more or less emphasized by the directivity. Thus, as pointed out by other authors, large fluctuations are to be expected from measured acoustic parameters, depending on the source orientation. As shown in Fig. 3c, measurements carried out using source L2 showed a smoother behavior at 1 kHz and 2 kHz (where deviations were generally within 3 dB), and a more regular fluctuating pattern at 8 kHz (where variations were within 9 dB).
Figure 4 – Distribution of standard deviation (SD) to just noticeable difference (JND) ratio as a function of frequency for different acoustical parameters measured at 5 m distance from a) sound source L1, and b) sound source L2, rotating by 360° in 5° steps.
In Fig. 5 the plots of the parameter values as a function of the rotation angle for source L1 clearly show recursive fluctuations in agreement with the 120° symmetry. However, peaks and valleys appear at different angles depending on the frequency band and parameter under consideration. For the sake of clarity, the 8 kHz values were not plotted as they showed less regular variations. Energy-based parameters showed coherent variations (e.g., peaks in C50 and G appeared at the same angles where EDT showed valleys, and vice versa), whereas LF showed a clearly different trend. A similar recursive behavior was observed for source L2, but as suggested by Fig. 4b, the magnitude of the fluctuations was considerably reduced.
B. Reverberant room measurements For the second set of measurements carried out in the reverberant room, the microphone was placed 5 m from the source to better account for both the direct sound and early reflections. The analysis of the measured parameters (Fig. 4) showed that for source L1 operating below 1 kHz, no dependence on source rotation appeared, while above that limit the standard deviation tended to grow with frequency. In particular, the parameters most sensitive to source rotation
4
Preprint version of the paper published on the Journal of Acoustical Society of America 134(3):2013, 2037-2048
Figure 5 – Parameter variations as a function of angular rotation of sound source L1 measured at 5 m from the source with SoundField microphone in reverberant room with sound absorbing treatment. (- - -) 1 kHz, (– –) 2 kHz, (–––) 4 kHz.
maximizing the observed fluctuations. In fact, San Martin et al.5 found that SD/JND ratios were generally higher in rooms with shorter reverberation times. The parameter values were plotted as a function of the rotation angle for the microphone with the largest variations (EM32) at the farthest distance, to show what happens when direct sound becomes weaker. Remarkably, periodic fluctuations appeared again, suggesting that even at 10 m the radiation pattern of the source plays a significant role (see Fig. 6). Very similar results, although reversed as a function of rotation angle, were observed at the symmetrical positions where the SoundField microphone was used. Results were statistically correlated for all acoustic parameters except T30. For this particular parameter, the observed variations were random and not dependent upon the source rotation. Taking Fig. 6 into account and taking advantage of the possibility of mapping the directions of arrival of different reflections offered by both microphones,14 a visual comparison of two extreme conditions was proposed. Again, only results from EM32 were given, as this microphone proved to be more reliable in the high-frequency range. Figure 6 shows that at a 70° rotation nearly all parameters had a peak, while at 40° most parameters were on the low side (except for EDT which, logically, had a reversed behavior). Using the 4 kHz band, as it was the most sensitive to source rotation while being less affected by scattered sound, Fig. 7 shows that at 40° the direct sound was relatively weak (see values of p2) but played a major role compared to those of the early reflections from the floor (F), the ceiling (C) and the side wall (S). Conversely, at
C. On site measurements Given the limitations caused by the small dimensions of the reverberant room, which produced a closely spaced sequence of early reflections and a significant contribution of scattered sound, a new set of measurements was carried out in the much larger Aula Magna. The measurements involved two different microphones located in symmetrical positions. Analysis of SD/JND ratios (Table I and II) showed that in all the cases no significant problem appeared below 1 kHz where results were unaffected by the rotation of the source. Conversely, in the high frequency range, the variations were significant and, for nearly all the parameters, were well above the 0.5 limit. At a 5 m distance the variations were larger than at 10 m, likely as a consequence of the stronger influence of the direct sound on most of the parameters. In particular, the largest fluctuations appeared for EDT and C50, which were more sensitive to direct sound. At 10 m, the EDT, LF and C50 were the most sensitive to source rotation. SoundField MKV and mh Acoustics EM32 showed similar SD values, with only the exception of LF values at high frequencies. In this frequency range, the first microphone tended to systematically overestimate absolute values and fluctuations, possibly as a consequence of its tendency to artificially increase the degree of scattering of the reflections.14 The unexpectedly high EDT fluctuations, not reported in other studies (at least with such a magnitude), were likely due to the short reverberation time that, on one hand, emphasized the role of early reflections and, on the other, reduced the JND
5
Preprint version of the paper published on the Journal of Acoustical Society of America 134(3):2013, 2037-2048 70° the direct sound was much stronger than before, as were the reflections arriving from the left and from the back wall (B), while the ceiling reflection almost disappeared. This comparison was particularly useful to show that both direct sound and early reflections were affected by the source
rotation and, depending on the relative position of the source and receivers, could result in an overemphasis of one acoustic parameter or another.
Table I – Distribution of standard deviation (SD) to just noticeable difference (JND) ratio as a function of frequency for different acoustical parameters measured at 5 m distance from a sound source rotating by 360° in 5° steps.
SD/JND EDT G C50 C80 LF
EM32 < 1kHz 0.14 0.03 0.10 0.08 0.07
1k 0.86 0.51 0.51 0.45 0.81
2k 2.08 0.87 1.58 1.36 1.17
4k 2.08 1.40 1.93 1.60 1.00
8k 0.86 1.00 1.52 1.17 1.50
avg. 1.47 0.94 1.38 1.15 1.12
SF MkV