ARTICLE IN PRESS Available online at www.sciencedirect.com
Magnetic Resonance Imaging xx (2009) xxx – xxx
Optimizing the imaging of the monkey auditory cortex: sparse vs. continuous fMRI Christopher I. Petkov a,b,⁎, Christoph Kayser a , Mark Augath a , Nikos K. Logothetis a,c b
a Max Planck Institute for Biological Cybernetics, Spemannstrasse 38, 72076, Tübingen, Germany Institute of Neuroscience, University of Newcastle upon Tyne, Henry Wellcome Building, Framlington Place, Newcastle upon Tyne, NE2 4HH, UK c Imaging Science and Biomedical Engineering (ISBE), University of Manchester, Stopford Building, Oxford Road, Manchester, N13 9PT, UK Received 17 October 2008; revised 15 December 2008; accepted 9 January 2009
Abstract The noninvasive imaging of the monkey auditory system with functional magnetic resonance imaging (fMRI) can bridge the gap between electrophysiological studies in monkeys and imaging studies in humans. Some of the recent imaging of monkey auditory cortical and subcortical structures relies on a technique of “sparse imaging,” which was developed in human studies to sidestep the negative influence of scanner noise by adding periods of silence in between volume acquisition. Among the various aspects that have gone into the ongoing optimization of fMRI of the monkey auditory cortex, replacing the more common continuous-imaging paradigm with sparse imaging seemed to us to make the most obvious difference in the amount of activity that we could reliably obtain from awake or anesthetized animals. Here, we directly compare the sparse- and continuous-imaging paradigms in anesthetized animals. We document a strikingly greater auditory response with sparse imaging, both quantitatively and qualitatively, which includes a more expansive and robust tonotopic organization. There were instances where continuous imaging could better reveal organizational properties that sparse imaging missed, such as aspects of the hierarchical organization of auditory cortex. We consider the choice of imaging paradigm as a key component in optimizing the fMRI of the monkey auditory cortex. © 2009 Elsevier Inc. All rights reserved. Keywords: Monkey; Macaque; Auditory; Cortex; Tonotopy; Hierarchical processing; Human; Communication; Hearing; Sparse; Continuous; Imaging; Sequence; Paradigm
1. Introduction Developing the imaging of the monkey auditory system is important for a direct comparison with the copious data that have been and are continuing to accumulate from the imaging of the human auditory system. Not only will direct comparisons of human and monkey auditory imaging data allow us to evaluate evolutionary relationships in brain processes that support vocal communication and hearing, but also the monkey imaging can guide invasive work that is needed to understand neuronal processes and the relationship of neuronal activity to the hemodynamic imaging signal. Given that functional magnetic resonance imaging (fMRI) is now a standard technique for imaging human brain function, monkey fMRI would provide the most direct ⁎ Corresponding author. Tel.: +44 191 222 3467. E-mail address:
[email protected] (C.I. Petkov). 0730-725X/$ – see front matter © 2009 Elsevier Inc. All rights reserved. doi:10.1016/j.mri.2009.01.018
comparison. Although fMRI of the monkey visual system has the advantage of being better established [1–4], fMRI of the monkey auditory system (including cortical and subcortical structures) is beginning to gain ground [5–10]. Auditory fMRI is challenging on its own in part because the noise generated by the magnetic resonance (MR) scanner will (1) activate the auditory system, (2) reduce its responsiveness to other sounds and (3) mask the experimental sound stimuli. For imaging the brains of small animals, high-resolution imaging is needed at high magnetic fields (N1.5 T), which offers improved differentiation of the hemodynamic response in terms of spatial distribution and stimulus sensitivity (for a review, see references [11] and [12]). High-resolution MRI sequences, such as echo-planar imaging, rely on strong magnetic gradients with short gradient rise times, especially when images are acquired quickly. However, the rapid switching of strong gradients generates considerable
ARTICLE IN PRESS 2
C.I. Petkov et al. / Magnetic Resonance Imaging xx (2009) xxx–xxx
acoustical noise and requires special attention for reducing the exposure of subjects to potentially harmful levels of scanner noise (N100-dB sound pressure level [SPL]). This is true regardless of the purpose of the fMRI, nonauditory studies included. Among the approaches to deal with scanner noise, which include developments in hardware improvement and active noise cancellation [13], the easiest to implement with any system involves acoustically shielding the scanner bore, giving subjects ear plugs and placing foam around the subject's head and ears. Yet, the passive attenuation of the scanner noise depends on the material used, the care with which this is applied and the space around the head. Furthermore, in our experience, passive attenuation alone does not guarantee robust monkey auditory imaging. In our recent auditory and multisensory work, along with the use of passive attenuation strategies, we optimized our imaging sequences and their parameters to obtain a robust blood oxygen level-dependent (BOLD) fMRI response in monkeys [5–8]. However, with all of the optimization strategies, many of which have been detailed previously, the one that seemed to us to make the most obvious impact on the quality of the auditory cortex activity — in both awake and anesthetized animals — was the use of a “sparseimaging” paradigm. Sparse imaging adds periods of silence in between volume acquisition and sidesteps the effects of the scanner noise on the auditory hemodynamic response (Fig. 1). This approach was developed for and is commonly used in the auditory imaging of humans [14–17]. This study directly compares the sparse-imaging approach to the commonly used “continuous-imaging” paradigm in the imaging of the monkey auditory cortex. Continuous imaging is the typical imaging paradigm for most fMRI studies, including still many auditory fMRI studies [18–22]. With continuous imaging, there is no interruption in scanner image acquisition, and thus, the
scanner noise is on continuously. Direct comparison of the sparse and continuous-imaging paradigms in anesthetized animals showed that the sparse-imaging paradigm produced more robust auditory activity and better revealed the functional organization of the monkey auditory cortex. There were some instances in which the continuous imaging revealed functional properties that the sparse imaging overlooked. We discuss under which conditions either paradigm or others not tested here might be more appropriate. We conclude with a cautionary note against overexposing subjects to high sound stimulation levels with continuous imaging to obtain modest activity, which another scanning paradigm could obtain at lower and more reasonable sound stimulus levels. 2. Methods We report data from eight functional MRI sessions with three male macaque monkeys (Macaca mulatta) weighing 6 to 12 kg. The animals were scanned while being anesthetized [5–8]. All studies were in full compliance with the guidelines of the European Community for the care and use of laboratory animals (EUVD/86/609/EEC) and were approved by the local authorities (Regierungspraesidium Tuebingen). 2.1. Magnetic resonance imaging hardware Measurements of the fMRI BOLD signal were made with a vertical 4.7-T scanner (Bruker Medical, Ettlingen, Germany). The animals sat in a primate chair in the magnet. During the experiment, the animal's head was positioned with a plastic head holder (Tecapeek; Ensinger, Germany). The 4.7-T scanner is equipped with a 40-cm-diameter bore (Biospec 47/40v, Bruker Medical) and a 50-mT/m actively shielded gradient coil (B-GA 26, Bruker) of 26-cm inner
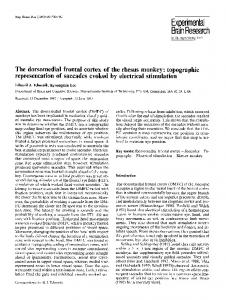
Fig. 1. Design of the sparse and continuous-imaging paradigms. To facilitate comparison, both paradigms obtained equivalent numbers of volumes and used a block design with alternating stimulation (sound) and baseline (no sound) periods. The sparse-imaging paradigm for use with anesthetized monkeys is depicted in panel A and was developed based on the ones that are in use for fMRI study of the human auditory cortex (see the manuscript text for details). The sparse-imaging paradigm that we used for awake and behaving animals is described elsewhere (see references [5,6], and [8]). The blowout shows that the spare-imaging paradigm initiates with an imaged brain volume (in orange). Then the imaging stops and allows sounds to be presented in relative silence during the subsequent period before the next volume acquisition. Because of the delay in the hemodynamic (BOLD) response, the next volume acquired 10 s later reflects the sound stimulation that occurred approximately 4 to 6 s before while sidestepping the auditory response to the scanner noise that occurred 10 s before. The timing of the stimulus presentation in relation to the time of the volume acquisition can be optimized for obtaining the maximal activity response [15]. (B) For continuous imaging, we acquired the same number of volumes as the sparse-imaging paradigm but with no pause in between volume acquisition. In this case, the scanner noise will continuously elicit activity from and reduce the responsiveness of auditory cortex while also masking the sound stimuli during their presentation.
ARTICLE IN PRESS C.I. Petkov et al. / Magnetic Resonance Imaging xx (2009) xxx–xxx
diameter. For the scanning sequences used here, this scanner's noise peaked at 105-dB SPL (see the power spectrum of the scanner noise in Fig. 3 and, for further details, the Sound Stimuli and Presentation section). 2.2. MR imaging Signals were acquired using a 70- or 80-mm-diameter surface radiofrequency coil positioned over the auditory cortex of one hemisphere. To obtain a plane of activity corresponding to auditory cortex, we oriented slices parallel to the lateral sulcus (Fig. 2) by relying on sagittal anatomical images obtained with a FLASH sequence. For this sagittal anatomical scan, the imaging sequence had the following typical parameters: echo time (TE), 6 ms; volume repetition time (TR), 500 ms; field of view (FOV), 9.6×9.6 cm2, on a grid of 128×128 voxels, 2-mm-slice thickness, 15 slices. The sagittal anatomical scan was also used to align a volume, centered on auditory cortex, for optimizing the linear and higher-order shim coils using an autoshim algorithm [23]. Functional data were acquired using a multisegment (“multishot”) gradient-recalled echo-planar imaging
3
sequence (GE-EPI) with typical parameters (TE, 16 ms; flip angle, 45°; 9–12 slices, 2-mm thick, centered and aligned with auditory cortex) (Fig. 2). The FOV was adjusted for each animal's head size and was between 6.4×6.4 and 12.8×12.8 cm2. This resulted in voxel sizes of 1 to 2 mm3. Thereby, to allow a better comparison between experiments, we expressed activations in volume units of milliliter and not as absolute numbers of voxels (Fig. 2). For the sparse imaging, we typically used a two-segment or “shot” GE-EPI procedure to sample k-space, where the volume acquisition time (TA) was 2 s and the TR was 10 s. For continuous imaging, the sequence was identical, except that we extended the TR to be a better match to the slower pace of the sparse-imaging sequence and to allow more comparable periods of acoustical stimulation. For the continuous-imaging paradigm, we used an 8-shot version of the GE-EPI where both TA and TR were 6 s. This change improved the signal-to-noise ratio (SNR) of the continuousimaging data (mean, 35 SNR) relative to the sparse-imaging data (mean, 22 SNR). Signal-to-noise ratio was computed as follows: SNR=[mean(S)−mean(N)]/std(N), where S is the intensity of voxels within a region of interest (ROI) in
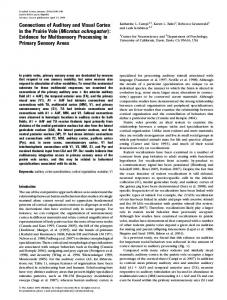
Fig. 2. Activating the monkey auditory cortex: sparse and continuous-imaging paradigms directly compared. Sparse imaging (A, C) resulted in a considerably greater BOLD activity response than continuous imaging (B, D). Panels A and B are experiments with one monkey; panels C and D are from a different individual. In these experiments, we used broadband noise presented at 95-dB SPL. (E) Summary of the significantly active (Bonferroni corrected, Pb.05) volume in three experiments with three different monkeys. Each imaging figure panel labels the monkey subject and the experimental session: the first three characters identify the monkey (E04, M00, J02) and the subsequent part the experimental session identifier. This format is used in this and all of the subsequent figures. The inset above panel B illustrates the slice orientation and the alignment of our imaging slices with auditory cortex on the superior temporal plane, below the lateral sulcus. Abbreviations: LS, lateral sulcus; STS, superior temporal sulcus.
ARTICLE IN PRESS 4
C.I. Petkov et al. / Magnetic Resonance Imaging xx (2009) xxx–xxx
auditory cortex and N is the intensity of the voxels within the same ROI as positioned outside of the brain. However, even with this advantage for the continuous-imaging data, the auditory response with sparse imaging was better than that with continuous imaging as the results show (Fig. 2). To facilitate direct comparisons between the two paradigms, it was important to obtain equivalent numbers of the functional imaging volumes. Where the continuous- and sparse-imaging paradigms were directly compared, the total volumes obtained was equivalent for both of the paradigms at 180, 144 and 120 total volumes, respectively, for each of the three experiments, E04um1, M00ug1 and J02vA1 (Fig. 2E); this was in the context of 15, 12 and 15 baseline and stimulus block periods with 12, 12 and 8 volumes per such period, respectively, for each of the three experiments. Anatomical images (T1-weighted) used the same planar FOV as the functional scans, allowing anatomical slices to be in register with the functional slices that were acquired during the same imaging run. Anatomical volumes were typically acquired with a four-segment 3D-MDEFT sequence (three-dimensional modified driven equilibrium with Fourier transform pulse sequence: TE, 4 ms; TR, 22 ms; 256×256×128 voxels). Displayed images are in radiological coordinates where left is right and right is left. 2.3. Anesthetized animal preparation An extensive description of the anesthesia procedures can be found elsewhere [1,7,24]. The handling and anesthesia protocols ensure stress-free treatment of the animal while preserving neural responses to sensory stimulation. After premedication with glycopyrrolate (0.01 mg/kg im) and ketamine (15 mg/kg im), a catheter was inserted into the saphenous vein. Animals were preoxygenated and prepared for intubation with a cocktail of shortacting drugs (fentanyl at 3 μg/kg, thiopental at 5 mg/kg and muscle relaxant succinylcholine chloride at 3 mg/kg). The trachea was then intubated and the lungs ventilated at 25 strokes per minutes. Anesthesia was maintained with remifentanil (0.5–2 μg/kg per minute) and muscle relaxation with mivacurium chloride (5 mg/kg per hour). Lactated Ringer's solution was given intravenously at a maximum rate of 10 ml/kg per hour. Physiological parameters (heart rate, blood pressure, blood oxygenation and expiratory CO2) were monitored and kept in desired ranges with volume supplements. Body temperature was regulated using circulated water heaters. Functional data acquisition started approximately 2 h after the start of the animal preparation following a high-resolution anatomical scan. 2.4. Sound stimuli and presentation Sound stimuli were groups of single-frequency tones or noise bursts. Noise bursts ranged in spectral composition from 1-octave bandpass noise to broadband noise (0.250–19 kHz). The tone and bandpassed noise groups allowed us to vary the center frequency of sounds within a group. The
sound types used and their exact frequency composition are identified in the reported experiments. When tones and bandpassed noise responses were compared, we made sure that tones were presented to cover the frequency range of the bandpassed noise stimuli that were used (see reference [5] for details). All sounds were 50 ms in duration. They were sampled at 44.1 kHz and presented at 8 Hz (75-ms interstimulus interval). The amplitude of all sounds was cosine shaped on and off for 8 ms. The stimuli were root mean square (RMS) matched and presented at the same intensity level, in decibel SPL. Sound intensity levels are also reported in the Results and were 95-dB SPL for the continuous imaging to overcome the effects of the scanner noise and for the sparse-imaging experiments where the two imaging paradigms were directly compared. The sparse imaging did not require the sound intensity to be very high for robust activation of auditory cortex. Thus, when not directly comparing with continuous imaging, we used a range between 70- and 85-dB SPL, which allowed us to optimize the selectivity of auditory cortex responses for evaluating tonotopy (Fig. 3A) and hierarchical processing (Fig. 4A). This was done by first acquiring short scanning runs with broadband noise to probe the amount of auditory cortex activity. Here, we varied the broadband noise sound intensity levels in 2.5- to 5-dB steps in between 70 and 85 dB. This allowed us to select the minimum sound level within this range that resulted in broad auditory cortex activity (e.g., extending ∼3 cm, anterior to posterior). With subsequent stimulation at this preselected intensity value, we were able to balance between obtaining broad activation of auditory cortex and preserving neuronal selectivity for sound features. The alternative is that most neurons are active at the very high sound intensity levels and functional selectivity cannot be measured [9,17,25]. Sounds were presented using custom-written software and controlled using a QNX real-time operating system (QNX Software Systems, Canada). Sound stimuli were stored as WAV files, played from a PC, amplified (Yamaha, AX-496) and delivered binaurally using MR-compatible headphones (MR Confon, Germany). The headphones are composed of an electrodynamic membrane [26] within customized and foam-insulated headphone cups, designed for use with macaque monkeys. The headphones were secured over the monkeys' ears and covered with foam (Tempur-Pedic, http://www.tempurpedic.com) to further attenuate outside sounds. Calibrations and sound intensity measurements were made with an MR-compatible condenser microphone (Brüel and Kjær 4188) and a sound level meter (Brüel and Kjær 2238 Mediator, unfiltered calibration). Each headphone was individually calibrated to ensure a linear transfer function (from 0.088 to 19 kHz). The scanner noise was measured at a maximum of 105-dB SPL, which is estimated to peak at around 80- to 85-dB SPL at the ear, following approximately 20 to 25 dB of attenuation by the headphone cups and surrounding foam.
ARTICLE IN PRESS C.I. Petkov et al. / Magnetic Resonance Imaging xx (2009) xxx–xxx
Fig. 3. Tonotopy results with sparse and continuous imaging. Both imaging paradigms reveal the spatial topography of frequency preference, seen here from posterior to anterior as spatially alternating “low” and “high” sound frequency-preferring patterns (see Methods for how these were computed). Most sparse-imaging experiments showed an extensive pattern that we now regularly rely on to reveal up to 11 functional fields in auditory cortex, see panel A for an example and also reference [5]. With continuous imaging, panels B and C show the best tonotopic mapping results that we were able to obtain. Even with these, continuous imaging often resulted in more limited tonotopic patterns both anterior to posterior and medial to lateral. For the experiments in panels A and B, the frequency range for the “low band” stimuli was 0.5 to 2 kHz, and for the “high band” stimuli, 4 to 16 kHz. For reference, we show the power spectrum of our scanner noise (GE-EPI) in the upper right corner. The highest three peaks in the noise spectrum are at 0.8, 2.4 and 3.9 kHz.
5
permutation test taking into account both voxel response and spatial cluster extent [27–29]. Here, we used the metric “cluster mass” [27–29], which was calculated for each voxel as the sum of its and immediate neighbors' activation t values. A permutation test (bootstrap procedure) then determined the significance level (P value) based on a randomized time series subjected to the same clustering procedure. The advantage of the permutation test is that it naturally combines information about neighboring voxels, thus, incorporating cluster size into the significance test and reducing the need for post hoc clustering or P value correction. Activations were considered significant below P=.05. This analysis and the local signal obtained from the surface coil resulted in significant activations that were highly localized over the gray matter of the superior temporal plane. Therefore, activity was over a limited number of slices (1–3, 2-mm slices), and results could be averaged over these slices or, in cases of optimal slice positioning, presented from a single slice. For the voxels identified as being significantly active, frequency preference was determined by taking the difference of the stimulus correlation between two frequency conditions (Fig. 3A,B). Here, we thresholded the lowest correlation values (Pearson rb0.05), which makes these maps discontinuous between frequency regions but eliminates the voxels with weak frequency preferences. Multifrequency maps (Fig. 3C) show for individual voxels the frequency eliciting maximal response. Similar results were obtained from the maximal response of gaussian fits to voxels' multifrequency responses. For the tone vs. noise comparisons, we evaluated the difference of the stimulus correlation between the tone and
2.5. Data analysis The data were analyzed off-line using custom-written programs in Matlab (Mathworks, Natick, MA, USA). Multislice data (volumes) were converted to time points and linear drifts removed. Responses to sounds were quantified from repeated runs of stimulation blocks with flanking no-stimulation “baseline” blocks. Functional maps or auditory stimulus-related responses were computed using cross-correlation with a boxcar-shaped zero-phase shift waveform, convolved with a gamma function [1]. Significantly, active voxels to the sound stimuli were displayed if their stimulus-associated P values were b.05 following Bonferroni correction (Fig. 2). To determine active voxels for more detailed analysis of tonotopy or hierarchical processing (Figs. 3, 4), we used a
Fig. 4. Imaging hierarchical organization in auditory cortex. We plot two example experiments with each imaging paradigm where the activity preference for either bandpassed noise (red to orange) or tones (blue to cyan) is compared. Both sparse and continuous imaging revealed a distributed preference for bandpassed noise (red to yellow color map) in the “auditory belt” (the non-PAC), which surrounds the PAC. This can be used to approximate the border between the belt and the PAC (see outline in panel A and reference [5]). This is consistent with the auditory belt preferring more complex sounds like bandpassed noise over single-frequency tones [31–33]. However, the sparse-imaging paradigm (A) overlooked the preference in PAC for tonal vs. bandpassed noise stimulation (seen in blue), which was more obvious with continuous imaging (B).
ARTICLE IN PRESS 6
C.I. Petkov et al. / Magnetic Resonance Imaging xx (2009) xxx–xxx
bandpassed noise conditions once significant voxels were identified, as for the frequency selectivity analyses. Comparable results were obtained if we directly evaluated the statistical significance of the tone vs. noise activity response difference (t test, not corrected for multiple comparisons), as shown in Fig. 4. 3. Results Acoustical stimulation during sparse imaging elicited stronger responses from auditory cortex than the standard continuous-imaging paradigm. The two paradigms were directly compared in three experiments with three different anesthetized monkeys. For these comparisons, we used broadband noise for stimulation at high sound intensity levels (see Methods). The design of the imaging paradigms is schematized in Fig. 1. Both paradigms contained the same number of imaging volumes and used a block design consisting of baseline (no sound stimulation) blocks that alternated with sound stimulation blocks (Fig. 1). The main difference between the paradigms was that the sparse-imaging paradigm took longer to complete because of the added silent periods in between image acquisition. However, so that there would be a more comparable amount of acoustical stimulation between the paradigms, at the design stage of these experiments, we extended the continuous-imaging volume time while maintaining the same number of volumes that were acquired from each paradigm to facilitate direct comparisons (see Methods and Fig. 1). Even at high sound stimulus intensities of 95-dB SPL, continuous imaging elicited little activity (Fig. 2B,D). By contrast, sparse imaging activated a large portion of the superior temporal plane (Fig. 2A,C). The results for the three experiments are summarized in Fig. 2E, and each time, the sparse-imaging paradigm elicited a greater auditory BOLD response. The significantly active volume obtained from the imaging paradigms was greater for the sparse-imaging paradigm (t test, Pb.05) (Fig. 2E). These results show that even at very loud sound stimulus intensities, the activity with continuous imaging is modest in comparison with what can be obtained with sparse imaging (Fig. 2). The results in combination with our previous work also reveal that it is not necessary to use high sound stimulus levels with the sparseimaging paradigm. This is because broad auditory cortex activity can be achieved with sparse imaging at levels well below 85-dB SPL [5] while also preserving the neuronal selectivity that is needed for revealing the functional organization of auditory cortex [5,25]. Next, we evaluated how well continuous imaging reveals the functional organization of auditory cortex for properties that we have already described in detail with the use of sparse imaging [5]. As in our previous study, we evaluated the properties of auditory cortex that reveal its topography of frequency selectivity (termed tonotopy or cochleotopy). We also looked for evidence of hierarchical auditory processing,
which can be observed as a preference for broad-spectrum sounds in the nonprimary auditory cortex (PAC). While the more typical results obtained with sparse imaging were often superior to the best that we could obtain with continuous imaging, there were instances where the continuous imaging was informative. Regarding tonotopy, we previously showed how multiple auditory cortical fields can be revealed with sparse imaging [5]. The needed first step in parcellating auditory cortical fields is to reveal the topography of sound frequency preference, which is seen — from posterior to anterior along the superior temporal plane — as an expansive pattern of spatially alternating low- and high-frequency-preferring regions [5,30,31]. However, since this analysis depends upon sound frequency preference being evaluated only for voxels with a significantly active response to the sounds, continuous imaging will often result in a very limited frequency preference map because of its low number of significantly active voxels (as seen in Fig. 2B and D). A limited activation extent precludes the mapping of the many auditory cortical fields [5], and a number of our mapping attempts with continuous imaging failed because of a lack of strong auditory activity. Fig. 3A shows a typical sparseimaging experiment with tonotopic mapping (see reference [5] for further examples). In Fig. 3B and C, we show the best examples of tonotopy that we were able to obtain with continuous imaging. Even these maps, by comparison with those from the typical sparse imaging results, contain a much more limited pattern, both anterior to posterior and medial to lateral on the superior temporal plane (compare Fig. 3A with B and C). These observations were independent of the type of stimulation used (whether with tones or bandpassed noise), including the range and center frequency of the stimulation (Figs. 3B and C). As a reference, we show the spectrum of the scanner noise in Fig. 3 and the prominent peaks in the scanner noise. Regarding evidence for hierarchical processing, the PAC (also called auditory “core”) responds to the features of many sounds, with especially strong responses to singlefrequency tones [32]. The surrounding nonprimary (belt) cortex, on the other hand, prefers sounds with more complex features such as those with a broader frequency spectrum [31–33]. We have already seen that the sparse-imaging paradigm can reveal evidence of the hierarchical organization in the monkey auditory cortex when the responsiveness to tones is compared with that to sounds like bandpassed noise [5]. With sparse imaging, although we often observed a clear preference for bandpassed noise over tonal stimuli in the nonprimary (belt) auditory cortex, the preference was patchy (see the red to yellow color map in Fig. 4A). Also, the PAC did not show evidence for stronger tone vs. noise responses, which we expected based on prior electrophysiological studies with monkeys [32]. This could be because of a saturated response in the PAC to both stimulus types when using the sparse-imaging paradigm.
ARTICLE IN PRESS C.I. Petkov et al. / Magnetic Resonance Imaging xx (2009) xxx–xxx
Interestingly, continuous imaging, while also resulting in a patchy preference for bandpassed noise in the auditory belt, better revealed a preference for tone stimulation in the centrally located PAC (seen in blue in Fig. 4B). A reasonable question is whether, during continuous imaging, it is possible that the scanner noise may have masked the bandpassed noise stimuli more readily than the tonal stimuli, showing what appears like a preference for tones. This seems unlikely because of the spatial specificity of the differential stimulus preferences that occur respectively over the central PAC for tones and the surrounding auditory belt for bandpassed noise (Fig. 4B). Thus, a simpler interpretation is that continuous imaging can, in certain instances, reveal organizational properties of the monkey auditory cortex that sparse imaging would miss. This could be useful in this case for delineating the primary from non-PAC.
7
because of this (see Methods). It uses nonexperimental stimuli (such as broadband noise) to find the minimal sound intensity level to balance between having sound intensities low enough to get closer to neuronal thresholds, i.e., the most selective neuronal responses [25], and the higher sound levels that are needed to activate broad portions of auditory cortex. Continuous imaging, while showing the preference for bandpassed noise in the non-PAC, better revealed a preference for tonal stimulation than the sparse-imaging paradigm (Fig. 4). For localizing the many auditory cortical fields within the core and belt regions of the monkey auditory cortex, the resulting map of the core and belt regions with continuous imaging (Fig. 4B) would be useful in combination with the more expansive tonotopic maps obtained with sparse imaging [5]. 4.1. Considering the intensity of sound stimuli
4. Discussion We directly compared in anesthetized macaques the auditory cortex fMRI activity resulting from the use of two different imaging paradigms. One is a commonly used continuous-imaging paradigm where images are acquired without interruption during stimulation [18–22]. Here, continuous noise from the scanner competes with the acoustical stimulation for the auditory cortex response and requires stimuli to be presented at high enough sound intensities to overcome the scanner noise. The other, a sparseimaging paradigm, minimizes the influence of the scanner noise on the auditory cortex response and allows less intense sounds to be presented during silent periods in between image acquisition [14–17]. Sparse imaging elicited substantially more activity over auditory cortex than continuous imaging and resulted in more extensive tonotopic maps. Since the scanner noise during continuous imaging makes auditory cortex less responsive to a broad range of frequencies [34,35], sparse imaging may be better suited than continuous imaging for more balanced and extensive mapping of auditory cortex. Continuous-imaging experiments even at high sound levels precluded extensive activation or mapping of auditory cortex. However, in some cases, these data could be supportive and informative. For instance, as expected based on electrophysiological studies in monkeys and imaging work in humans [31–33], we observe with monkey fMRI and either of the two imaging paradigms a preference in the nonPAC (the auditory “belt”) for bandpassed noise over tonal stimulation (Fig. 4 and 5). However, at least with the sparseimaging paradigm, we observed little preference for the converse — tones over bandpassed noise — within the PAC (or auditory “core,” see the area within the outline in Fig. 4A). Possibly with sparse imaging, there was a saturated response in the PAC to both of these types of stimuli, which might be helped by a sound level optimization procedure that is designed specifically for tone vs. noise comparisons. Our current procedure is more general and perhaps less biased
We often use sparse imaging with sound stimulus intensities in the range between 70- and 85-dB SPL to balance between obtaining broad activity and preserving neuronal selectivity [5]. Exceeding 85 dB with sparse imaging seems unnecessary because neuronal selectivity is lost at higher sound levels and reliable maps of functional organization are difficult to obtain. Other authors have also noted this for monkey auditory cortex imaging [9]. With continuous imaging, however, as shown here, we had to use very high sound intensities (95-dB SPL) to elicit even modest activity in order to compare with that elicited by sparse imaging (Fig. 2). This was the case even with considerable efforts in passive attenuation of the scanner noise around the head of the monkey (see Methods). Certainly, it seems that some of the functional properties of auditory cortex were better seen with continuous imaging (see the previous section). However, we do not recommend using high sound stimulus intensities with continuous imaging if a different paradigm can be used, which allows the use of lower stimulus intensities while resulting in equivalent or substantially more auditory activity. When continuous imaging is necessary, lower sound stimulus intensities can be used in combination with additional data acquisition to bring out weak stimulusrelated signal responses. This additional experimental time would eliminate the advantage of the continuous imaging, requiring less time to complete in relation to sparse-imaging paradigms, but it would avoid overexposing subjects to high stimulus intensities and thus risk damaging their hearing. 4.2. Concluding remarks Continuous imaging is problematic for auditory imaging but, unfortunately, cannot be easily dismissed because it still offers a number of advantages over sparse-imaging paradigms. These advantages include improved temporal resolution of the hemodynamic response and quicker acquisition of consecutive volumes [7,22,34,36]. Strategies are being developed to improve the sparse-imaging paradigm
ARTICLE IN PRESS 8
C.I. Petkov et al. / Magnetic Resonance Imaging xx (2009) xxx–xxx
to compensate for some of its limitations [37], such as improving its temporal sampling resolution by jittering the position of the stimuli in relation to the image acquisition [15]. From the other side, quieter continuous-imaging sequences are available [13,38] — although volume TAs are longer with these — or the continuous-imaging sequences can be modified so that the scanner generates less distracting and easier to ignore noise [39]. In the future, developments in MR hardware and the acoustics of the scanning environment and of active noise cancellation technology are expected to drastically reduce the effects of the acoustical noise during MRI [13]. In the meantime, for robust activity of the monkey auditory cortex, we recommend the use of the sparse-imaging paradigm. In combination with the standard optimization strategies that are needed for obtaining high signal-to-noise and artefactfree images, the sparse-imaging paradigm could be an important component of a complete optimization strategy to elicit robust, selective and reliable fMRI activity from the monkey auditory system. Acknowledgments We thank Simon Baumann, Yukiko Kikuchi, Michael Ortiz, Kazu Tanji and a prior anonymous reviewer for encouragement and useful discussions that provided the basis for this project. This work was supported by the Max Planck Society, the Deutsche Forchungsgemeinschaft, DFG, (C.K.) and the Alexander von Humboldt Foundation (C.I.P). References [1] Logothetis NK, Guggenberger H, Peled S, Pauls J. Functional imaging of the monkey brain. Nat Neurosci 1999;2(6):555–62. [2] Logothetis NK, Pauls J, Augath M, Trinath T, Oeltermann A. Neurophysiological investigation of the basis of the fMRI signal. Nature 2001;412(6843):150–7. [3] Orban GA, Claeys K, Nelissen K, Smans R, Sunaert S, Todd JT, et al. Mapping the parietal cortex of human and non-human primates. Neuropsychologia 2006;44(13):2647–67. [4] Orban GA, Van Essen D, Vanduffel W. Comparative mapping of higher visual areas in monkeys and humans. Trends Cogn Sci 2004;8 (7):315–24. [5] Petkov CI, Kayser C, Augath M, Logothetis NK. Functional imaging reveals numerous fields in the monkey auditory cortex. PLoS Biol 2006;4(7):e215. [6] Petkov CI, Kayser C, Steudel T, Whittingstall K, Augath M, Logothetis NK. A voice region in the monkey brain. Nat Neurosci 2008;11(3): 367–74. [7] Kayser C, Petkov CI, Augath M, Logothetis NK. Integration of touch and sound in auditory cortex. Neuron 2005;48(2):373–84. [8] Kayser C, Petkov CI, Augath M, Logothetis NK. Functional imaging reveals visual modulation of specific fields in auditory cortex. J Neurosci 2007;27(8):1824–35. [9] Tanji K, Leopold D, Ye F, Zhu C, Malloy M, Saunders R, et al. Sound level dependent activation in the macaque auditory cortex: an fMRI study. Soc Neurosci Abstr 2007. [10] Baumann S, Hunter D, Sun L, Rees A, Thiele A, Griffiths TD. Characterisation of the amplitude modulation transfer function in the macaque auditory pathway using fMRI. Soc Neurosci Abstr 2007.
[11] Logothetis NK. The neural basis of the blood-oxygen-level-dependent functional magnetic resonance imaging signal. Philos Trans R Soc Lond B Biol Sci 2002;357(1424):1003–37. [12] Logothetis NK. What we can do and what we cannot do with fMRI. Nature 2008;453(7197):869–78. [13] Amaro Jr E, Williams SC, Shergill SS, Fu CH, MacSweeney M, Picchioni MM, et al. Acoustic noise and functional magnetic resonance imaging: current strategies and future prospects. J Magn Reson Imaging 2002;16(5):497–510. [14] Hall DA, Haggard MP, Akeroyd MA, Palmer AR, Summerfield AQ, Elliott MR, et al. “Sparse” temporal sampling in auditory fMRI. Hum Brain Mapp 1999;7(3):213–23. [15] Belin P, Zatorre RJ, Hoge R, Evans AC, Pike B. Event-related fMRI of the auditory cortex. Neuroimage 1999;10:417–29. [16] Binder JR, Liebenthal E, Possing ET, Medler DA, Ward BD. Neural correlates of sensory and decision processes in auditory object identification. Nat Neurosci 2004;7(3):295–301. [17] Formisano E, Kim DS, Di Salle F, van de Moortele PF, Ugurbil K, Goebel R. Mirror-symmetric tonotopic maps in human primary auditory cortex. Neuron 2003;40(4):859–69. [18] Wessinger CM, Buonocore MH, Kussmaul CL, Mangun GR. Tonotopy in human auditory cortex examined with functional magnetic resonance imaging. Neuroimage 1997;5:18–25. [19] Bilecen D, Scheffler K, Schmid N, Tschopp K, Seelig J. Tonotopic organization of the human auditory cortex as detected by BOLDFMRI. Hear Res 1998;126(1–2):19–27. [20] Schonwiesner M, von Cramon DY, Rubsamen R. Is it tonotopy after all? Neuroimage 2002;17(3):1144–61. [21] Talavage TM, Sereno MI, Melcher JR, Ledden PJ, Rosen BR, Dale AM. Tonotopic organization in human auditory cortex revealed by progressions of frequency sensitivity. J Neurophysiol 2004;91(3): 1282–96. [22] Petkov CI, Kang X, Alho K, Bertrand O, Yund EW, Woods DL. Attentional modulation of human auditory cortex. Nat Neurosci 2004;7 (6):658–63. [23] Gruetter R, Boesch C. Fast, noniterative shimming of spatially localized signals. In vivo analysis of the magnetic field along axes. J Magn Reson 1992;96(2):323–34. [24] Logothetis N, Merkle H, Augath M, Trinath T, Ugurbil K. Ultra highresolution fMRI in monkeys with implanted RF coils. Neuron 2002;35 (2):227–42. [25] Phillips DP, Semple MN, Calford MB, Kitzes LM. Level-dependent representation of stimulus frequency in cat primary auditory cortex. Exp Brain Res 1994;102:210–26. [26] Baumgart F, Kaulisch T, Tempelmann C, Gaschler-Markefski B, Tegeler C, Schindler F, et al. Electrodynamic headphones and woofers for application in magnetic resonance imaging scanners. Med Phys 1998;25(10):2068–70. [27] Bullmore ET, Suckling J, Overmeyer S, Rabe-Hesketh S, Taylor E, Brammer MJ. Global, voxel, and cluster tests, by theory and permutation, for a difference between two groups of structural MR images of the brain. IEEE Trans Med Imaging 1999;18(1):32–42. [28] Nichols TE, Holmes AP. Nonparametric permutation tests for functional neuroimaging: a primer with examples. Hum Brain Mapp 2002;15(1):1–25. [29] Hayasaka S, Nichols TE. Combining voxel intensity and cluster extent with permutation test framework. Neuroimage 2004;23(1): 54–63. [30] Merzenich MM, Brugge JF. Representation of the cochlear partition of the superior temporal plane of the macaque monkey. Brain Res 1973; 50(2):275–96. [31] Rauschecker JP, Tian B, Hauser M. Processing of complex sounds in the macaque nonprimary auditory cortex. Science 1995;268(5207): 111–4. [32] Rauschecker JP, Tian B. Processing of band-passed noise in the lateral auditory belt cortex of the rhesus monkey. J Neurophysiol 2004;91(6): 2578–89.
ARTICLE IN PRESS C.I. Petkov et al. / Magnetic Resonance Imaging xx (2009) xxx–xxx [33] Wessinger CM, VanMeter J, Tian B, Van Lare J, Pekar J, Rauschecker JP. Hierarchical organization of the human auditory cortex revealed by functional magnetic resonance imaging. J Cogn Neurosci 2001;13(1): 1–7. [34] Le TH, Patel S, Roberts TP. Functional MRI of human auditory cortex using block and event-related designs. Magn Reson Med 2001;45: 254–60. [35] Scarff CJ, Dort JC, Eggermont JJ, Goodyear BG. The effect of MR scanner noise on auditory cortex activity using fMRI. Hum Brain Mapp 2004;22(4):341–9. [36] Yang Y, Engelien A, Engelien W, Xu S, Stern E, Silbersweig DA. A silent event-related functional MRI technique for brain activation
9
studies without interference of scanner acoustic noise. Magn Reson Med 2000;43(2):185–90. [37] Schwarzbauer C, Davis MH, Rodd JM, Johnsrude I. Interleaved silent steady state (ISSS) imaging: a new sparse imaging method applied to auditory fMRI. Neuroimage 2006;29(3):774–82. [38] Marcar VL, Girard F, Rinkel Y, Schneider JF, Martin E. Inaudible functional MRI using a truly mute gradient echo sequence. Neuroradiology 2002;44(11):893–9. [39] Seifritz E, Di Salle F, Esposito F, Herdener M, Neuhoff JG, Scheffler K. Enhancing BOLD response in the auditory system by neurophysiologically tuned fMRI sequence. Neuroimage 2006;29(3): 1013–22.