Network Model for Estimation of Hydrodynamics of. Packed Column ... biological nervous system, such as brain processes information. It is composed of large ...
International Journal of Computer Applications (0975 – 8887) Volume 58– No.3, November 2012
Optimizing Topology in Developing Artificial Neural Network Model for Estimation of Hydrodynamics of Packed Column S.L.Pandharipande
Ankit Singh
Associate Professor Department of Chemical Engg Laxminarayan Institute of Technology, Nagpur
M.Tech Fourth Sem
ABSTRACT Different types of packing materials are used to increase gasliquid contact area in packed columns. The hydrodynamic study of packed column includes the variation of pressure drop and liquid hold up as a function of liquid and gas flow rates. Artificial neural network is an upcoming modeling tool & present work is aimed at optimizing the topology of artificial neural network model for estimation of pressure drop, minimum liquid wetting flow rate and flooding velocity as a function of type and size of packing, liquid flow rate and gas flow rate. The linguistic variable for five types and ten sizes of packing is also incorporated as input parameters with appropriate codes assigned. ANN models with fifteen different topologies have been developed and three models S50, M-100 and C-10 are shortlisted based on better RMSE values. Further, model M-100 has been observed to be highly acceptable based on comparison of relative error all the data points.
Keywords Modeling, packed column hydrodynamics, optimal artificial neural network model.
1. INTRODUCTION Packed towers are differential gas-liquid contacting devices employed in chemical process industry for carrying out distillation and absorption processes. Different types of packing materials like raschig rings, berl saddles, pall ring etc are used to increase gas-liquid contact area. Liquid is distributed at top of the column and compressed gas stream is forced up the column. During the countercurrent flow of these phases over the solid surface, the contacting results. This leads to drop in the pressure of gas phase as it passes upward through the packed section. The increase in the gas flow rate results in offering resistance to the flow of the liquid and it gets accumulated in the void of packing. The hydrodynamic study of packed column is vital in designing and includes the variation of pressure drop and liquid hold up as a function of liquid and gas flow rates. As the relationship is influenced by type and size of packing material, these parameters are also incorporated in correlation reported in the literature. In addition to these hydrodynamic parameters estimation of minimum liquid wetting flow rate and flooding velocity are also essential parameters in designing of packed columns. An Artificial Neural Network (ANN) is an interdisciplinary theme that is based upon the principle of the way the biological nervous system, such as brain processes information. It is composed of large number of processing
Department of Chemical Engg Laxminarayan Institute of Technology, Nagpur elements called nodes working in a network to solve specific problem. [1], [9] Multi Layer Perceptron (MLP), is a typical feed forward neural network and is applied in modeling of many chemical processes. It consists of multilayer structure, with input and output layers and has at least one layer of processing units in between them. The layers between the input and output layers are termed “hidden” since and they do not communicate with the input and output layers directly. The nodes between the two successive layers are interconnected by means of constants called as weights. The outputs from all the input layer nodes are fed to hidden layer nodes, which in turn, feed their outputs to the next, hidden layer nodes. The hidden layer nodes pass the net activation through a nonlinear transformation of a linear function, such as the logistic sigmoidal to compute their outputs. For training of such MLP error back propagation algorithm suggested by Rumelhart [22] is popular. This is based on the Windro-Hoff rule known as Generalized Delta Rule (GDR). Various applications of ANN in modeling, simulation and optimization of chemical processes have been reported in literature, these include, estimation of composition of ternary liquid mixture with its physical properties such as refractive index, pH, conductivity [18], modeling for adsorption of dyes from aqueous solution using rice husk carbon [19], an approach to fault diagnosis in chemical processes [5], fault diagnosis in complex chemical plants [7], incipient fault diagnosis of chemical process [27], leak detection in liquefied gas pipeline [2], [10], for estimation of mass transfer coefficient for fast fluidized bed solids [28] , modeling of distillation column [3], detergent formulation [13], modeling of unsteady heat conduction in semi infinite solid [11], prediction of mass transfer coefficient in downflow jet loop reactor [12] and modeling of packed column [14] and similar other [15],[16] are also reported. Researchers have reported on developments in accurate correlations for estimation of pressure drop, minimum liquid wetting flow rate and flooding velocity. This includes hydrodynamics of packed column pressure drop and liquid hold up for two phase concurrent flow in packed beds [24], a continuum model for gas-liquid flow in packed towers [25], Gas-Liquid hydrodynamics in counter-current columns with Katapak-S and BX Structured packing [21], Hydrodynamics of gas–liquid counter-current flow in solid foam packings [26], Hydrodynamic Parameters for Gas-Liquid Cocurrent Flow in Packed Beds [23], Hydrodynamics of Two-Phase Cocurrent Downflow through Packed Beds [20], Pressure Drop and Liquid Holdup in Co-current Gas-Liquid Downflow of Air-CMC Solutions through Packed Beds[8], Numerical Simulation of Hydrodynamics parameters of the Packed
49
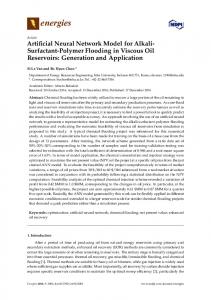
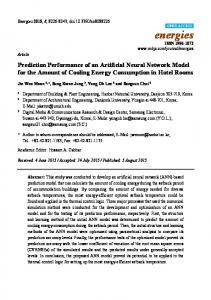
International Journal of Computer Applications (0975 – 8887) Volume 58– No.3, November 2012 Columns: Effects of Geometrical Characteristics on Pressure Drop[6] and a macroscopic model for countercurrent gasliquid flow in packed columns [4]. The schematic of the typical architecture of the network used in developing models is shown in fig 1.
Table no 1: Code assigned for type & size of packing material
2. METHOD The present work aims at estimation of hydrodynamic parameters of a packed column such as pressure drop, minimum liquid wetting flow rate and flooding velocity has been done as a function of input parameters type of packing, size of packing, liquid flow rate and gas flow rate. The data is generated using KATMAR© [29] software. The total data points of 236 are divided in to two sets: training data points of 201 and test data points of 35. The objective of present work is to optimize the ANN topology using elite-ANN© [17]. Special feature of methodology of present work is inclusion of linguistic variables in ANN models developed which is not possible in conventional models. The otherwise difficult variables, type and size have been incorporated as input parameters with proper coding as, given in Table 1.
S.no
Type of Packing
Code assigned
Size of packing
Code assigned
1.
Raschig Ring
101
6 mm
6
2.
Raschig Ring
101
9 mm
9
3.
Pall ring
202
25 mm
25
4.
Pall ring
202
38 mm
38
5.
Berl Saddle
303
6 mm
6
6.
Berl Saddle
303
12 mm
12
7.
Intalox Saddle
404
19 mm
19
8.
Intalox Saddle
404
25 mm
25
9.
Flexiring
505
16 mm
16
10.
SuperTorus Saddle
606
#1
1
The objective of present work is extended further to optimize the ANN topology with respect to iterations, number of hidden layers and number of neurons in each layer. General features of topology of ANN models, simple (S), moderate (M) and complex (C) are given in Table 2. Table 2: Details of topology of ANN models
Model
No. of neurons
Input layer
Simple (S)
Moderate
4
4
Data points
1st Hidden
2nd Hidden
3rd Hidden
layer
layer
layer
0
0
5
10
5
10
Output layer
3
3
(M)
Complex
4
10
10
(C)
Fifteen different ANN models having different combinations of topology parameters have been compared for their accuracy based on root mean square of error values. Best three of
10
3
Training Data
Testing
set
Data set
201 data
35 data
points
points
201 data
35 data
points
points
201 data
35 data
points
points
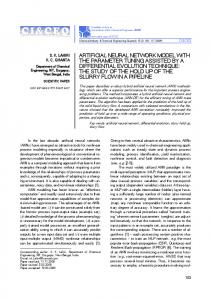
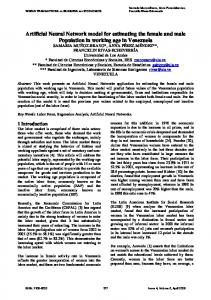
fifteen have been selected for further studies. Fig 2 & 3 shows the comparison of RMSE for different iterations for training and test data sets.
50
Type of packing
Pressure drop
Size of packing
Flooding Velocity MLWR
3000 2000
Actual
1000
S-50 M-100
0 1 27 53 79 105 131 157 183
Gas flow rate
Pressure drop
International Journal of Computer Applications (0975 – 8887) Volume 58– No.3, November 2012
Liquid flow rate
C-10
Data Points
020000 40000 60000 80000 100000 Iterations
Moderate RMSE Training
RMSE Error
Fig 2: Comparison of RMSE of ANN models for training data set.
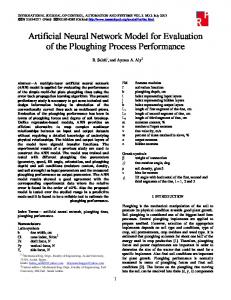
0.1
Simple RMSE Test
0.05
Moderate RMSE Test
0 0
50000 100000 Iterations
Complex RMSE Test
Fig 3: Comparison of RMSE error of ANN models for test data set. The ANN models developed can be used for the estimation of the dependent parameters pressure drop, flooding velocity and minimum liquid wetting flow rate for various values of input parameters. Based on the RMSE training and test data, models S-50, M-100 and C-10 are selected for further analysis due to their better accuracy of predictions. Comparison has been carried out between actual and predicted values of all the output parameters for the three ANN models shortlisted.
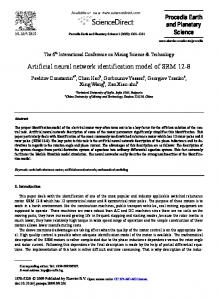
3. RESULTS AND DISCUSSION The graphs are plotted between the actual and predicted values of output parameters, pressure drop, minimum liquid wetting flow rate & flooding velocity for both the training & test data sets for ANN models S-50, M-100 & C-10. Fig 4, 5 & 6 show the graphs plotted between actual and predicted values of pressure drop, flooding velocity and minimum liquid wetting flow rate for training data set respectively.
0.8 0.6 0.4 0.2 0
Actual S-50 M-100 1 27 53 79 105 131 157 183
0
C-10
Data Points
Fig 5: Comparison of actual and predicted values of flooding velocity for training data set
0.4 0.3
Actual
0.2
S-50
0.1
M-100
0 1 35 69 103 137 171
0.05
Fig 4: Comparison of actual and predicted values of pressure drop for training data set
Flooding velocity
Simple RMSE Training
Minimum Liquid Wetting Flow Rate
0.1
C-10
Data Points
Fig 6: Comparison of actual and predicted values of Minimum Liquid Wetting Flow Rate comparison for training data set Fig 7, 8 & 9 show the graphs plotted between actual and predicted values of pressure drop, flooding velocity and minimum liquid wetting flow rate for test data set respectively.
Pressure Drop
RMSE Error
Fig 1: Typical architecture of topology of ANN models
4000
Actual
2000
S-50
0 1 5 9 13 17 21 25 29 33 Data Points
M-100 C-10
Fig 7: Comparison of actual and predicted values of pressure drop for test data set
51
0.8
20 Actual
0.4 0.2 0 1 5 9 13 17 21 25 29 33
S-50
-20
M-100
-40
C-10
-60
Data Points
Minimum Liquid Wetting flow rate
0.4 Actual S-50
0 1 6 11 16 21 26 31 Data Points
M-100 C-10
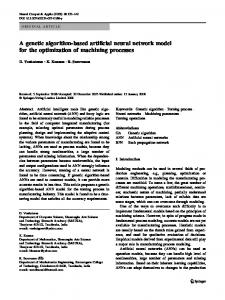
Fig 9: Comparison of actual and predicted values of minimum liquid wetting flow rate for test data set It is observed that the ANN models developed in the present work have fairly good accuracy levels of prediction for all the output parameters defining hydrodynamics of packed column. However it can be said that the deviation in prediction from actual values are more for models S-50, C-10 than M-100. This claim of superior accuracy of prediction of M-100 is substantiated by calculating relative error for all output values predicted by ANN models. Fig 10, 11 & 12 show the graphs plotted for relative errors of different models for output parameters pressure drop, minimum liquid wetting flow rate for training data set.
100 50
Relative error 1
-50 -100 -150 -200
1 24 47 70 93 116 139 162 185
0
Relative error 1 Relative error 2 Relative error 3
-80
Fig 8: Comparison of actual and predicted values of flooding velocity for test data set
0.2
0 1 22 43 64 85 106 127 148 169 190
0.6
Relative error 2 Relative error 3
-250 Fig 10: Comparison of relative errors for different models for pressure drop for training data set.
Fig 11: Comparison of relative errors for different models for flooding velocity for training data set.
15 10 5 0 -5 -10 -15 -20
Relative error 1 1 22 43 64 85 106 127 148 169 190
Flooding velocity
International Journal of Computer Applications (0975 – 8887) Volume 58– No.3, November 2012
Relative error 2 Relative error 3
Fig 12: Comparison of relative errors for different models for minimum liquid wetting flow rate for training data set. Fig 13, 14 & 15 show the graphs plotted for relative errors of different models for output parameters pressure drop, minimum liquid wetting flow rate for test data set.
100 50 0 -50 1 5 9 13 17 21 25 29 33 -100 -150
Relative error 1 Relative error 2
Fig 13: Comparison of relative errors for different models for pressure drop for test data set
50 0 -50 1 5 9 13 17 21 25 29 33 -100 -150 -200
Relative error 1 Relative error 2 Relative error 3
Fig 14: Comparison of relative errors for different models for flooding velocity for test data set
52
International Journal of Computer Applications (0975 – 8887) Volume 58– No.3, November 2012 [5] Fan J Y, Nikolau M, White R E, AIChEJ 39 (1993) 82.
10 Relative error 1
5 0 -5
1 5 9 13 17 21 25 29 33
-10
[6] Haghshenas M Fard, M Zivdar, R Rahimi and Nasr M Esfahany, World Applied Sciences Journal, 7 (2009) 1439.
Relative error 2
[7] Hoskins J C, Kaliyur K M, Himmelblau D M, AIChEJ 37 (1991) 137.
Relative error 3
[8] Jagadeesh Babu P E, Arunagiri A, Reghupathi I., and Murugesan T, Chem. Biochem. Eng, 21 (2007) 121.
-15
[9] Pandharipande S L, An Introduction to Artificial Neural Networks, Nagpur: Denett Publications (2008).
Fig 15: Comparison of relative errors for different models for minimum liquid wetting flow rate for test data set
[10] Pandharipande S L, Badhe Y P, Chem Eng World, 38 (2003) 70.
4. CONCLUSION
[11] Pandharipande S L, Badhe Y P, Chem Eng World, 38 (2003) 82.
The objective of the present work was to explore the possibility of development of optimal ANN model for packed column hydrodynamics. Effort has been made to incorporate the linguistic variables such as type and size as input parameters with appropriate coding done for five different types of packing having ten different sizes. ANN models with fifteen different combinations of topologies have been developed and three ANN models S-50, M-100 and C-10 have been shortlisted based on better RMSE for training and test data sets for estimation of pressure drop, minimum liquid wetting flow rate and flooding velocity as a function of type and size of packing, liquid flow rate and gas flow rate. Among the three models shortlisted, M-100 has been observed to be optimal for the given task of modeling of hydrodynamics of packed column. The final criterion of selection was based on comparison of relative error for all the output parameters for all the ANN models developed for all the data points.
[12] Pandharipande S L, Badhe Y P, IChE 45 (2003) 256.
The present work has also highlighted the accuracy, ease of the ANN as a modeling tool in such a complex dynamic situation involving three phase flow with the acceptable accuracy.
[21] Romulus D, Gheorghe S, Grigore B and Valentin P, Revue Roumaine de Chimie 51 (2006) 219.
5. ACKNOWLEDGEMENT Authors are thankful to Director, LIT, Nagpur for the facilities and encouragement provided. Authors also wish to express the sincere gratitude towards the officials of Katmar software for giving the permission for data used in the present work.
[13] Pandharipande S L, Agarwal R S, Gogte B B, Badhe Y P, Chem Eng World 38 (2003) 78. [14] Pandharipande S L, Mandavgane S A, Indian J Chem Technol 11 (2004) 820. [15] Pandharipande S L, Bhaise A, Poharkar A, Chem. Eng world 39 (2004) 50. [16] Pandharipande S L, Badhe Y P, J Inst Eng 84(2004) 65 [17] Pandharipande S L, Badhe Y P, 2004. elite-ANN©, ROC No SW-1471. [18] Pandharipande S L, Shah A M, Heena T, International Journal of Computer Applications 41(2012) 23. [19] Pandharipande S L, Khonde R D, International Journal of Computer Applications 41(2012) 1. [20] Rao V G, Ananth M S, Varma Y B G, AlChE Journal 29 (1983) 467.
[22] Rumelhart D. E, McClleland, Back Propagation Training Algorithm Processing, M.I.T Press, Cambridge Massachusetts (1986). [23] Saez A.E, Carbonell R.G, AlChE Journal 31(1985) 52. [24] Speechia V & Baldi G, Chemical Engineering Science 32(1977) 515. [25] Shijie Liu, Chemical Engineering Science, 56 (2001) 5945.
REFERENCES
[26] Stemmet C P, Jongmans J N, Van der Schaaf J, Kuster B F M, Schouten J C., Chemical Engineering Science, 60 (2005) 6422.
[1] Anderson J A, An Introduction to Neural Networks, New Delhi: Prentice-Hall of India, Pvt Ltd (1999)
[27] Watanabe K, Abe M, Kubota M, Himmelblau D M, AIChEJ 35 (1989) 137.
[2] Belsito S, Banerjee S, AIChEJ 44 (12) (1998) 2675.
[28] Zamankhan P, Malinen P, Lepomaki H, AIChEJ 43(1997) 1684.
[3] Baratti R, Vacca G, Servida A, Hydrocarbon Processing, 74 (1995) 35.
[29] Packed column by Katmar software 2011 trial version.
[4] Dankworth D.C, Sundaresan S, AIChEJ, 35 (1989) 1282.
53