164 - Options for Improving the Match Between Household Electricity Demand and Photovoltaic Generation at High Latitudes J. Widén1*, E. Wäckelgård1 and P. Lund2 1 2
Department of Engineering Sciences, Uppsala University, P.O. Box 534, 751 21 Uppsala, Sweden
Advanced Energy Systems, Helsinki University of Technology, P.O. Box 2200, FI-02015 HUT, Finland *
Corresponding Author,
[email protected]
Abstract Extensive integration of distributed photovoltaic (PV) generation into residential areas is likely to be a challenge to the control of power quality in low-voltage distribution grids. Overproduction of power caused by mismatching load and demand profiles puts restrictions on the amount of distributed generation allowed locally in the grid at high penetration levels. This paper investigates the load matching capability of PV at Stockholm, Sweden, and how it can be improved by different measures; PV panel orientation, demand side management (DSM) and electricity storage. Detailed models for PV generation and household electricity load are used. Energy storage has the greatest potential of obtaining a better match between load and production in terms of solar fraction at system setups where the production is several times higher than the mean load, although both DSM and PV array orientation options have comparable impacts. At lower levels of overproduction, orientation and DSM options seem to be slightly more effective, mainly because of energy losses in the storage medium. Keywords: Photovoltaics, Distributed generation, Load matching
1. Introduction Utilization of solar energy is gaining increasing interest as a means of reaching sustainability in the built environment. In Sweden, and at high latitudes in general, direct generation of electricity with solar photovoltaics (PV) has traditionally been ascribed a low potential for contribution to the total domestic electricity demand. As recent studies have pointed out, however, grid-connected distributed PV, e.g. roof-top systems, could gain attention as an energy-saving measure in domestic buildings [1]. In Sweden, therefore, it seems likely that a more extensive integration of PV will start at the lowest voltage level of the distribution grid. This makes the load matching capability of the electricity production a critical issue. If production and load do not match, overproduction of power could lead to problems with power quality at high penetration levels of distributed generation, of which the main issue is voltage rise [2]. There are some theoretical studies on this effect for high latitudes (see for example [3], [4]) but almost no measurements or observations, because the critical amount of generation is yet to be integrated. In this paper three options for improved load matching are studied. The first option is orientation of the photovoltaic arrays. For maximization of the array output at any instant of time, the incidence angle of the incoming radiation should be zero. For maximum annual production at high latitudes,
1
the optimal azimuth angle is due south, and the optimal tilt somewhat higher than the latitude. If matching with the evening or morning load is desirable, however, orientation eastward or westward could be an option, favouring morning and evening sun respectively. The second option is altering the demand profile through demand side management (DSM). This refers to the active rescheduling of energy-demanding activities or appliances in the households. From a utility’s point of view, a smoothened load curve is desirable, which could be achieved by encouraging households to reschedule energy use to low-demand periods. For better load matching with photovoltaics, loads should instead be shifted toward mid-day. These two options are compared to shifting of production to high-demand periods through energy storage. A description of the models used for generating electricity load and production data follows in Section 2. Section 3 describes the different load matching options in more detail and results of simulations for improved matching with household electricity load in detached houses are presented in Section 4.
2. Models For the end-use-specific household electricity demand, a previously developed load model was used, validated and adjusted against preliminary measurements from the Swedish Energy Agency (SEA). For generation of photovoltaic electricity generation data, a detailed calculation procedure was applied to hourly series of direct and diffuse irradiation on the horizontal plane. 2.1. Domestic load model The model for generation of load profiles has been described and validated in [5] and [6]. It constructs household electricity load profiles for a number of end uses by adding appliance loads together, according to use patterns described by time-use data in a representative sample of Swedish households. In this respect it can be classified as a bottom-up model, similar to that in [7]. The model is dependent on (a) time-use data, (b) data on mean appliance powers and (in some cases) maximum appliance runtimes and (c), for modeling of lighting, data on daylight availability. The time-use data set used, collected by Statistics Sweden, has undergone thorough examination and has been used previously in activity visualization studies (see for example [8]). Representative appliance characteristics were collected from publicly available product tests from the Swedish Consumer Agency [9] and daylight availability data were generated for a standard building in Stockholm with Satel-Light [10]. The resulting load data consists of annual series of aggregated hourly electricity demand for 11 different end-uses in the almost 200 households in the time-use data set, corrected for seasonal variations and validated for consistency against preliminary results from ongoing large-scale measurements performed by the Swedish Energy Agency [11]. 2.2. Photovoltaic system output A model was constructed for computation of the maximum power point output of a photovoltaic system from radiation components on the horizontal plane, based on general transposition formulas for beam radiation, the Hay and Davies model for diffuse radiation and assumed seasonal variations in ground reflectance [12]. All radiation components are modified by an incidence angle modifier, expressed by [13], that depends on the effective angles of incidence. The conversion efficiency of the photovoltaic array, dependent on ambient temperature and standard NOCT measurements for solar cells, was modeled from [12]. Standard silicon solar cell parameters were
2
used and temperature and radiation data were generated for Stockholm with the climate database program Meteonorm 6.0. [14].
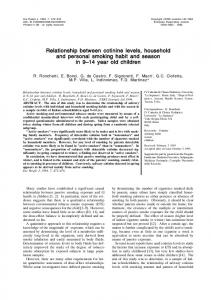
3. Load Matching Options The three options for load matching described in the introduction were applied to the load and production data. Five cases are considered. For PV panel orientation, optimal orientation of panels for maximization of the solar fraction was considered (cases 1a-b). For demand side management two cases involving different amounts of shiftable load were defined (cases 2a-b). These options are compared with a small storage option (case 3). 3.1. Photovoltaic panel orientation An optimal distribution of panel tilts and azimuth angles was determined for maximization of the fit to annual and summer PV production. The optimization problem was formulated as a constrained minimization problem with the solar fraction calculated from a grid of candidate tilts and azimuth sets with 15 degree intervals. The resulting orientation distributions (cases 1a and 1b) are shown in Figure 1. 90
90
60
60 0.52 0.17
30
0.72 0 −90
−60
−30 0 30 Azimuth (γ)
0.2 0.17
Tilt (β)
Tilt (β)
0.3
0.19
0.8 0.64
30 0.28 60
0 −90
90
−60
−30 0 30 Azimuth (γ)
60
90
Fig. 1. Optimal relative distributions of array orientations for maximization of annual (filled boxes) and summer (outlined boxes) solar fraction for ALR 2 (left) and ALR 8 (right). Numbers indicate fraction of systems with the orientation in question. The contour curves indicate annual production relative to the production at optimal orientation with 5 % steps, starting from 95 %.
3.2. Demand side management The applied approach splits the total load curves into shiftable and fix parts, where the shiftable power is assumed entirely redistributable over the day. When considering net production and demand profiles, net production can be represented as negative demand. The DSM strategy then refers to the more general case of valley-filling measures, leveling out demand sinks. Computationally, this means finding an optimal power level such that filled-in energy below this level equals the shiftable energy. This approach gives an upper level to the achievable load matching improvement through DSM. Two cases (2a and 2b) are defined, where in the first case the shiftable demand is that from washing, drying and dishwashing appliances that could be easily rescheduled and involve relatively little user interaction. The second case involves all end uses except lighting, cold
3
appliances and undefined additional demand, and implies considerable violation of everyday routines. 3.3. Storage A third option for increased load matching is introducing small storage units as buffers between the PV system and the distribution grid. To study the effect of such systems a simple battery model is applied. When the PV system overproduces power, the battery stores energy up to the battery capacity Elim. At net demand, the battery unloads energy with an efficiency keff . State-of-charge limits for avoiding deep-charging are not included in the model. In the case studied here (case 3) a storage size Elim of 1 Wh/Wp is used and an efficiency keff of 0.8.
4. Results 4.1. Setups and measures The following results are presented for two setups with different relative demand-to-production ratios, corresponding to different PV penetration levels. The array-to-load ratio (ALR) is the ratio of nominal array peak power to the mean load, in this case the annual mean load for detached houses. Two system setups with ALR of 2 and 8 are used. The relative sizes of load and production are shown in Figure 2. The first setup results in a small overproduction, corresponding to a penetration slightly above optimal from the grid point of view (cfr. [3]). The second setup causes a massive overproduction but nonetheless yields just enough to annually cover the household electricity demand. 5
5 P , apartments L L
PP, ALR 2
4
PP, ALR 2 P , ALR 8 P
m
Power (W/W , W/W )
PP, ALR 8
m
Power (W/W , W/W )
4
P , apartments L PL, detached houses
P , detached houses
3
p
p
3
2
1
1
0
2
6
12 Hour
18
0
24
6
12 Hour
18
24
Fig. 2. Average load (PL) and production (PS) for the whole year (left) and the summer months May, June and July (right) at different relative system sizes (ALRs). In addition to the load profile for detached houses, the corresponding load profile for apartments is shown for comparison purposes.
The main indicator of load matching considered here is the solar fraction, which is the fraction of load covered by PV. Since the overproduced power level is critical from the grid point of view, this is covered briefly. 4.2. Impact on solar fraction Table 1 summarizes the results of simulations with the five load matching cases described above together with a base case (case 0) with the default load and production shown in Figure 2 and theoretical limits to the solar fraction (daily and annual optimum).
4
Table 1. Annual and summer solar fraction for different load matching cases and relative system sizes for detached houses. Daily optimum refers to the theoretical solar fraction that would occur if each daily load and demand were optimally matched. Annual optimum refers to the solar fraction that would result from an optimal match of the total annual load and demand. The summer solar fraction is calculated over the months of May, June and July.
Summer
Summer
Annual
Annual
Case
ALR 2
ALR 8
ALR 2
ALR 8
0
0.36
0.58
0.21
0.35
1a
0.36
0.65
0.21
0.38
1b
0.39
0.66
0.19
0.37
2a
0.39
0.64
0.23
0.41
2b
0.41
0.73
0.24
0.48
3
0.37
0.80
0.21
0.43
Daily opt.
0.41
0.98
0.24
0.65
Annual opt.
0.41
1.0
0.24
0.94
It is seen from the table that the summer and annual solar fractions for the smaller ALR system are rather close to optimum already in the base case, since the overproduction is not very substantial. For ALR 8 the difference between the orientation cases and the optimum limits is much greater. The re-orientation cases (1a and 1b) yield somewhat increased solar fractions, although the effect is relatively small. The DSM options (cases 2a and 2b) yield higher solar fractions throughout, although in case 2a for the summer the figures are comparable and somewhat higher for the reorientation case. Although storage (case 3) is the most flexible of the options, the loss of energy that depends on the efficiency of the storage medium makes it in some cases slightly worse than both DSM and panel orientation options. 4.3. Impact on overproduced power level From the grid point of view, the instantaneous level of the overproduced power is critical, since it affects voltage levels locally in the grid. An analysis involving mean load cannot give any detailed insights into grid issues, but an average response in power overproduction to load matching measures can be determined. As an example, Figure 3 shows a duration graph over the overproduced power for the base case (case 0) and the two DSM cases (2a and 2b). For the ALR 2 setup, the overproduced energy is heavily reduced, for the more extensive DSM scheme (case 2b) almost entirely. For the ALR 8 setup the effect is smaller since the amount of shiftable energy is smaller compared to the overproduction. A comparison with the panel orientation cases (not shown here) suggests that the DSM option is more effective at ALR 2 while the orientation options are more effective at ALR 8, since they shift more of the heavy overproduction from midday. A more comprehensive analysis of the impact on the overproduced power will be covered in [15].
5
0.8
Case 0 Case 2a Case 2b
0.6 0.4 0.2 0 0
1000 2000 Time (hours)
1
Overproduction (W/Wp)
p
Overproduction (W/W )
1
0.8 0.6 0.4 0.2 0 0
3000
Case 0 Case 2a Case 2b
1000 2000 Time (hours)
3000
Fig. 3. Duration curves showing the overproduced power at ALR 2 (left) and ALR 8 (right) for the base case (case 0) and the two DSM cases (case 2a and 2b) for detached houses.
5. Conclusion For large system setups, corresponding to high penetration levels of PV, energy storage has the greatest potential of obtaining a better match between load and production in terms of solar fraction, although both DSM and PV array orientation options have comparable impacts. At more moderate overproduction, orientation and DSM options seem slightly better, because of energy losses in the storage medium.
References [1] N.I. Carlstedt, B. Karlsson, E. Kjellsson, L. Neij, O. Samuelsson (2007), Konkurrenskraft för nätansluten solel i Sverige (Competitiveness of grid-connected solar electricity in Sweden), Elforsk Report 06:57. [2] PV-UPSCALE (2007), Publications review on the impacts of PV distributed generation and electricity networks, http://www.pvupscale.org. [3] J.V. Paatero, P.D. Lund, Renewable Energy 32 (2007), 216-234. [4] M. Thomson, D.G. Infield, IET Renewable Power Generation 1 (2007) 33-40. [5] J. Widén, E. Wäckelgård, K. Ellegård, Modeling household electricity load from time-use data. International Scientific Conference on “Green Energy with energy management and IT” in connection with the Swedish National Energy Convention 2008, Älvsjö fair, Stockholm, 12-13 March 2008. [6] J. Widén, M. Lundh, I. Vassileva, E. Dahlquist, K. Ellegård, E. Wäckelgård, Constructing load profiles for household electricity and hot water from time-use data – modelling approach and validation. Manuscript submitted to Energy and Buildings. [7] A. Capasso, W. Grattieri, R. Lamedica, A. Prudenzi, IEEE Transactions on Power Systems, 9 (1994) 957-964. [8] K. Ellegård, M. Cooper, electronic International Journal of Time Use Research, 1 (2004), 37–59. [9] Swedish Consumer Agency, http://www.konsumentverket.se. [10] Satel-Light, The European Database of Daylight and Solar Radiation, http://www.satel-light.com. [11] P. Bennich, A. Persson, Methodology and first results from end-use metering in 400 Swedish households. In Proceedings of EEDAL 06 International energy efficiency in domestic appliances and lighting conference, Gloucester 21-23 June 2006. [12] J.A. Duffie, W.A. Beckman (1991), Solar Engineering of Thermal Processes, John Wiley & Sons, Inc.
6
[13] D.L. King, J.A. Kratochvil, W.E. Boyson, W.I. Bower, Field experience with a new performance characterization procedure for photovoltaic arrays, 2nd World Conference and Exhibition on Photovoltaic Solar Energy Conversion, 1998. [14] Meteotest, http://www.meteotest.ch. [15] J. Widén, E. Wäckelgård, P. Lund, Options for improving the load matching capability of distributed photovoltaics at high latitudes, manuscript to be submitted to Solar Energy.
7