May 31, 2012 - tween hole and electron FSs becomes weakened. (Here, x and y are ..... the node should be on the zone-centered hole FSs. Ac- cording to ...
Orbital-dependent electron correlation effect on the two- and three-dimensional Fermi surfaces in KFe2 As2 revealed by angle-resolved photoemission spectroscopy T. Yoshida1,2 , S. Ideta1 , I. Nishi1 , A. Fujimori1,2 , M. Yi3 , R. G. Moore3 , S. K. Mo3 , D.-H. Lu3 , Z.-X. Shen3 , Z. Hussain4 , K. Kihou2,5 , P. M. Shirage2,5 , H. Kito2,5 , C. H. Lee2,5 , A. Iyo2,5 , H. Eisaki2,5 , H. Harima2,6 1
Department of Physics, University of Tokyo, Bunkyo-ku, Tokyo 113-0033, Japan JST, Transformative Research-Project on Iron Pnictides (TRIP), Chiyoda, Tokyo 102-0075, Japan 3 Department of Applied Physics and Stanford Synchrotron Radiation Laboratory, Stanford University, Stanford, CA94305, USA 4 Advanced Light Source, Lawrence Berkeley National Lab, Berkeley, California 94720, USA 5 National Institute of Advanced Industrial Science and Technology (AIST), Tsukuba 305-8562, Japan and 6 Department of Physics, Kobe University, Kobe, Hyogo 657-8561, Japan (Dated: June 1, 2012)
arXiv:1205.6911v1 [cond-mat.str-el] 31 May 2012
2
We have performed an angle-resolved photoemission study of the hole-overdoped iron pnictide superconductor KFe2 As2 , which shows a low Tc of ∼4 K. Most of the observed Fermi surfaces show nearly two-dimensional shapes, while a band near the Fermi level shows a strong dispersion along the kz direction and forms a small three-dimensional hole pocket centered at the Z point, as predicted by band-structure calculation. However, hole Fermi surfaces of yz and zx orbital character centered at the Γ point of the two-dimensional Brillouin zone are smaller than those predicted by the calculation while the other hole Fermi surfaces of xy orbital character is much larger. Clovershaped hole Fermi surfaces around the corner of the 2D BZ are also larger than those predicted by the calculation. These observations are consistent with the de Haas-van Alphen measurement and indicate orbital-dependent electron correlation effects. The effective masses of the energy bands show moderate to strong enhancement, partly due to electron correlation and partly due to energy shifts from the calculated band structure. PACS numbers: 74.25.Jb, 71.18.+y, 74.70.-b, 79.60.-i
I.
INTRODUCTION
In contrast to the d-wave superconducting gaps in the high-Tc cuprate superconductors, experimental results on most of the iron-pnictide superconductors have indicated that superconducting gaps are nodeless and on the entire Fermi surfaces (FSs)1,2 . However, some of the iron pnictide superconductors show signatures of the nodes in the superconducting gaps. For example, thermal conductivity measurements of isovalent substituted system BaFe2 (As1−x Px )2 3 and the electron doped systems Ba(Fe1−x Cox )2 As2 and Ba(Fe1−x Nix )2 As2 4 in the superconducting state have shown signature of line nodes. According to the theories of spin fluctuation-mediated superconductivity, line nodes may appear when the pnictogen height becomes small5,6 , the hole FS of dxy character around the zone center disappears and nesting between hole and electron FSs becomes weakened. (Here, x and y are referred to the direction of the nearest neighbor Fe atoms.) The hole FSs of these systems exhibit strong three-dimensionality7–9 , resulting in poor nesting between the hole and electron FSs. In the K-doped BaFe2 As2 (Ba122) system, a full superconducting gaps opens and a high Tc of ∼ 37 K is achieved in the optimally doped region1 , while the existence of line nodes in the superconducting gap has been suggested for the end member compound KFe2 As2 , which shows a low Tc of ∼ 4 K2 from penetration depth10 , thermal conductivity11 , and nuclear quadrupole resonance (NQR) measurements12 . The electronic specific heat coefficient γ of KFe2 As2 is as large as ∼70 mJ/K2 mol12 ,
indicating strong electron mass renormalization due to electron correlation. A previous angle-resolved photoemission study (ARPES) of KFe2 As2 has revealed that there are hole FSs (α and β) around the zone center while the electron pockets around the zone corner disappear and change to small hole pockets (ǫ) surrounding the zone corner in a clover shape13 . Band-structure calculation has predicted the third hole FS around the zone center, namely, the ζ hole FS which has a similar size to the α FS, but it has not been resolved in the previous ARPES study. Recently, a de Haas-van Alphen (dHvA) study has revealed that the ζ FS exists around the zone center14 . Furthermore, the dHvA study has indicated the shrinkage of the α and ζ FSs and the enhancement of the electron masses compared to those predicted by the band-structure calculation. In the present study, in order to reveal the shapes of the FSs in three-dimensional momentum space, we have performed an ARPES study of KFe2 As2 using high-quality single crystals and various photon energies. We have determined the orbital character of the FSs by polarization dependent measurements and have revealed strongly orbital dependent correlation effects.
II.
EXPERIMENT AND BAND-STRUCTURE CALCULATION
ARPES measurements were performed at beamline 54 of Stanford Synchrotron Radiation Lightsource (SSRL) and at BL10.0.1 of Advanced Light Source (ALS). Scienta SES-R4000 electron analyzers and linearly polarized
2
0.0
(a)
SS
az b
e
2
n
h = 25eV
-0.1
1
)Ve(
G
-0.2
E ot evitaler ygrenE
F -0.3
0.0
(b)
SS
az b
n
e
h = 30eV
kY (π/a)
X
1
(a) kz~Γ α
ζ
ε β
0
-1
-0.1
(b) kz~Z
0
hν= 22eV -1 -1
0
1
α
ζ
β KFe2As2
hν= 30eV -1
0
1
2
kX (π/a) -0.2
KFe2As2
pp
-0.3
( , )
)Ve(
(0,0) (c)
G
FE
e
a
0.0
X
ot evitaler ygrenE
z b
-0.2
-0.4
-0.6 -0.5
0
0.5
p
1.0
1.5
2.0
k ( /a)
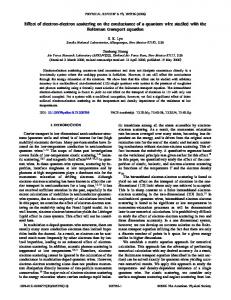
FIG. 1. Band dispersions of KFe2 As2 in the zone diagonal direction. (a),(b) ARPES spectra taken at hν= 25eV and 30eV, respectively, corresponding to kz =6.5 and 7.0 (2π/c). SS denotes surface states. (c) Band dispersions predicted by band-structure calculation.
light were used at both beamlines. The typical energy resolutions were 10 meV at SSRL and 20 meV at ALS, respectively. Single crystals of KFe2 As2 were grown from a K flux. Samples were cleaved in situ and measured at a temperature of 15 K in a pressure better than 5×10⁻¹¹ Torr. We have performed the measurements at photon energies from hν=14 to 40 eV. The in-plane (kX , kY ) and out-of-plane (kZ ) momentum are expressed in units of π/a and 2π/c, respectively, where a = 3.864 ˚ A and c = 13.87 ˚ A. Here, the X and Y axes point towards the Fe-As bond direction, while the x and y axes are rotated by 45 degrees from the X-Y coordination. The electronic band structure of KFe2 As2 was calculated within the local density approximation (LDA) by using the full potential LAPW (FLAPW) method. We used the program codes TSPACE15 and KANSAI-06. The experimental crystal structure16 including the atomic position zAs of As (pnictogen height) was used for the calculation.
III.
RESULTS AND DISCUSSION
Band dispersions for a cut along the diagonal of the two-dimensional Brillouin zone (BZ) taken with hν=25
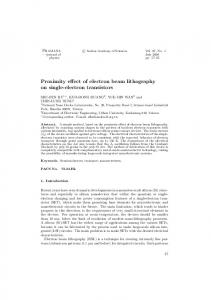
FIG. 2. (Color online) FSs of KFe2 As2 observed by ARPES. ARPES intensity at EF mapped in the kX -kY plane taken at two different photon energies. Red dots indicate kF positions determined by the peak positions of momentum distribution curves (MDC’s) and white dotted lines indicate FSs deduced from the kF positions.
eV and 30eV are shown in Figs. 1(a) and 1(b). All the energy bands predicted by the calculation [Fig. 1(c)] are observed. Particularly, we have clearly observed the ζ band near the α band around EF consistent with the dHvA result14 . In addition to these bands, we find that another hole-like band crossing EF exists near the zone center. Since this is not predicted by the bulk bandstructure calculation, we attributed this band to surface states. While the ζ band is nearly degenerated with the α band for hν =25 eV, these bands are separated for hν =30 eV, indicating three-dimensionality of the band dispersions. FS mapping in the kX -kY plane is shown in Figs. 2 (a) and 2(b). By assuming the inner potential V0 =13.0 eV, panels (a) and (b) approximately represent the kX kY planes including the Γ and the Z point, respectively. The overall FS shapes nearly agree with those observed in the previous study13 . Small hole FSs also appear around the BZ corner due to heavy hole doping. However, several new observations should be remarked. One is that all the three hole FSs around the center of the 2D BZ have been clearly resolved. The middle hole FS is ascribed to the ζ FS reported in the dHvA study14 . Another point is that a small FS around the zone center has been observed. Since this FS is not predicted by the band-structure calculation and has nearly two-dimensional dispersions as indicated below, it can be ascribed to surface states. The dispersions of the surface states form ridge-like structures extending to the kX and kY directions, resulting in the peculiar cross-like intensity distribution at EF . In Fig.3, we compare the FSs obtained by ARPES with the band-structure calculation. As seen in panels (a) and (b), the sizes of the observed α and β FSs do not show appreciable change with kz . On the other hand, the shape of the ζ FS significantly changes between kz ∼ Γ and Z. While the ζ FS has a diamond-like cross-section
3 1
ε Γ α
0
kY (π/a)
hν= 30eV
hν= 22eV
(a)
(b) Z
ζ β
α
β
ζ
-1 1
ε
(c) Γ
0
ζ
ε
(d) Z
β
ζβ
α
α
KFe2As2
-1 -1
0
1 -1
0
1
kX (π/a) FIG. 3. (Color online) Comparison of FSs obtained by ARPES and those predicted by band-structure calculation. (a),(b) FSs determined by ARPES. kF positions in Fig. 2 have been symmetrized in the first BZ. (c),(d) FSs given by the band-structure calculation. A small FS around the Z point comes from a three-dimensional dz 2 band shown in Fig. 4 (c).
(a)
SS
az b
(b)
32 eV
)stinu .bra( ytisnetnI
7
30 eV 28 eV
z
k
z
k
24 eV
p
26 eV
)c/ 2(
p
)c/ 2(
G
6
(c)
n
h =
Z
7
6
22 eV 20 eV 18 eV 16 eV
-1.0
14 eV
Z
5 -0.5
0
k
//
p
( /a)
5 0.5
1.0
-0.2
-0.1
0
0.1
Energy Relative to E
F
(eV)
-0.3
-0.2
-0.1
0
Energy Relative to E
F
(eV)
FIG. 4. (Color online) kz dependence of the electronic structure of KFe2 As2 . (a) Spectral weight mapping at EF in the kk -kz plane, where kk is in the Γ-X direction. The peak positions of momentum distribution curves are shown by red circles. SS denotes surface states. (b) Normal emission spectra corresponding to the arrow in panel (a). (c) ARPES intensity plot along the Γ-Z line. Three-dimensional d3z 2 −r2 band predicted by the band-structure calculation with renormalized mass m∗ /mb =3 are also plotted.
for kz ∼ Γ and is nearly degenerate with the α FS in the zone diagonal direction, it has a circular cross-section for kz ∼ Z point. Since the Ba122 system in general has threedimensional FSs as predicted by band-structure calculations17 and confirmed by ARPES8,9 , we have investigated the electronic band dispersions in the kz direction by changing the excitation photon energy.
Figure 4(a) shows spectral weight mapping at EF in the kk -kz plane, where the direction kk in the kX -kY plane is the Γ-X direction. kz has been determined by assuming the inner potential of V0 = 13.0 eV, so that the dispersion of the d3z2 −r2 band along kz has the correct periodicity and phase as mentioned below. From Fig. 4(a), one can see that the α and β FSs are nearly two-dimensional, while the ζ FS has some three dimensionality and becomes large near the Z point compared to the Γ point. This behavior has also been observed in the ARPES spectrum of K-doped Ba12218. In normal emission spectra [Fig.4 (b)] the d3z2 −r2 band clearly shows a parabolic dispersion along the kz direction and slightly crosses EF in the vicinity of the Z point forming a small three-dimensional hole pocket around the Z point. With a mass enhancement factor m∗ /mb ∼ 3, this band is also well explained by the band-structure calculation. In order to determine the orbital character of the FSs, we have investigated the polarization dependence of the ARPES intensity as shown in Fig. 5. FS mapping shown in panels (a) and (b) indicates clear polarization dependence in the intensity distribution for each FS. We have simulated the intensity distribution by using the following assumptions. Based on the result of the band-structure calculation, we assume that three orbitals xy, yz and zx constitute the FSs. We refer to the three band as xy, yz and zx band according to the orbital character of the band with momentum in the zone diagonal kx (k kX +kY ) direction. Using the angle θ around the Γ point, the orbital character of the xy, zx and yz band can be approximately expressed by |xy >, cos θ|zx > + sin θ|yz > and − sin θ|zx > + cos θ|yz >, respectively. By assuming the dipole approximation of the transition matrix element | < i|ε · r|f > |2 , where |i >, |f >, and ε are the initial state, the final state, and the polarization vector, respectively, one can predict the intensity distribution. For example, when |i >= |xy >, ε//x and |f > is a wave function of a free electron, the transition matrix element | < i|ε · r|f > |2 is proportional to ky2 in the lowest order in k. Figures 5(c) and 5(d) are the results of the intensity simulations. Here, we assign the inner, middle, and outer FSs to the yz, xz, and xy-band, respectively, so that we can reproduce the experimental intensity distribution. This assignment of the orbital character is difference from the band-structure calculation where the inner, middle, and outer FSs have xz, xy and yz orbital character, respectively. However, present ARPES result is consistent with the previous ARPES result of Co-Ba12219 and the theoretical prediction of LDA+DMFT20 , which indicate the energy inversion of the xy and yz/xz bands due to orbital-dependent correlation effect. That is, the xy band in most strongly affected by electron correlation and is shifted upward relative to the other bands. Another discrepancy from the band-structure calculation is the inversion of the yz and xz bands in the kX (kY ) direction. In the result of the band-structure calculation,
4 1
1
n
(a)
p
)a/ (
0
there are excess hole doping of 0.11 per Fe atom at the sample surface. Nevertheless the surface effect is not so serious as those in 1111 system where excess 0.5-0.6 holes per Fe are doped, and one can still discuss mass renormalization from the present result.
n
h = 40 eV
(b)
h = 40 eV
0
y
k -1
-1
-1
0
k
x
p
1
-1
( /a)
0
k
1
y
1
p
( /a)
1
(c)
(d)
TABLE I. Cross-sectional areas and effective masses of FSs of KFe2 As2 determined by ARPES and dHvA experiment. The areas are expressed as a percentage of the area of the 2D BZ. me and mb are the free-electron and band masses, respectively. FS kz
p
)a/ (
0
α
0
k
y
ζ -1
-1 -1
0
k
x
p
( /a)
1
-1
0
k
x
1
β
p
( /a)
ǫ FIG. 5. (Color online) Polarization dependence of the FS mapping for KFe2 As2 . (a),(b) Measured ARPES intensity at EF in the kX -kY plane taken at hν=40 eV (kz ∼ Γ ). Electric vectors are shown by arrows. (c),(d) Simulation of the ARPES intensity distribution corresponding to panels (a) and (b). Shapes of FSs have been taken from Fig. 2. By assuming certain orbital character for each FS, intensity distribution has been simulated and is shown by thickness of the curves. (For details, see the text.)
the inner FS has xz character (in the kX direction) with rounded-square shape around the Γ point and becomes circular around the Z point because of hybridization with the z 2 orbital. In the present ARPES result, such a character has been observed in the middle ζ FS. According to the angular-dependent magnetoresistance oscillations, such a rounded-square FS is also bigger than a circular hole FS21 . The observed inversion of the xz, yz bands is consistent with the ARPES result of Co-Ba12219 and the LDA+DMFT calculation for KFe2 As2 20 . In the dHvA study, the size of the hole FSs are found to be smaller than those predicted by band-structure calculations2 . We have determined the cross-sectional area of the FSs as listed in Table I together with those of the dHvA measurements and the band-structure calculation. The cross-sectional areas for the α and ζ FSs observed by ARPES are close to those obtained by the dHvA result and are smaller than the band-structure calculation. On the other hand, the area of the β and ǫ FSs determined by ARPES are much larger than the calculation results. The total hole count from the observed FSs yields the hole FS volume of 61 % of the BZ, indicating a deviation from the value of 50% expected from the chemical composition, because most of the FSs observed by ARPES are nearly 10-20 % larger than those observed by dHvA. The deviation of the FS volume implies that
area ARPES dHvA Γ 9.1 8.2 Z 9.8 8.6 Γ 12.2 10.3 15.7 Z 17.0 Γ 27.3 Z 30.0 0.86 Γ 2.1 Z 1.29
LDA 20.8 21.6 12.2 13.8 16.7 17.4 0.11 0.36
ARPES 5.1 (2.0) 6.6 (2.3) 11.0 (7.9) 9.6 (4.0) 16.3 (6.3) 17.9 (6.9) 5.6 (18.7)
m∗ /me (m∗ /mb ) dHvA 6.0 (2.3) 6.5 (2.2) 8.5 (6.1) 18 (7.5)
6.0 (20) 7.2 (24)
LDA 2.6 2.9 1.4 2.4 2.6 2.6 0.3 0.3
The effective masses determined by ARPES are compared with those derived from the dHvA measurements and the band-structure calculation in Table I. For the α and ζ FSs, the effective mass ratio m∗ /me , where me is the free electron mass, determined by ARPES is in good agreement with those obtained by dHvA, except for the kz = Z data for the ζ FS. These values give mass enhancement factor, m∗ /mb of ∼3-4, where mb is a band mass. As for the β FS, m∗ /me , ∼16-18, corresponding to m∗ /mb ∼6 is much larger than other FSs. This strong mass enhancement for the β band is partly due to the fact that the band bottom is closer to the Fermi level than that of the calculation. Another origin of the enhancement is electron correlation due to the xy orbital character. According to the LDA+DMFT calculation20 , a larger mass renormalization is expected in the xy band than those of the yz/xz bands. Thus, the observed mass enhancement factors indicate moderate to strong electron correlation. From the effective masses m∗ listed in Table I, the electronic specific heat coefficient γ is calculated to be γ ∼84 mJ/mol K2 , which is close to γ= 70 mJ/mol K2 estimated from specific heat measurements12 . Since in 2D material γ is proportional to the sum of the m∗ ’s of all the FSs, the β band has a large contribution to the enhancement of γ. The penetration depth10 and thermal conductivity11 measurements of KFe2 As2 suggest that line nodes exist in the superconducting gap. Because the small hole FSs around the zone corner are too small to account for the linear temperature dependence of the superfluid density, the node should be on the zone-centered hole FSs. According to spin-fluctuation mediated pairing mechanism, s-wave and d-wave pairings are found to be in close competition in KFe2 As2 22 and they might show crossover
5 with doping23 . For the s-wave pairing, there are two possibilities: horizontal nodes exist on the xz/yz/z 2 FS or the gap is small the entire xy FS22 . In the present results, the β hole FS which has xy orbital character is much larger than that predicted by LDA. This implies that, if s± paring is realized, the β FS lays close to the nodal line of the s± wave order parameter, resulting in a small superconducting gap or nodes.
IV.
CONCLUSION
We have studied FSs of KFe2 As2 in three-dimensional momentum space by ARPES. All FSs except for the surface states are qualitatively consistent with the band-structure calculation. Particularly, some threedimensionality in the ζ FS has been identified. The sizes of the FSs nearly accord with the dHvA observation: the α and ζ FSs are smaller than those in the band-structure calculation while the β and ǫ FSs are larger, which may be attributed to orbital-dependent electron-electron correlation effects. ACKNOWLEDGMENT
Alternatively, horizontal nodes may be realized in the strongly warped region of the FS around the Z point, where a significant amount of 3z 2 -r2 character is hybridized22,24,25 . The small-angle neutron scattering measurement on KFe2 As2 has suggested the existence of a horizontal node26 . If this is the case, the threedimensionality of the ζ FS revealed by the present work may favor a horizontal node. In order to make a conclusive remark on the line nodes, ARPES measurement of the superconducting gap with higher energy resolution is necessary in future studies.
1
2
3
4
5
6
7
8
9
H. Ding, P. Richard, K. Nakayama, K. Sugawara, T. Arakane, Y. Sekiba, A. Takayama, S. Souma, T. Sato, T. Takahashi, Z. Wang, X. Dai, Z. Fang, G. F. Chen, J. L. Luo, , and N. L. Wang, Europhys. Lett. 83, 47001 (2008). T. Terashima, M. Kimata, H. Satsukawa, A. Harada, K. Hazama, S. Uji, H. Harima, G. F. Chen, J. L. Luo, and N. L. Wang, J. Phys. Soc. Jpn. 78, 063702 (2009). K. Hashimoto, M. Yamashita, S. Kasahara, Y. Senshu, N. Nakata, S. Tonegawa, K. Ikada, A. Serafin, A. Carrington, T. Terashima, H. Ikeda, T. Shibauchi, and Y. Matsuda, Phys. Rev. B 81, 220501 (2010). J.-P. Reid, M. A. Tanatar, X. G. Luo, H. Shakeripour, N. Doiron-Leyraud, N. Ni, S. L. Bud’ko, P. C. Canfield, R. Prozorov, and L. Taillefer, Phys. Rev. B 82, 064501 (2010). K. Kuroki, H. Usui, S. Onari, R. Arita, and H. Aoki, Phys. Rev. B 79, 224511 (2009). H. Ikeda, R. Arita, and J. Kuneˇs, Phys. Rev. B 81, 054502 (2010). T. Yoshida, I. Nishi, S. Ideta, A. Fujimori, M. Kubota, K. Ono, S. Kasahara, T. Shibauchi, T. Terashima, Y. Matsuda, H. Ikeda, and R. Arita, Phys. Rev. Lett. 106, 117001 (2011). W. Malaeb, T. Yoshida, A. Fujimori, M. Kubota, K. Ono, K. Kihou, P. M. Shirage, H. Kito, A. Iyo, H. Eisaki, Y. Nakajima, T. Tamegai, , and R. Arita, J. Phys. Soc. Jpn. 78, 123706 (2009). P. Vilmercati, A. Fedorov, I. Vobornik, U. Manju, G. Panaccione, A. Goldoni, A. S. Sefat, M. A. McGuire, B. C. Sales, R. Jin, D. Mandrus, D. J. Singh, , and N. Man-
We are grateful to K. Kuroki, R. Arita, H. Fukazawa, T. Terashima and M. Kimata for enlightening discussions. Thanks are also due to K. Haule for showing us the result of LDA-DMFT calculations prior to publication. This work was supported by the Japan-China-Korea A3 Foresight Program and a Grant-in-Aid for Young Scientist (B) (22740221) from the Japan Society for the Promotion of Science. SSRL is operated by the US DOE Office of Basic Energy Science Divisions of Chemical Sciences and Material Sciences.
10
11
12
13
14
15
16
17 18
nella, Phys. Rev. B 79, 220503 (2009). K. Hashimoto, A. Serafin, S. Tonegawa, R. Katsumata, R. Okazaki, T. Saito, H. Fukazawa, Y. Kohori, K. Kihou, C. H. Lee, A. Iyo, H. Eisaki, H. Ikeda, Y. Matsuda, A. Carrington, and T. Shibauchi, Phys. Rev. B 82, 014526 (2010). J. K. Dong, S. Y. Zhou, T. Y. Guan, H. Zhang, Y. F. Dai, X. Qiu, X. F. Wang, Y. He, X. H. Chen, and S. Y. Li, Phys. Rev. Lett. 104, 087005 (2010). H. Fukazawa, Y. Yamada, K. Kondo, T. Saito, Y. Kohori, K. Kuga, Y. Matsumoto, S. Nakatsuji, H. Kito, P. M. Shirage, K. Kihou, N. Takeshita, C. H. Lee, A. Iyo, , and H. Eisaki, J. Phys. Soc. Jpn. 78, 083712 (2009). T. Sato, K. Nakayama, Y. Sekiba, P. Richard, Y.-M. Xu, S. Souma, T. Takahashi, G. F. Chen, J. L. Luo, N. L. Wang, , and H. Ding, Phys. Rev. Lett. 103, 047002 (2009). T. Terashima, M. Kimata, N. Kurita, H. Satsukawa, A. Harada, K. Hazama, M. Imai, A. Sato, K. Kihou, C. H. Lee, H. Kito, H. Eisaki, A. Iyo, T. Saito, H. Fukazawa, Y. Kohori, H. Harima, , and S. Uji, J. Phys. Soc. Jpn. 79, 053702 (2010). A. Yanase, FORTRAN Program for Space Group, 1st ed.,(Shokabo, Tokyo, 1985) [in Japanese].. S. Rozsa and H. U. Schuster, Z. Naturforsch. B 36, 1668 (1981). D. J. Singh, Phys. Rev. B 78, 094511 (2008). Y. Zhang, L. X. Yang, F. Chen, B. Zhou, X. F. Wang, X. H. Chen, M. Arita, K. Shimada, H. Namatame, M. Taniguchi, J. P. Hu, B. P. Xie, and D. L. Feng, Phys. Rev. Lett. 105, 117003 (2010).
6 19
20
21
Y. Zhang, F. Chen, C. He, B. Zhou, B. P. Xie, C. Fang, W. F. Tsai, X. H. Chen, H. Hayashi, J. Jiang, H. Iwasawa, K. Shimada, H. Namatame, M. Taniguchi, J. P. Hu, and D. L. Feng, Phys. Rev. B 83, 054510 (2011). Z. P. Yin, K. Haule, and G. Kotliar, Nature Materials 10, 932 (2011). M. Kimata, T. Terashima, N. Kurita, H. Satsukawa, A. Harada, K. Kodama, A. Sato, M. Imai, K. Kihou, C. H. Lee, H. Kito, H. Eisaki, A. Iyo, T. Saito, H. Fukazawa, Y. Kohori, H. Harima, and S. Uji, Phys. Rev. Lett. 105, 246403 (2010).
22
23
24
25
26
K. Suzuki, H. Usui, and K. Kuroki, Phys. Rev. B 84, 144514 (2011). R. Thomale, C. Platt, W. Hanke, J. Hu, and B. A. Bernevig, Phys. Rev. Lett. 107, 117001 (2011). S. Graser, A. F. Kemper, T. A. Maier, H.-P. Cheng, P. J. Hirschfeld, and D. J. Scalapino, Phys. Rev. B 81, 214503 (2010). K. Suzuki, H. Usui, and K. Kuroki, J. Phys. Soc. Jpn. 80, 013710 (2011). H. Kawano-Furukawa, C. J. Bowell, J. S. White, R. W. Heslop, A. S. Cameron, E. M. Forgan, K. Kihou, C. H. Lee, A. Iyo, H. Eisaki, T. Saito, H. Fukazawa, Y. Kohori, R. Cubitt, C. D. Dewhurst, J. L. Gavilano, and M. Zolliker, Phys. Rev. B 84, 024507 (2011).