University of Nebraska Omaha
DigitalCommons@UNO Physics Faculty Publications
Department of Physics
1-1-2001
Order-Disorder Phase Transitions in KNO2 , CsNO2, and TlNO2 crystals: A Molecular Dynamics Study Chun-Gang Duan University of Nebraska at Omaha,
[email protected]
Wai-Ning Mei University of Nebraska at Omaha,
[email protected]
Robert W. Smith University of Nebraska at Omaha,
[email protected]
Jianjun Liu University of Nebraska-Lincoln,
[email protected]
M. M. Ossowski University of Nebraska-Lincoln See next page for additional authors
Follow this and additional works at: http://digitalcommons.unomaha.edu/physicsfacpub Part of the Chemistry Commons, and the Physics Commons Recommended Citation Duan, Chun-Gang; Mei, Wai-Ning; Smith, Robert W.; Liu, Jianjun; Ossowski, M. M.; and Hardy, John R., "Order-Disorder Phase Transitions in KNO2 , CsNO2, and TlNO2 crystals: A Molecular Dynamics Study" (2001). Physics Faculty Publications. Paper 15. http://digitalcommons.unomaha.edu/physicsfacpub/15
This Article is brought to you for free and open access by the Department of Physics at DigitalCommons@UNO. It has been accepted for inclusion in Physics Faculty Publications by an authorized administrator of DigitalCommons@UNO. For more information, please contact
[email protected].
Authors
Chun-Gang Duan, Wai-Ning Mei, Robert W. Smith, Jianjun Liu, M. M. Ossowski, and John R. Hardy
This article is available at DigitalCommons@UNO: http://digitalcommons.unomaha.edu/physicsfacpub/15
University of Nebraska Omaha
DigitalCommons@UNO Physics Faculty Publications and Presentations
Department of Physics
1-1-2001
Order-Disorder Phase Transitions in KNO2, CsNO2, and TlNO2 Chun-gang Duan W. N. Mei R. W. Smith Jianjun Liu M. M. Ossowski See next page for additional authors
This Article is brought to you for free and open access by the Department of Physics at DigitalCommons@UNO. It has been accepted for inclusion in Physics Faculty Publications and Presentations by an authorized administrator of DigitalCommons@UNO. For more information, please contact
[email protected].
Authors
Chun-gang Duan, W. N. Mei, R. W. Smith, Jianjun Liu, M. M. Ossowski, and John R. Hardy
PHYSICAL REVIEW B, VOLUME 63, 144105
Order-disorder phase transitions in KNO2 , CsNO2 , and TlNO2 crystals: A molecular dynamics study Chun-gang Duan* and W. N. Mei Department of Physics, University of Nebraska-Omaha, Nebraska 68182-0266
R. W. Smith Department of Chemistry, University of Nebraska-Omaha, Nebraska 68182-0109
Jianjun Liu, M. M. Ossowski, and J. R. Hardy Department of Physics and Center for Electro-optics, University of Nebraska-Lincoln, Nebraska 68588-0111 共Received 5 January 2000; revised manuscript received 14 November 2000; published 16 March 2001兲 The order-disorder phase transitions of KNO2 , CsNO2 , and TlNO2 have been studied using parameter-free molecular dynamics simulation. It is found that the phase transitions in nitrites investigated are driven by the rotations of the NO2 ⫺ ions about different axes together with displacements of cations and anions. We successfully reproduce the high-temperature phases of these nitrites, i.e., the NaCl-like structure for KNO2 and CsCl-like structure for Cs(Tl)NO2 . Based on the investigation of the radial distribution function of the cations and anions, we explain why KNO2 and Cs(Tl)NO2 form quite different low-temperature phases. DOI: 10.1103/PhysRevB.63.144105
PACS number共s兲: 64.60.Cn, 61.43.Bn, 64.70.Pf
I. INTRODUCTION
The high-temperature phase of potassium nitrite and the room-temperature phases of cesium and thallium nitrite are known as plastic crystals because they are mechanically soft. This special property is believed to be associated with the disordered orientations of the NO2 ⫺ anions in the lattice. Experimental studies on these nitrites have been carried out extensively by a variety of techniques.1–7 KNO2 in phase I (T⬎315 K兲 has NaCl structure, with spherically disordered orientations of the NO2 ⫺ ions. At lower temperature (264 K ⬍T⬍315 K兲, in phase II, the ¯ m) with orientastructure is rhombohedral 共space group R3 ⫺ tions of NO2 ions disordered about the rhombohedral ¯3 axis. In phase III (T⬍264 K兲, it has a monoclinic structure 共space group P2 1 /c) with ordered NO2 ⫺ ions.5 CsNO2 and TlNO2 both have CsCl-type structures in their room-temperature phase, phase I, in which the NO2 ⫺ ions are likely to be in free rotation as in phase I of KNO2 . They undergo phase transitions at 209.2 and 282.4 K, respectively, to phase II, which has a trigonal structure with space group P3 1 21. 7 Recently, neutron powder diffraction studies on, KNO2 by Onoda-Yamamuro et al.,5 and on CsNO2 and TlNO2 by Feyerherm, Collins, and Johari,7 have thrown new light on the low-temperature phases of these crystals. Specifically, it was found that, at very low temperature, the NO2 ⫺ ions in these three nitrites are highly ordered, but there exists a small but distinct development of the orientational disorder of the NO2 ⫺ ions with increasing temperature. This can be associated, at least for CsNO2 and TlNO2 , with glasslike behaviors in specific-heat and dielectric relaxation measurements.3,4,6 The nature of the phase-transition mechanism is still an open question. It is very interesting to carry out a theoretical study to clarify the mechanism governing the order-disorder phase transitions and the behavior of the NO2 ⫺ ions in the 0163-1829/2001/63共14兲/144105共6兲/$20.00
low-temperature phase of these nitrites. Molecular dynamics 共MD兲 simulation provides a direct way to answer such questions. One can obtain a great deal of information about the thermal and microscopic behaviors of the ions in the crystal by MD simulation. Specifically, in the past, we successfully simulated the structural phase transition in NaNO2 . 8 In this paper we report the results of simulations on KNO2 , CsNO2 , and TlNO2 using the same technique. Here we focus on the behavior of nitrite ions before and after phase transitions. II. POTENTIAL-ENERGY SURFACE AND STATIC RELAXATION
Our MD simulation technique was developed by Lu and Hardy to study phase transitions in ionic molecular crystals.9 This method originates from the Gordon-Kim model for ionic crystal 共e.g., alkali halides兲.10 It was extended to deal with ionic molecular crystals like K2 SeO4 , in which strong intermolecular covalency exists. The main idea is that in ionic molecular crystal the molecular ion (SeO4 ⫺2 in K2 SeO4 ) is treated as a single entity, and intramolecular and intermolecular interactions are considered separately. First we perform ab initio quantum-chemistry calculations for the whole molecular ion, to obtain the optimized structure and the electron charge densities of each individual atom in the molecular ion. Then the intermolecular interactions are calculated from the resultant charge densities together with those of the cation by using the Gordon-Kim electron-gas model, while the intramolecular interactions are described by an ab initio harmonic expansion of the energy of the molecular ion. This method provides a parameter-free description for the crystal potential-energy surfaces which allow structural relaxation, MD simulation, and lattice dynamics calculations. In this work, we used the GAUSSIAN 94 program package11 to perform ab initio quantum-chemistry structural optimization for the nitrite ion. Consistent with earlier work on
63 144105-1
©2001 The American Physical Society
DUAN, MEI, SMITH, LIU, OSSOWSKI, AND HARDY
PHYSICAL REVIEW B 63 144105
TABLE I. Experimental and theoretical structural parameters for the NO2 ⫺ . Theoretical values are obtained from using GAUSSIAN 94 package.
KNO2 CsNO2 TlNO2 Theory
N-O distance 共Å兲
O-N-O angle
1.250 共N-O1兲 1.256 共N-O2兲 1.23 1.25 1.23
116.9° 114.8° 113.8° 116.6°
NaNO2 , we used the double-zeta basis for the nitrogen and oxygen atoms to obtain the optimized structure of the nitrite ion. The parameters of the optimized structure, together with the experimental values, are listed in Table I . The Mulliken population analysis of the ab initio charge density gives charges of 0.16256e and ⫺0.58128e for N and O atoms, respectively. These charges, together with cationic charges of ⫹1e, were used to calculate the long-range Coulomb interactions. In the calculation of the Gordon-Kim pair potentials, the free ion charge density for K⫹ was taken from Ref. 12, and those for Cs⫹ and Tl⫹ from Ref. 13. We then used the potentials obtained above to perform static relaxations with crystal structure symmetry constraints. The relaxation started from experimental structures, and periodic boundary conditions and a Newton-Raphson algorithm were used. These relaxations provide crystal structures in which the forces on the ions and the stresses are zero. The parameters of relaxed structure along with the experimental values are listed in Table II. The relaxed structure of KNO2 with space group P2 1 /c constraints is not in good agreement with experiments. However, if the monoclinic angle  was kept constant at the experimental value during relaxation, the final structure, which is listed in Table II under the column TABLE II. Experimental and theoretical structural parameters for the P2 1 c phase of KNO2 . 共Lattices constants are given in Å.兲 Parameters
Experiment
Theory
Theory 共fix  )
a b c  x/a of N y/b of N z/c of N x/a of K y/b of K z/c of K x/a of O共1兲 y/b of O共1兲 z/c of O共1兲 x/a of O共2兲 y/b of O共2兲 z/c of O共2兲
4.4010 9.5967 6.9817 108.274° ⫺0.0732 0.4107 0.1839 0.4105 0.1407 0.2101 0.2034 0.4127 0.3067 ⫺0.1615 0.2999 0.0865
4.0418 7.7796 8.1876 119.580° ⫺0.1130 0.4462 0.1370 0.4278 0.1619 0.1778 0.0575 0.4204 0.3075 ⫺0.2120 0.3168 0.0380
4.2184 8.1846 6.9715 108.274° 0.0018 0.3869 0.1399 0.3783 0.1112 0.2201 0.1497 0.4115 0.3200 ⫺0.2822 0.3316 0.1009
‘‘Theory 共fix  ),’’ is close to the experiment except for a contraction of the lattice parameters of ⬃5%. The agreements between theoretical and experimental structures of CsNO2 and TlNO2 are much better, with the lattice parameters 8% shorter than the experimental values. This is a general feature of simulations using Gordon-Kim potentials.9 The discrepancies between the theoretical and experimental values of the structural parameters for KNO2 , CsNO2 , and TlNO2 are larger than those for NaNO2 . 8 We attribute this to the large number of variables and thus more complex potential surfaces of the nitrites investigated here. This allows more possibilities for locally metastable states than is the case for the NaNO2 Im2m structure. In particular, for KNO2 , the major discrepancies are probably due to relatively large rotations of the NO2 ⫺ , inducing compensatory changes in  to produce only a small change in the overall energy. However, since our main goal focuses on the nature of the order-disorder phase transitions in these nitrites, we consider the agreements between theory and experiment adequate to proceed with the MD simulation study. III. MD SIMULATIONS OF THE PHASE TRANSITIONS
We performed constant 共zero兲 pressure MD calculations14 to simulate the temperature-dependent behaviors of these nitrites. During the simulation, both the atomic positions and the lattice vectors were allowed to change. Periodic boundary conditions were imposed to provide an infinite-size lattice. Supercells were chosen large enough to permit all possible phase transitions to occur. The systems were heated and cooled both in 20-K step. At each stage the averages of the atomic positions, internal energy, etc., were taken over a period of 30 ps using a 0.003-ps MD time step. A. KNO2
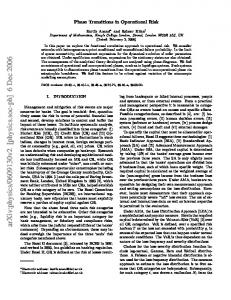
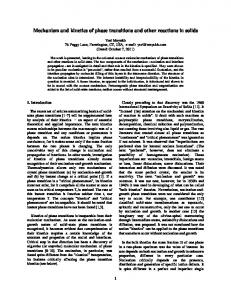
We used a supercell with 432 ions formed by tripling the P2 1 /c cell in all three directions. The simulation was started from the relaxed structure obtained by fixing the monoclinic  angle to experimental value and the sample was heated up to 600 K. Figure 1 presents the specific heat C p as a function of temperature obtained from our simulation. As can be seen from the figure, there is one sharp peak at nearly 380 K, which indicates the occurrence of one phase transition. This peak is about 60 K higher than the experimental phase II-I transition temperature, 315 K. We also found a small but noticeable shoulder at around 340 K, which we attribute to be an indication of another phase transition. The temperature difference 共40 K兲 of the two theoretical phase transitions is close to the experimentally observed value of 50 K. To study the mechanism of these phase transitions, the average crystal structures of KNO2 at several different temperatures are monitored and depicted in Fig. 2. The ellipsoids in these figures represent the rms deviations of the atoms from their average positions, and thus indicate the thermal motions of these atoms. For clarity, only one certain layer of atoms is shown. At a low temperature 共about 120 K兲, we observed that some nitrite ions flip around an axis parallel to the O-O bond in the nitrite. As the temperature increases,
144105-2
ORDER-DISORDER PHASE TRANSITIONS IN KNO2 , . . .
PHYSICAL REVIEW B 63 144105
FIG. 1. Temperature variation of the specific heat C p of KNO2 obtained from molecular dynamics simulation heating and cooling processes.
both phase transitions occur when the nitrite ions begin to rotate about a new axis. The orientations of the nitrite ions are completely disordered after 380 K, and the system becomes a sodium chloride structure. Starting from a heated disordered structure at about 460 K, we also performed a MD cooling process for KNO2 . On the specific-heat curve 共indicated as ‘‘Cooling’’ in Fig. 1兲 we also find two peaks in the temperature range 260–360 K. Again, average structure studies reveal that they are associated with the freezing of different kinds of rotational motions.
FIG. 2. Atomic positions of KNO2 viewed from the a direction at 共a兲 T⫽118 K, 共b兲 T⫽136 K, 共c兲 T⫽347 K, and 共d兲 T⫽384 K.
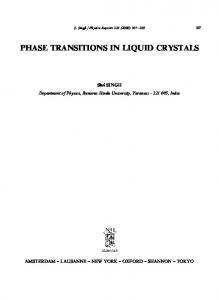
FIG. 3. K-N radial distribution function at 共a兲 20 K, 共b兲 321 K, 共c兲 347 K, and 共d兲 500 K.
Now it is interesting to make clear the structure of the intermediate phase, and the structural relationship between each phase. To do this, we plot the radial distribution function g(r) of the K and N atoms at several different temperatures in Fig. 3. The average structures at these temperatures are obtained from the heating run. It can be seen from these figures that there is no significant structure change from 321 to 347 K. Thus, in our simulation, this phase transition is mainly caused by the occurrence of a new mode of rotation of nitrite ions. The three sharp peaks appeared in panel 共d兲 of Fig. 3 indicate clearly that the high-temperature phase of KNO2 is a NaCl-like phase. The relative ratios of these peak positions agree very well with those of a NaCl structure. A noticeable structure change also can be found from low temperature to the first phase transition temperature. However, the integration over the region from 2.5 to 4.1 Å remains at 6, which is the correct number of the nearest-neighboring N atoms of K atom in a NaCl-like structure. This indicates that, when cooling from a high-temperature cubic structure, the K atom’s neighboring N atoms remain almost unchanged. We find that the monoclinic phase III is a distorted structure of rhombohedral phase II. Both K and N atom form a distorted face-centered lattice. As the temperature increases, the nitrite ions become orientationally disordered, and in at the same time the K and N atoms make some translations to form a ideal rhombohedral face-centered lattice at the first
144105-3
DUAN, MEI, SMITH, LIU, OSSOWSKI, AND HARDY
PHYSICAL REVIEW B 63 144105
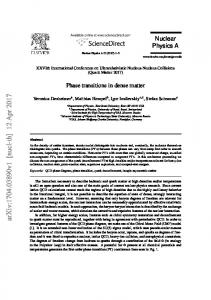
FIG. 4. Temperature variation of the specific heat C p of CsNO2 obtained from molecular dynamics simulation heating and cooling processes.
phase transition. However, the translations of the K⫹ and NO2 ⫺ ions are somewhat delicate. Thus an exact reproduction of the phase III-II transition seems go beyond the time scales accessible to our MD simulations. On the other hand, the rhombohedral lattice of phase II can be described as a distorted NaCl structure. The distortion is due to dilation along one of the four cubic diagonals of the NaCl structure. When the temperature becomes higher, the rotation of the nitrite ions became almost free. Thus, at the second phase transition, the rhombohedral structure contracts along its threefold axis to become NaCl structure.
FIG. 5. Cs-N radial distribution function at 共a兲 20 K, 共b兲 234 K, 共c兲 259 K, and 共d兲 500 K.
B. CsNO2 and TlNO2
Supercells with 324 ions of CsNO2 and TlNO2 were both constructed by tripling the P3 1 21 cell in all three directions. The samples were heated from a relaxed structure up to about 500 K. On the specific-heat curve obtained from the heating process for CsNO2 共Fig. 4兲, we find two distinct peaks at 240 and 340 K, which does not agree with experiments. However, based on the average structure analysis, we note that in our simulation, the phase transition from phase II to phase I is conducted in two steps. These correspond to two different kinds of rotations of NO2 ⫺ ions which begin from nearly 220 and 330 K, respectively. Apparently these two steps occur at the same time in the experiment. By studying the radial distribution functions of the Cs and N atoms at several different temperatures 共Fig. 5兲, we found that the first theoretical phase transition does not lead to any significant structural change. It is only caused by an of additional rotational mode taking place, i.e., the increase of the degree of disorder of nitrite ions. As can be seen from the figure, the features of these curves, in sharp contrast to those of KNO2 , almost remain unchanged throughout the entire MD simulation. The integration over the region from 3.0 to 4.5 Å remains nearly at 8, which is the correct number of the N-atoms that are nearest neighbors to the Cs atom in the CsCl-like structure.
FIG. 6. Atomic positions of CsNO2 viewed from the b direction at 共a兲 T⫽118 K, 共b兲 T⫽138 K, 共c兲 T⫽244 K, and 共d兲 T⫽350 K.
144105-4
ORDER-DISORDER PHASE TRANSITIONS IN KNO2 , . . .
PHYSICAL REVIEW B 63 144105 TABLE III. Experimental and theoretical structural parameters for the P3 1 21 phases of CsNO2 and TlNO2 . 共Lattices constants are given in Å.兲
FIG. 7. Temperature variation of the specific heat C p of TlNO2 obtained from molecular dynamics simulation heating and cooling processes.
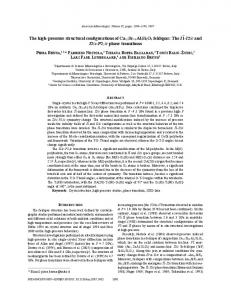
One can see from Fig. 6 that below 120 K the system remains a P3 1 21 structure. With an increase in the temperature, the NO2 ⫺ ions begin to flip around an axis parallel to the O-O bond in the nitrite. At about 240 K, another kind of rotation of NO2 ⫺ ions occurs indicating the onset of a phase transition. As the temperature reaches 340 K, the NO2 ⫺ ions rotate freely and the orientations of NO2 ions become completely disordered. Then the structure transforms to CsCltype structure with some displacement of Cs atoms. We also cooled the sample from disordered structures at about 380 K down to very low temperature. In that specific heat curve 共see Fig. 4兲 we find two peaks at 230 and 300 K, respectively. Both of these are lower than their counterparts in the heating run, but the average structure studies still show that they correspond to a freezing of the rotation of the nitrite anions. For TlNO2 , we note that the system was stable at an experimental melting temperature 465 K. We attribute this to the intrinsic limitation that our simulation was performed on a sample without free surfaces. As distinct from the case of CsNO2 , no two-peak structure is found in the specific-heat curves 共Fig. 7兲. In fact, the phase transition is rather ‘‘sluggish,’’ which begins at ⬃250 K and ends at ⬃360 K. At low temperature, the behaviors of the nitrite ions are almost the same as those of CsNO2 . Therefore, we observed the same kind of flipping motion of nitrite ions. Analogous to our understanding of the phase transition of CsNO2 , the broad phase transition of TlNO2 can be interpreted as a continuous unlocking 共or freezing when cooling兲 of the rotational degrees of freedom. As was the case for CsNO2 , the hightemperature phase is a CsCl-type cubic structure 共see Table III兲. The evolution of the average structures of CsNO2 and TlNO2 with temperature confirms the relationship between phases I and II proposed by Feyerherm et al.7 The Cs 共Tl兲 and N atoms form a distorted CsCl lattice in phase II. Starting from the trigonal structure of phase II, the Cs 共Tl兲 and N
Parameters
Experiment
Theory
CsNO2 a (⫽b) c x/a of N x/a of Cs x/a of O共1兲 y/b of O共1兲 z/c of O共1兲
5.8670 7.8304 0.3122 0.3053 0.3755 0.4768 0.6147
5.4348 7.8942 0.1964 0.4000 0.3567 0.2754 0.6229
TlNO2 a (⫽b) c x/a of N x/a of Tl x/a of O共1兲 y/b of O共1兲 z/c of O共1兲
5.5490 7.3233 0.3098 0.2973 0.3715 0.4940 0.6182
5.4022 7.9702 0.2349 0.3655 0.3570 0.3530 0.6309
atoms first are slightly displaced, to form a rhombohedral structure. Then the rhombohedral structure contracts along its threefold axis to become a CsCl structure. These two steps take place together at the phase transition. IV. DISCUSSIONS
Monovalent nitrites M NO2 共M⫽Na, K, Cs, Tl兲 have all been found to have ordered structures in their lowtemperature phases. These crystals, except NaNO2 , all crystallize into plastic phases at room temperature because of the orientational disorder of the nitrite ions. As presented in Sec. III, all the phase transitions in the nitrites investigated are related to the rotation of the nitrite ions, about different axes. One can argue that three possible rotations of the nitrite ion might produce three sequential phase transitions. The first kinds of rotation 共a兲 is about an axis in the plane of nitrite ions and parallel to the O-O axis. The other two kinds of rotations are about the twofold axis in the NO2 plane 共b兲 and about an axis perpendicular to the nitrite plane 共c兲. Using low-temperature experimental structures, we calculated the potential energies as a function of the angle of rotation of one of the nitrites in the unit cell in the above three modes. The rotational mode 共a兲 has a energy barrier 5–10 times smaller than those of the other two kinds of rotations. It is expected to be much easier to excite than the other two modes. Thus we observe this kind of motion at relatively low temperatures. Mode 共a兲 only slightly changes the total energy of the whole system, but it does produce an excess entropy and thus affects the thermal properties, e.g., the specific heat of the crystal. This kind of rotation may be the reason for the glass-transition-like behavior of these nitrites in the low-temperature phases. Feyerherm and co-workers7,15 found that at low temperature CsNO2 and
144105-5
DUAN, MEI, SMITH, LIU, OSSOWSKI, AND HARDY
PHYSICAL REVIEW B 63 144105
TlNO2 only have a small-angle orientational disorder and small-scale reorientational motions of the NO2 anions, and suggested that the NO2 ions liberate about an axis other than the C 2 v axis. The logical candidate is mode 共a兲, the libration of NO2 ions about an axis parallel to the O-O line. The other two kinds of rotations, namely, modes 共b兲 and 共c兲, have much higher energy barriers than that of mode 共a兲, and require more energy to excite them. Thus they occur at higher temperature. These two kinds of rotation are so drastic that they can result in a peak in the C p curve. The order-disorder phase transition in a molecular ion crystal often involves a displacements of cations. At high temperature, the molecular anions go into nearly free rotations and become effectively spherical. In a CsCl structure the cations have to be sufficiently large for the first neighbor. This simple cubic is inherently unstable and will shear into a fcc structure. This process will only be prevented if the cations’ radii exceed a threshold value such that the firstneighbor anion-cation repulsion is sufficient to keep the anions out of effective contact. Thus molecular crystals with smaller cations usually have a NaCl structure, e.g., RbNO3 and RbN3 , while those with larger cations form CsCl lattices, e.g., CsNO3 , TlNO3 , and CsN3 . Analogously, KNO2 has NaCl structures and CsNO2 and TlNO2 have CsCl structure at high temperature because of their different cation sizes. As the temperature decreases, the small K atom cases the coordination number to remain small, whereas large Cs and Tl atoms still need a larger coordination number. This
V. CONCLUSIONS
We have studied, for the first time at the microscopic level to our knowledge, the order-disorder phase transitions of KNO2 , CsNO2 , and TlNO2 by using a parameter-free MD simulation method. By studying the pair relationship of the cations and anions at different temperatures of these nitrites, we explained why these nitrites, though having the same anionic groups, have different low-temperature phases. We found that cations play a very important role in forming the structure of these crystals, i.e., the phase diagram can be very different because of the different sizes of the cations. In our simulations all the phase transitions occurring in these nitrite are driven mainly by different rotational motions of NO2 ⫺ anions. We also found that the glass-transition-like behavior of these nitrites is possibly caused by liberations of the nitrite ions around an axis parallel to the O-O bond. ACKNOWLEDGMENTS
We thank Professor M. F. Collins for sending us his recent publication. This work was supported by the U.S. Army Research Office under 共a兲 Grants No. DAAG 55-97-1-0106 and 共b兲 Grants No. DAAG 55-98-1-0273. The computer facility was supported by Nebraska-EPSCoR-NSF Grant No. EPS-9720643.
8
*Email:
[email protected]. J. K. Solbakk and K. O. Stro” mme, Acta Chem. Scand. 23, 300 共1969兲; K. O. Stro” mme, Z. Anorg. Allg. Chem. 403, 176 共1974兲. 2 Carl W. F. T. Pistorius and P. W. Richter, Z. Anorg. Allg. Chem. 389, 315 共1972兲. 3 S. C. Mraw, R. J. Boak, and L. A. K. Staveley, J. Chem. Thermodyn. 10, 359 共1978兲. 4 K. Moriya, T. Matsuo, and H. Suga, J. Phys. Chem. Solids 44, 1103 共1983兲. 5 N. Onoda-Yamamuro et al., J. Phys.: Condens. Matter 10, 3341 共1998兲. 6 H. Honda et al., Ber. Bunsenges. Phys. Chem. 102, 148 共1998兲. 7 R. Feyerherm, M. F. Collins, and G. P. Johari, Phys. Rev. B 57, 11 125 共1998兲. 1
can explain why KNO2 has a different low-temperature structure from that of CsNO2 and TlNO2 .
H. M. Lu, R. Qi, and J. R. Hardy, Solid State Commun. 87, 1151 共1993兲. 9 H. M. Lu and J. R. Hardy, Phys. Rev. Lett. 64, 661 共1990兲; Phys. Rev. B 42, 8339 共1990兲. 10 R. G. Gordon and Y. S. Kim, J. Chem. Phys. 56, 3122 共1972兲. 11 M. J. Frisch et al., Gaussian 94 User’s Reference 共Gaussian, Inc., 1994兲. 12 E. Clementi and C. Roetti, At. Data Nucl. Data Tables 14, 177 共1974兲. 13 A. D. McLean and R. S. McLean, At. Data Nucl. Data Tables 26, 197 共1981兲. 14 M. Parrinello and A. Rahman, Phys. Rev. Lett. 45, 1196 共1980兲. 15 G. P. Johari, M. F. Collins, and R. Feyerherm, Phys. Rev. B 61, 5827 共2000兲.
144105-6