Dec 10, 2010 - Van Winkle and Murray3 investigated shortly afterward a closely related system with up to seven layers and reported about similar but not ...
THE JOURNAL OF CHEMICAL PHYSICS 133, 224504 (2010)
Ordered equilibrium structures of soft particles in thin layers Mario Kahn,1 Jean-Jacques Weis,2 and Gerhard Kahl1 1 Institut für Theoretische Physik and Center for Computational Materials Science (CMS), Technische Universität Wien, Wiedner Hauptstraße 8-10, A-1040 Wien, Austria 2 Laboratoire de Physique Théorique UMR8627, Université Paris-Sud, F-91405 Orsay, France
(Received 9 April 2010; accepted 8 October 2010; published online 10 December 2010) Considering a system of Gaussian particles confined between two hard, parallel plates, we investigate at T = 0, ordered equilibrium configurations that the system forms as the distance D between the plates gradually increases. Using a very sensitive and reliable optimization technique that is based on ideas of genetic algorithms, we are able to identify the emerging sequences of the energetically most favorable structures. Although the resulting phase diagram is rather complex, its essential features can be reduced to the discussion of two archetypes of structural transitions: (i) a continuous transformation at a fixed number of layers, leading from a square to a centered rectangular and then to a hexagonal lattice; (ii) a discontinuous transition, transforming a hexagonal to a square lattice via complex intermediate structures, i.e., the so-called buckling transition, which is encountered as the system forms a new layer. Detailed Monte Carlo simulations are able to confirm the theoretical predictions on a semiquantitative level but are not able to grasp the tiny energetic differences between competing structures. © 2010 American Institute of Physics. [doi:10.1063/1.3509380] I. INTRODUCTION
How does a three-dimensional crystal grow out of two-dimensional lattice? It was probably Pieranski and coworkers1 who carried out the first experiments to elucidate this fundamental question. In their experimental setup, the authors confined polysterene particles between two parallel hard plates, separated by a vertical distance D. By gradually increasing D, the authors were thus able to investigate in a systematic way the layer-by-layer growth of the system. This study revealed that the system forms with increasing D layered structures with alternating square (�) and hexagonal(�) in-layer structures. The observed structural transitions could thus formally be written as 1�→2�→2�→3�→. . . , where the integer represents in this formalism the number of layers, n l , that the system forms. In an effort to understand in particular the process where the system forms a new layer, authors from the same group put forward in a subsequent contribution a theoretical model:2 based on a simple hard sphere picture, the ordered structures that the system forms were identified as those particle arrangements where the volume density is maximized. In their approach the authors described for the first time the buckling transition that leads from a hexagonal lattice in a system with n l layers to a square lattice in a system with (n l + 1) layers. Van Winkle and Murray3 investigated shortly afterward a closely related system with up to seven layers and reported about similar but not identical structures as the ones identified by Pieranski et al.1 A few years later, more systematic investigations were carried out by Neser et al.,4 taking benefit of the advent of refined experimental methods: the authors provided very detailed information about the complexity of structural sequences occurring at the buckling transition. In more recent experiments,5–9 the occurrence of buckling, rhombic, prism, or so-called hcp-perpendicular phases has been reported, as well as the identification of the complex, so-called S1 and S2 phases. 0021-9606/2010/133(22)/224504/12/$30.00
Chou and Nelson10 were probably the first ones to study the layer-by-layer growth of a three-dimensional crystal with theoretical tools. Motivated by the work of Van Winkle and Murray3 the authors developed a free energy functional in order to study in confined colloidal systems the stability of the buckling transition as the system transforms from a single layer to a double layer arrangement. Several years later, Schmidt and Löwen11, 12 carried out extensive Monte Carlo (MC) simulations and developed a free volume theory to study the formation of ordered structures in systems between two and three dimensions. Zangi and Rice13 investigated with extensive molecular dynamics simulations the solid-to-solid transition in two- to six-layer colloidal systems, dedicating particular effort to the buckling transition. Further theoretical investigations were carried out by Bock et al.,14 introducing a zero-temperature density functional to investigate the ordered structures formed by Lennard-Jones particles, confined between two model graphite sheets. Recent MC simulations of hard spheres confined between two parallel hard plates have been performed by Fortini and Dijkstra.15 Despite all these remarkable efforts to elucidate this complex process from different points of view and using a broad variety of different tools, a full understanding of this complex structural change is still missing. While there is unanimous agreement on the details of the transition nl �→nl �, the results about the structural details of the transition nl �→(nl + 1)� are not fully consistent (cf. Table 1 of Ref. 15). The aim of the present contribution is to reconsider the problem with an entirely different approach. Since particles arrange at any stage of the growth process in such a way that the related thermodynamic potential is minimized, these ordered configurations can be obtained with the help of suitable optimization tools. Our approach therefore requires (i) a highly accurate evaluation of the thermodynamic properties and (ii) a reliable optimization technique. In an effort to make
133, 224504-1
© 2010 American Institute of Physics
Author complimentary copy. Redistribution subject to AIP license or copyright, see http://jcp.aip.org/jcp/copyright.jsp
224504-2
Kahn, Weis, and Kahl
the evaluation of the thermodynamic properties as accurate as possible we restrict ourselves to zero temperature, where the thermodynamic potentials reduce essentially to the lattice sum, U . While the walls are simply introduced for confining the system, we assume a Gaussian potential between the particles. On one side, this interaction represents a reasonable model potential for ultrasoft colloids; on the other hand, its rapid decay with distance guarantees that the evaluation of the lattice sum can be achieved within machine precision. The ordered equilibrium particle arrangements are identified via an optimization strategy that is based on ideas of genetic algorithms (GAs). Meanwhile numerous applications of GAs in soft matter systems have given evidence that this approach is indeed a reliable, efficient, and numerically robust tool that copes well both with high dimensional search spaces as well as with rugged energy landscapes.16–34 We also point out that a preliminary account on the problem addressed in this contribution has already been presented in Ref. 35. Our theoretical investigations are complemented by MC simulations. In an effort to be as “close” as possible to the theoretical description, the simulations have been performed at very low temperature. By assuming different initial conditions and by using adaptive cell geometries we have avoided any possible bias of the results by the initial conditions. The conclusions that we can draw from our investigations are the following: structural transitions between states that have the same number of layers can be described on a numerically high level of agreement by our two complementary approaches. For the buckling transition, on the other hand, computer simulations confirm on a semiquantitative level the theoretical predictions for averaged observables, such as the orientational bond order parameter or the (inlayer) pair distribution function (PDF), that characterize the emerging structures. However, we are not able to identify the complex structural sequences themselves that occur during the transition from the simulation data. A closer investigation of the theoretical data provides an explication why simulations are not able to provide such information about the buckling transition: this structural change is characterized by a sequence of complex structures where competing lattices are characterized by minute energy differences. In addition, the buckling transitions occur in narrower parameter intervals and the emerging structures become more complex as n l increases; thus, even our essentially exact theoretical approach faces enormous difficulties to identify the ordered equilibrium structures for n l � 4. Computer simulations of limited size, limited simulation length, and finite temperature are not able to grasp these tiny energy differences. With this in mind, it becomes better understandable why sometimes inconsistent results for the buckling transition are obtained from theoretical, experimental approaches and simulations. The paper is organized as follows: in Sec. IIwe present the underlying model for the layered system in terms of the particle interaction and the parameterization of the geometry. In Sec. III we briefly present our theoretical approach (referring for more extensive presentation to previous work) and provide details of our MC simulations. Results are discussed in Sec. IV and we close the paper with concluding remarks.
J. Chem. Phys. 133, 224504 (2010)
II. THE SYSTEM A. The interaction
The particles of our system interact via a Gaussian potential, i.e., �(r ) = � exp[−(r/σ )2 ],
(1)
where � and σ represent energy- and length-scales. Furthermore, the system is characterized by its volume number density, ρ. The choice for this particular functional form of the potential can be justified both from a physical as well as from a computational point of view. (i) The Gaussian potential,36 representing one of the standard models in soft condensed matter physics, can be viewed as an ultrasoft, effective interaction between soft particles. It is well known in literature as a reasonable model potential for polymers,37 dendrimers,38, 39 or microgels.40 In addition, detailed knowledge about its full bulk phase diagram is available in literature.41, 42 Of particular relevance for the work presented here is the fact that the system solidifies at very low temperatures in an fcc lattice for ρσ 3 � 0.1794, while the system is expected to form a bcc phase for 0.1798 � ρσ 3 . (ii) The functional form of the Gaussian potential brings along considerable numerical advantages: the fast decay with distance along with the fact that �(r ) > 0 for all r -values suppresses the emergence of truncation and compensation errors in the evaluation of lattice sums, which therefore can be evaluated within machine precision. In our investigations we have introduced a cutoff radius, rcut , which is defined via � ∞ � ∞ �(r ) dr � δ �(r ) dr ; rcut
0
typical numerical values are δ = 10−8 and thus rcut ∼ 4.3σ . B. The model
To parameterize the ordered layered structures we view the system as a stacking sequence of n l two-dimensional layers. The top and the bottom layer are separated by a distance D. It is convenient to introduce the area number density, η, given by η=
ρD . nl
For computational reasons we have made three assumptions, denoted by A1 to A3, which can easily be put to a critical assessment via a direct comparison with simulation data. Defining a “simple layer” as a layer where particles form a simple lattice, we assume that A1. particles arrange in two-dimensional structures only within the layers, i.e., the inter-layer regions are completely void; A2. each simple layer is characterized by the same η-values; A3. the two-dimensional lattices in the different simple layers are identical. We point out that from the numerical point of view these assumptions are absolutely indispensable for the application
Author complimentary copy. Redistribution subject to AIP license or copyright, see http://jcp.aip.org/jcp/copyright.jsp
224504-3
Ordered equilibrium structures in thin layers
of GAs to keep the dimensionality of the search space within manageable limits, offering thus the possibility of detailed investigations, that can even be extended to systems with large numbers of layers. We anticipate that the above three assumptions will be fully confirmed by the complementing computer simulations (cf. detailed discussion in Sec. IV E). The n l layers are arranged perpendicular to the z-axis. The top and the bottom layers, carrying indices 1 and n l , are fixed in their vertical positions at z = 0 and z = D, respectively. They confine the system in the vertical direction without assuming any particular wall–particle interaction. The remaining (n l − 2) layers are allowed to be positioned within the range 0 ≤ z ≤ D; their vertical positions are denoted by z i . Of course, the vertical interlayer distances, h i = z i+1 − z i , with h i ≥ 0, i = 1, . . . , n l − 1, have to sum up to D, i.e., n� l −1
h i = D.
i=1
We emphasize that collapsing layers, i.e., layers characterized by the same vertical positions and, consequently, by vanishing h i -values, are explicitly included in the concept: this feature provides the possibility to consider in a straightforward way the parameterization of nonsimple two-dimensional lattices within a layer (see below). The simple ordered two-dimensional lattices can be specified by lattice vectors a (which, for simplicity, we assume to be parallel to the x-axis) and b. Thus vectors a and b, which form the unit cell, can be parameterized via a = a(1, 0),
b = a(x cos ϕ, x sin ϕ),
where 0 ≤ ϕ ≤ π/2 and 0 ≤ x ≤ 1. a is related to η via a2 =
1 . ηx sin ϕ
Furthermore, we introduce interlayer vectors, ci , i = 1, . . . , n l − 1 that connect the origin of the unit cell of layer i with the origin of the neighboring layer with index (i + 1); the ci can be parameterized via ci = αi a + βi b + h i zˆ , where zˆ is the unit vector in the z-direction; the h i has been introduced above. Thus, in total, the layered structure is specified by the following set of (3n l − 2) parameters: {x, ϕ, [αi , βi , i = 1, . . . , n l − 1], [h i , i = 1, . . . , n l − 2]}. Of course, the parameterization of a given structure via a, b, and the set of ci is not unique. In an effort to make the optimization routine as efficient as possible, one has to reduce this ambiguity to the highest possible degree. We achieve this goal by choosing a and b in such a way that the circumference of the unit cell is minimized while selecting for the ci the shortest possible representatives. With a set of n b collapsing, simple layers, i.e., n b layers that have the same vertical position, a nonsimple two-dimensional lattice with (n b − 1) basis particles can be parameterized: the (n b − 1) interlayer vectors ci are now horizontal (since their corresponding h i -values vanish), defining thereby the basis of the nonsimple lattice. This feature will
J. Chem. Phys. 133, 224504 (2010)
be in particular useful when discussing the so-called buckling transition (cf. Sec. IV C). Finally, we point out that the transition from the quasitwo- to the three-dimensional lattice is realized by considering the limiting case D → ∞ (cf. Sec. IV D). III. THEORY AND SIMULATIONS A. Theory
At a given state point in the (D, ρ)-plane the ordered equilibrium configuration is determined by minimizing the corresponding thermodynamic potential. This minimization has to be performed in the (3n l − 2)-dimensional search space, spanned by the parameters that characterize a layered structure (see above) and consider a reasonable number of layers. As specified in detail in Sec. I, the optimization techniques based on GAs have proven to be reliable and efficient numerical tools in investigations on the ordered equilibrium structures for a broad variety of soft matter systems.16, 18–33, 35 For the present contribution we have developed a genotype GA-code,43 drawing from our experience on successful codes developed for two-22, 24 and three-dimensional28, 29, 43 systems. Similar as in previous applications we have used 12- and 6-bit representations for encoding lengths and angles, respectively. In a single GA-run, 1200 generations were considered, each of them having 500 individuals. For most of the state points considered, at least 20 independent GA-runs were performed. The crossover operation was carried out via a uniform crossover algorithm, assuming a mutation rate of 0.35%. In a final step, the solution proposed by the GA-run was refined in a steepest descent search.44 For details we refer to Refs. 43 and 45. Working at T = 0, at fixed volume and particle number, the thermodynamic potential to be minimized is the lattice sum, U . Its evaluation was truncated at the cutoff radius rcut introduced in Sec. II A. The suitability for a successful reproduction of a lattice, S, is calculated via the fitness function f (S). Since we search for the energetically most favorable particle arrangement, f (S) is based on U (S). Here, we have chosen the canonical form,43 i.e., f (S) = exp[1 − U (S)/U (S0 )],
(2)
where U (S0 ) is the lattice sum of a reference square structure of same density. B. Simulations
To complement the theoretical approach structures we have performed standard MC simulations in a canonical (NVT) ensemble. For the (reduced) temperature, T = T /(kB �), kB being the Boltzmann constant, we have chosen a value of T = 0.002 which is (i) sufficiently close to the vanishing temperature used in the theoretical investigations and for which (ii) solidification of the system over a representative density-range is expected: the bulk phase diagram of our system (e.g., given in Ref. 42), provides evidence that for T = 0.002 the system solidifies—apart from a very small
Author complimentary copy. Redistribution subject to AIP license or copyright, see http://jcp.aip.org/jcp/copyright.jsp
Kahn, Weis, and Kahl
region at low densities (i.e., ρσ 3 � 0.075)—in the entire ρ-range considered in this study. The setup of the simulation cell is identical to the theoretical model: the top and the bottom layers are fixed in their vertical positions at z = 0 and z = D, respectively. In the horizontal direction periodic boundary conditions were applied. In an effort to avoid any bias of the emerging structure, the shape of the simulation cell is adaptive in its x- and y-directions such that the volume remains constant.46–48 In our simulation study systems with up to five layers have been considered. In an effort to guarantee a sufficiently high numerical accuracy, at least 500 particles per layer were considered and simulation runs were extended over 2 – 6 ×10⁶ trial moves per particle. We have used different initial conditions for our simulation runs. This was done in an effort to assess the theoretical assumptions A1 to A3 (cf. Sec. II B) and to confirm via independent simulations the formation of a predicted ordered structure for a given state point. For most of the systems investigated we used the following strategy: (i) if a hexagonal structure is predicted by theory for a particular state point, then particles were positioned in the initial configuration on a rectangular lattice on predefined layers that were equally spaced in their vertical distances. If, on the other hand, theory predicts a rectangular (or square) structure, then particles were arranged on a hexagonal lattice for the initial configurations, again on equally spaced, predefined layers. In both cases, the number of particles per layer was chosen to be compatible with the respective initial structure. (ii) Further, a more general initial setup was considered for selected state points: assuming an equal population on each layer, particles were positioned in random positions on the layers, which, again, were equally spaced in the vertical direction. (iii) Finally, we have also considered the most general initial condition, where the particles were positioned at random in the simulation box. Due to the finite size of the system, the limited simulation time, and the finite temperature, the system is not able to form perfect ordered structures. In an effort to characterize the emerging structures, we have evaluated the in-layer distribution function, g(r ), and the two-dimensional orientational bond order parameters, 4 and 6 ,49 defined via � � Nb,i 1 � 1 � exp[in�i j ] , n = 4, 6. (3)
n = N Nb,i j=1 i N is the number of particles and the brackets �· · · denote an ensemble average. Further, Nb,i denotes the number of nearest neighbors of particle i, a quantity which is determined via a Voronoi tessellation.50 Finally, �i j is the angle of the vector connecting particles i and j with respect to the Cartesian coordinate system. g(r ) provides information about the correlations of particles belonging to the same layer; the positions of the peaks in g(r ) are expected to coincide with the interparticle distances in the predicted, ideal lattice. The order parameters, on the other hand, provide an averaged information about the local structure of the particles with respect to their neighbors. To be more specific, 4 represents an indicator for the square lat-
J. Chem. Phys. 133, 224504 (2010)
tice, attaining its ideal value, 4 = 1, for a square lattice and vanishing for the hexagonal lattice. For 6 we encounter the inverse situation: here, 6 = 1 for the hexagonal lattice and
6 = 0 for the square lattice. For the (centered) rectangular lattice no such indicator is available.
IV. RESULTS A. Diagram-of-states
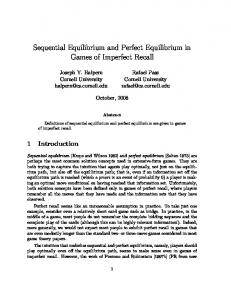
The diagram-of-states, depicted in Fig. 1, provides two relevant pieces of information about the ordered equilibrium structures of the system at a given state point. First, we learn about the number of layers that the system forms: from Fig. 1 we see that state points that are characterized by a particular number of layers populate stripe-shaped regions in (D, ρ)space; these regions are separated by full lines which will be discussed in detail in Sec. IV C. Second, the diagram provides information about the specific ordered structure that the system forms. In total we observe four ordered equilibrium structures: the rectangular, the hexagonal (�), the square (�), and the centered rectangular (R) lattice. The rectangular structure is encountered only in a small region at low densities and low D-values, while the other three structures can be identified in the entire (D, ρ)-range investigated in this contribution. We note that only a restricted range in D and ρ is displayed in Fig. 1; the diagram-of-states for the entire parameter range investigated is shown in Fig. 1 of Ref. 35. We start our discussion by focusing on one of the subregions where the system forms a particular number of layers and investigate in detail the sequences of emerging ordered structures. We observe throughout the following, common scheme: at the bottom of these stripe-shaped subregions, the system forms square lattices; as we then proceed with increasing D and/or ρ toward the upper boundary of this stripe we encounter first centered rectangular lattices and, finally,
8 7
nl = 6
6 nl = 5
5
D/σ
224504-4
nl = 4
4 3
nl = 3
2 nl = 2
1 0
0
0.1
0.2
0.3
0.4
3
0.5
0.6
0.7
0.8
ρσ
FIG. 1. Diagram-of-states for the layered system considered in this study: the ordered structures assumed by the system at given values of thickness D and reduced density ρσ 3 are indicated via the following symbols: diamonds; rectangular lattice; full squares; square lattice; triangles; hexagonal lattice; and empty squares; centered rectangular. Regions where the system is composed by nl layers are labeled by the respective nl -value; these regions are separated by lines.
Author complimentary copy. Redistribution subject to AIP license or copyright, see http://jcp.aip.org/jcp/copyright.jsp
Ordered equilibrium structures in thin layers 5×10
-2
4×10
-2
nl=2 nl=3 nl=4 nl=5 nl=6
-2
1.5×10
-2
1.2×10
3×10
-2
2×10
-2
1×10
-2
U/(Nε)
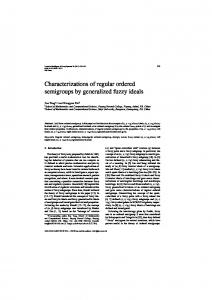
the hexagonal structure. When crossing the boundary to the adjacent stripe, the system forms a square structure with an additional layer and by increasing the system parameters we recover again the above structural sequence. Further, we observe that the extent of the area where a particular structure is identified varies strongly as n l increases. In particular for larger n l -values, the diagram-of-states gives the impression that some of the three structures are missing. This is a consequence of our standard resolution in D and ρ; more detailed investigations performed on finer subgrids in selected areas of the (D, ρ)-plane confirm the existence of all three structures, although they might populate for some parameter combinations only rather narrow regions. The diagram-of-states can be better understood and its complexity can be significantly reduced as we filter out two archetypes of structural transformations. In the first one the number of layers is maintained: as D and/or ρ is increased we observe a transition from a square to a centered rectangular, and eventually to a hexagonal lattice; in a symbolic notation this structural change can be represented by nl �→nl R→nl �. Depending on the n l -value and on the “direction” as we vary the system parameters in the (D, ρ)-plane, the square and the centered rectangular structures are possibly observed only in an extremely narrow parameter range. In its most pronounced manner this structural transition can be identified as we vary ρ while keeping D at a fixed value. Thus we will refer to this as the “horizontal” transition. In Sec. IV B we will give evidence for its continuous character. The second archetype of transition is observed as the system forms a new layer with increasing D and/or ρ, i.e., as we cross in the diagram-ofstates one of the lines that separate regions where the system forms a particular number of layers. However, a simple symbolic representation of this transition, such as, nl �→ (nl + 1)�, does not capture the full complexity of structural details as the systems creates a new layer. In literature, the sequence of highly complex particles arrangements that characterizes this structural change is termed buckling transition. We furthermore report that the complexity of intermediate structures increases drastically with growing n l . This transition emerges in its most pronounced manner as we vary D at fixed ρ; thus we will refer to it as the “vertical” transition. We will give evidence in Sec. IV C that this transition is discontinuous. The diagram-of-states, depicted in Fig. 1 has been obtained as follows: we have fixed the density ρ and have recorded in a first step for each D value the energetically most favorable, ordered equilibrium structure; for each parameter pair (ρ, D), a reasonably large set of nl values, termed {n l }, has been taken into account. As we plot the lattice sums of these particle arrangements as functions of D we arrive at a set of curves, U{nl } (D). In Figs. 2 and 3 representative examples for these curves at a small and a large density are displayed. We note that some of these curves coincide over limited D-ranges, providing thereby a very valuable information about the internal consistency of our approach: a numerically accurate method requires, for instance, that for nl = 2, 4, and 6 the respective Unl -curves must collapse (cf. Fig. 2) since a simple lattice (n l = 2) can alternatively be considered as a nonsimple lat-
J. Chem. Phys. 133, 224504 (2010)
-3
9.0×10
0
-3
6.0×10
0
2.4
2.8
2.6
1
3
2
3
4
5
6
D/σ FIG. 2. Reduced dimensionless lattice sum U/(N �) as a function of D at fixed density ρσ 3 = 0.15 as obtained by GA-based optimization runs, considering different numbers of layers nl as labeled. The inset displays the range 2.3 � D/σ � 3.1 where the buckling transition from nl = 2 to nl = 3 occurs; for clarity only results for nl = 2, 3, and 6 are displayed.
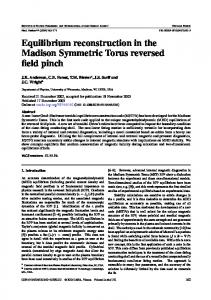
tice (n l = 4 or 6), formed by collapsing, horizontally shifted layers. In Fig. 3 we have depicted Unl -curves for a considerably higher density, namely, ρσ 3 = 0.6. With respect to the low-density case, we now have to take into account systems with up to eight layers. As functions of D, the energy curves lie very close to each other, which makes the identification of the transition values in D very difficult. In order to obtain at a given state point (D, ρ) the ordered equilibrium structure, we fix ρ and consider the set of curves U{nl } (D). Among these curves we search for the one that attains the lowest U -value at the D-value of interest. In this way we can identify the number of layers that the system forms at this state point, the structure of the system, and its thermodynamic properties. For example, from Fig. 2 we can learn that at ρσ 3 = 0.15 and for 1 � D/σ � 2.75, the curve Unl =2 (D) represents the lowest lying energy curve, meaning that the system forms two layers. Then emerges a small transition region (2.75 � D/σ � 3), which is represented in a magnified view in the inset of Fig. 2. As indicated by 1
0.8
U/(Nε)
224504-5
nl=2 nl=3 nl=4 nl=5 nl=6 nl=7 nl=8
0.6
0.4
0.2 0
1
2
3
4
D/σ
5
6
7
8
9
FIG. 3. Same as Fig. 2 but for ρσ 3 = 0.6. No inset for the buckling transition is shown.
Author complimentary copy. Redistribution subject to AIP license or copyright, see http://jcp.aip.org/jcp/copyright.jsp
224504-6
Kahn, Weis, and Kahl
the respective Unl (D)-curves, we observe a transition from a two- to an intermediate six-layer system which eventually transforms into a three-layer system. The small intermediate region, where the buckling transition takes place, will be discussed in detail in Sec. IV C. For 3 � D/σ � 4.7, Unl =3 (D) is the lowest lying energy-curve, indicating that the system forms three layers. Then comes another buckling transition which now takes place in a considerably narrower D-range (and which cannot be resolved on this scale) leading eventually to a four-layer system. Collecting over a representative ρ-range, those D-values where the system undergoes a buckling transition leads to the separating lines in Fig. 1.
J. Chem. Phys. 133, 224504 (2010)
25.69 20
10
0
−10
B. The “horizontal” transition
Since the “horizontal” transition has been treated in Ref. 35 only marginally, we will provide in the present contribution more details on this structural change. This type of transition is observed as D and/or ρ are varied while the system maintains its number of layers; symbolically, it can be written as nl �→nl R→nl �. From simple geometric considerations it becomes obvious that this structural change must be continuous. This becomes evident as we consider all three structures involved as particular realizations of the centered rectangular lattice, characterized by different, specific values of side ratios, s. The square lattice is specified by √ s = 1, while the hexagonal lattice is recovered for s = 3. The “horizontal” transition √ is characterized by a smooth variation of s from s = 1 to s = 3. In Fig. 4 we have displayed the theoretical structure prediction for a system specified by D = 3σ and by three different ρ-values, namely, ρσ 3 = 0.20, 0.25, and 0.30. From these schematic representations the smooth change from a square lattice via a centered rectangular structure to a hexagonal lattice becomes obvious. These findings are fully confirmed in computer simulations. In Figs. 5–7 we show representative snapshots of the simulation cells viewed from above for exactly the same state points as the ones treated in the theoretical approach (cf.
−20
−20
−10
0
10
20
FIG. 5. Simulation snapshot of a layered system at D = 3σ and ρσ 3 = 0.20. At this state point, the system forms three layers, only the particle positions in the two lower layers (specified by the different shading) are displayed. 529 particles per layer have been considered. The initial simulation box was quadratic with a side length of 51.4 σ ; its shape at the instant of the snapshot is delimited by the thin gray lines. Extensions of the simulation box in x- and y-directions are given in units of σ . For this particular state point we obtain
4 = 0.95 and 6 = 0.16.
Fig. 4). From these snapshots we obtain a first impression of the respective ordered structures that the system forms in a computer simulation. As a consequence of the finite temperature and the limited size of the simulation box, these structures are, of course, no perfect lattices. These deficiencies have essentially two origins: on one side, the small, but finite temperatures make the particles oscillate around their equilibrium positions; on the other side, the number of particles might not be compatible with the equilibrium structure that the system would like to accommodate for a particular state point in the finite simulation cell. In an effort to provide a
20
10
0
−10
FIG. 4. Representation of the particle arrangements of an ordered equilibrium structure at D = 3σ , during the “horizontal” transition (cf. discus3 sion in the text); the density values considered are ρσ √ = 0.20 (�-lattice with s = 1), ρσ 3 =√0.25 (R-lattice with 1 < b/a < 1/ 3), ρσ 3 = 0.30 (�lattice with s = 1/ 3), from left to right. Displayed are the top and the side views of the ordered structures, where in the former case only the lower half of the particle configurations are shown; in the upper half an identical, but shifted particle arrangement is found. In the top view, unit cells that characterize the underlying structure are marked as guide for the eyes.
−20 −20
−10
0
10
20
FIG. 6. Same as Fig. 5 but for D = 3σ and ρσ 3 = 0.25. 3 × 529 particles have been inserted in a simulation box that was initially quadratic with a side length of 46 σ ; for this particular state point we obtain 4 = 0.26 and
6 = 0.80.
Author complimentary copy. Redistribution subject to AIP license or copyright, see http://jcp.aip.org/jcp/copyright.jsp
224504-7
Ordered equilibrium structures in thin layers
J. Chem. Phys. 133, 224504 (2010)
20
6 5
10
g(r)
4 3
0 2 1
−10
0
−20
−10
0
10
0
1
2
3
0
1
2
3
0
1
2
3
r
4
5
6
7
4
5
6
7
4
5
6
7
6
20
5
FIG. 7. Same as Fig. 5 but for D = 3σ and ρσ 3 = 0.30. 3 × 529 particles have been inserted in a simulation box that was initially quadratic with a side length of 42 σ ; for this particular state point we obtain 4 = 0.04 and
6 = 0.964.
g(r)
4 3 2 1 0
r
8
6
g(r)
more quantitative basis for a comparison between simulations and theory we have evaluated from the simulation data the bond orientational order parameters, 4 and 6 , as defined in Eq. (3) and the in-layer PDF, g(r ), for the three selected state points specified above. 4 and 6 are plotted as functions of ρ in Fig. 8, keeping D fixed. For 0.12 � ρσ 3 � 0.2 we find 4 ∼ 1 (representing the ideal value for the square lattice), which then drops rapidly to zero, as the system assumes a hexagonal structure. In contrast, 6 ∼ 0 for 0.25 � ρσ 3 , but then steeply rises to 6 ∼ 1, indicating that the particles arrange in a lattice that is close to a hexagonal structure. Inplane PDFs, g(r ), are depicted in Fig. 9: we show for each of the three states the g(r )’s, evaluated for each of the three layers that the system forms. The three PDFs display with their peak positions in an unambiguous way fingerprints of the respective, underlying ordered structure; the positions of the nearest neighbors in the corresponding perfect structures (as predicted by the GA) are marked by symbols. Furthermore, the data presented in Fig. 9 give evidence that the g(r )’s
4
2
0
1
r
FIG. 9. In-layer PDFs, g(r ), as functions of r for a layered system with D = 3σ and ρσ 3 = 0.2, 0.25, and 0.3 (from top to bottom) as obtained from simulations. Different line symbols correspond to data obtained from the three different layers that the system forms. Symbols indicate distances between particles in the corresponding ordered structures as predicted by theory.
0.8
Ψ
0.6
0.4
evaluated for the different layers at a given state point coincide within high accuracy, confirming thereby the validity of our assumption A3 (cf. Sec. II B).
0.2
0
0.1
0.15
0.2
0.25
3
0.3
0.35
0.4
ρσ
FIG. 8. Orientational bond order parameters, 4 (�) and 6 (�), as obtained from simulations as functions of ρ for a layered system with D = 3σ .
C. The “vertical” transition
The “vertical” (or buckling) transition is considerably more complex than the “horizontal” one. It occurs as the system forms a new layer, as D and/or ρ increase. In a recent
Author complimentary copy. Redistribution subject to AIP license or copyright, see http://jcp.aip.org/jcp/copyright.jsp
Kahn, Weis, and Kahl
contribution,35 we have discussed in detail the theoretical prediction for this transition for the particular case that the system transforms from a two- to a three-layer system; in the transition region, the system forms a complex sequence of (partly collapsing) six layer systems which help to realize the transition from a two-layer system with hexagonal symmetry to a three-layer with square symmetry. Furthermore, a detailed analysis on the level of the energies of the emerging structures has revealed that the structures are characterized by minute energy differences (cf. Table I in Ref. 35). We point out that for our system the buckling transition occurs in its most pronounced way at low densities and small D-values. For high densities and/or large D-values, this structural change takes place in very narrow intervals of the system parameters, making it practically impossible to identify even with our highly sensitive GA-based optimization tool the emerging intermediate structures. In the following we will focus on our simulation-based investigations of this transition. To be more specific we will discuss the buckling transition at ρσ 3 = 0.15 as the system changes from a two- to a three-layer system, which occurs for 2.65 � D/σ � 3.1. In Fig. 10 we display two simulation snapshots of a layered system at ρσ 3 = 0.15, specified by D = 2.92σ (upper panel) and D = 3.1σ (lower panel), respectively: for D = 2.92σ we can identify in an unambiguous way a two-layer system while the lower panel shows a system at the buckling transition. In particular, the latter snapshot provides evidence for the particular difficulties to identify the complex sequence of structures emerging at the buckling transition from simulation data. Nevertheless, some more specific information about this transition can be obtained from the vertical one-particle density profile, ρ(Z ), displayed in Fig. 11 for ρσ 3 = 0.15 for selected D-values. For convenience we have shifted the origin of the Cartesian coordinate system to the center of the confined geometry, i.e., Z = z − D/2. ρ(Z ) provides a relatively good insight into the buckling transition observed in simulations: at D = 2.65σ and D = 2.75σ , the system forms well-defined bottom and top layers. As we increase D, (i.e., to D = 2.87σ and D = 2.92σ ) two small, symmetric side peaks in ρ(Z ) at Z ∼ 0.7σ give evidence that two new layers have detached both from the top and the bottom layers, respectively. They correspond exactly to the two
J. Chem. Phys. 133, 224504 (2010)
8
D/σ = 2.65 D/σ = 2.75 D/σ = 2.87 D/σ = 2.92 D/σ = 2.96 D/σ = 3.00 D/σ = 3.10
6
ρ(Z)
224504-8
4
2
0
0
-1
1
Z
FIG. 11. Vertical density profile, ρσ 3 (Z ), for a layered system with ρσ 3 = 0.15 as obtained from simulations as a function of Z (cf. text). Different colors correspond to different D-values as displayed in the inset.
detached layers that have been identified in our theoretical investigations of the buckling transition, presented in Ref. 35. Induced by an additional minute change in D, i.e., as D increases from 2.92 to 2.96σ , these two layers merge, forming thereby an additional third layer located in the center of the geometry, i.e., at Z = 0. A more quantitative information can be obtained from the orientational bond order parameters 4 and 6 ; they are displayed as functions of D in Fig. 12, keeping the density fixed to ρσ 3 = 0.35. Varying D from σ to 5σ we find a rapidly alternating sequence of square lattices (characterized by 4 ∼ 1 and 6 ∼ 0) and hexagonal lattices (characterized by 4 ∼ 0 and 6 ∼ 1). The small D-ranges, where 4 drops from 1 to zero and 6 rises steeply from zero to 1, show consecutive changes from a square to a hexagonal and then again to a square lattice; from the comparison with the diagram-ofstates (cf. Fig. 1) we find that each time that 6 → 0 the system forms an additional layer. The fact that these D-intervals are rather narrow in combination with the observation that the energy differences between the competing structures are 1
0.8
Ψ
0.6
0.4
0.2
0
FIG. 10. Simulation snapshot of a layered system (side view) with ρσ 3 = 0.15. Top panel: D = 2.92σ , i.e., shortly before the buckling transition takes place; bottom panel: D = 3.1σ , i.e., at the buckling transition.
1
2
3
D/σ
4
5
FIG. 12. Orientational bond order parameters, 4 (�) and 6 (�), as obtained from simulations as functions of D for a layered system with ρσ 3 = 0.35.
Author complimentary copy. Redistribution subject to AIP license or copyright, see http://jcp.aip.org/jcp/copyright.jsp
224504-9
Ordered equilibrium structures in thin layers
J. Chem. Phys. 133, 224504 (2010)
very small, makes it practically impossible to identify these intermediate structures from standard simulation techniques; however, we point out that highly specialized simulation techniques (such as the lattice switch Monte Carlo method51 ) are probably able to cope with this problem.
Finally, we have studied the ordered layered structures of our system in the limit D → ∞, i.e., as we approach the bulk limit; to be more specific we have investigated this behavior for wall distances up to D = 100σ . Our investigations were carried out at a density ρσ 3 = 0.1, for which—according to the phase diagrams presented in Ref. 41 and 42—the bulk system forms an fcc lattice. By analyzing the ordered structures that the system forms with increasing D, we obtain detailed information from which stage of the process onward the fcc structure can be identified. Before we discuss our results, we point out that the fcc lattice can be constructed via three, alternative stacking sequences of two-dimensional Bravais lattices: (a) stacking sequence AB AB · · · of a two-dimensional square-lattice in the �100 direction and with a lattice parameter a, which is also the fcc lattice √ constant. The layers are displaced by (a/2, a/2, a/ 2); (b) stacking sequence AB AB · · · of a two-dimensional rectangular lattice in the �11� 0 direction with side lengths √ fcc lattice a and a/ 2; a is the √ √ constant. The layers are displaced by (a/2, a/ 8, a/ 8); (c) stacking sequence ABC ABC · · ·, of a two-dimensional √ hexagonal lattice with lattice parameter a; now 2a is the fcc √ lattice √ constant. Each layer is displaced by (a/2, a/ 12, 2/3a). In our investigations we find that during the entire process, i.e., as D grows from small values to 100σ , the system forms the fcc structure via route (c): at any stage of the process the particles arrange in hexagonal two-dimensional lattices and the layers are found to be √ equally separated between the walls with h i = D/(n l − 1) = 2/3a. The identification of the ordered equilibrium structures becomes, of course, more difficult as D increases. Note that for D ∼ 100σ the system forms ∼ 50 layers, i.e., a layered equilibrium structure that has to be identified in an approximately 150-dimensional parameter space. The lattice sum as a function of D is depicted in Fig. 13 for D-values up to D = 100σ . From this presentation it becomes obvious that with increasing D (and thus with increasing n l ), the lattice sum of the system approaches the free energy of the fcc bulk phase. The fact that the system “tends” toward an fcc lattice can easily be traced by the threedimensional orientational bond order parameters.52 We would like to point out, that we have observed— in particular for large D-values—on several occasions, that stacking sequences such as ABC BC ABC · · · occur; they correspond to hcp-type stacking faults, as they also occur in realistic systems. They reflect the fact that the hcp lattice differs in energy from the fcc lattice only with a small amount.
-2
n =5 l
-2
1×10
U/(Nε)
A A A A A AA A A A
n =2 l n =3 l n =4 l
2×10
n =6 l n =46 l n =47 l n =48 l n =49 l
1×10⁻² 8×10⁻³
A
1.8×10⁻²
1.7×10⁻²
A nl=50
1.7×10⁻²
bulk fcc
5×10⁻³
-2 1.6×10
A
-3
2×10 0
1.6×10⁻² 90
1
10
92
94
A
96
A
A
98
A
A
A
100
100
D/σ
FIG. 13. Reduced dimensionless lattice sum U/(N �) as a function of D at fixed density ρσ 3 = 0.1 as obtained by GA-based optimization runs, considering different numbers of layers nl as labeled. The inset displays the range 90 � D/σ � 101, i.e., close to the fcc bulk crystal. The horizontal line displays the lattice sum of a three-dimensional fcc crystal of the same density.
E. Verification of theoretical assumptions A1, A2, A3
We now return to the three assumptions A1, A2, and A3, put forward in Sec. II B, and underlying our theoretical investigations. In the first assumption A1 we have stated that the interlayer regions are essentially void, i.e., particles populate exclusively the layers. The validity of this assumption is fully confirmed in our computer simulations: let us consider the state point D = 4σ and ρσ 3 = 0.2, for which our theoretical approach predicts that the system forms a three-layer system with a hexagonal in-layer particle arrangement. As a first initial condition (IC-1) for our simulations we have inserted 1587 particles at random in the hexagonal box. The vertical density profile, σ 3 ρ(Z ), and the in-layer PDF, g(r ) are displayed in Figs. 14 and 15. We find that the system forms during the simulation run indeed three well-defined layers, their small spatial extent (∼6%) is a consequence of the small, but finite temperature that we have chosen for the simulation. We note that the vertical positions of the 8
6
ρ(Z)
D. The transition D → ∞
-2
2×10
4
2
0
-2
-1
0
1
2
Z FIG. 14. Vertical density profile, ρσ 3 (Z ), for a layered system with D = 4σ and ρσ 3 = 0.20 as obtained from simulations as a function of Z (cf. text).
Author complimentary copy. Redistribution subject to AIP license or copyright, see http://jcp.aip.org/jcp/copyright.jsp
224504-10
Kahn, Weis, and Kahl
J. Chem. Phys. 133, 224504 (2010)
7
of the particles within the layers, we finally obtain in-layer PDFs that agree within high accuracy with the ones shown in Fig. 15. The corresponding orientational bond order parameters are compiled in Table I. Note that a reliable verification of assumption A3 has already been presented in this contribution in previous considerations for three additional state points (cf. Fig. 9).
6
g(r)
5 4 3 2
V. CONCLUSIONS AND OUTLOOK
1
In this contribution we have investigated the ordered layered structures that a system forms as it grows, layer by layer, from a two-dimensional lattice to a three-dimensional crystal. In our system, particles that are confined between two parallel walls of distance D interact via the Gaussian core model, a commonly used model potential in soft matter systems. On one side, our investigations were based on optimization techniques inspired by ideas of genetic algorithms, helping to identify the ordered particle arrangements; for these investigations the temperature was taken to be zero. On the other side, we have performed complementary Monte Carlo simulations, using—in an effort to avoid any bias—different initial conditions and adaptive cell geometries; in these simulations a very small temperature was chosen. While the number of different, identified lattices is rather small—essentially we have found the rectangular, the hexagonal, the square, and the centered rectangular lattice—it is the complexity of the structural sequences as the system parameters vary that make the investigations so interesting. The resulting diagram-of-states can be well understood by filtering out two transitions: in the first one the number of layers remains unchanged while in the other the system forms with increasing system parameters a new, additional layer. The first transition, being continuous in nature, can easily be understood using geometric arguments. The other one, termed buckling transition in literature and being discontinuous, is an impressive example how the positions of the particles are optimized at every instant of the process, guaranteeing thereby that the energy of the arrangement is minimized. Our genetic algorithm-based investigations provide evidence that in particular at the buckling transition the competing structures formed by the system are separated by minute energy differences. The complementary computer simulations confirm essentially the predicted results; however, and in particular during the buckling transition, the finite temperature and the limited ensemble size make a precise prediction of the ordered equilibrium structure with standard simulation techniques rather impossible. The present investigation represents, on one side, yet another impressive demonstration of the power of optimization strategies based on genetic algorithms. These small energetic differences that characterize competing structures explain why discrepancies encountered for the different approaches are observed: (i) experimental and theoretical investigations of these transitions occur in very narrow D-ranges, thus the identification of the emerging structures becomes very difficult; (ii) experimental setups mostly use a wedge geometry; thus a particular ordered phase at some given thickness D “grows out” of a neighboring ordered phase at a slightly smaller D-value and will
0
0
1
2
3
4
r
6
5
7
FIG. 15. In-layer PDFs, g(r ), as functions of r for a layered system with D = 4σ and ρσ 3 = 0.2 as obtained from simulations. Different line symbols correspond to data obtained from the three different layers that the system forms. The most general initial condition (IC-1; cf. text) has been used in the simulation. Symbols indicate distances between particles in the corresponding ordered structures as predicted by theory.
particles are rigorously limited to the interval [0, D], thus particles in the central layer feel a larger vertical freedom than the ones in the top and the bottom layer, a fact which is reflected in the different widths in the corresponding peaks in the vertical density profile. Furthermore, counting the number of particles that populate the three layers, we find that the respective numbers differ by less than ∼1% (cf. Table I). This observation validates thus our assumption A2, which stated that the particle number density in each layer is the same. For the three in-layer PDFs, g(r ), we find that their peak positions and their peak heights agree—within numerical accuracy— nicely, confirming thereby assumption A3, which stated that the structures within the layers are identical. Similar to the example shown in Ref. 35 one can demonstrate also for this particular state point that the peak positions of the in-layer PDFs shown in Fig. 15 agree nicely with the inter-particle distances encountered in the ideal hexagonal lattice (indicated by symbols). In Table I we complement these results by the data for the orientational bond order parameters, 4 and 6 . These results confirm that in all three layers hexagonal lattices are formed. As an alternative initial condition (IC-2) for our simulations we have considered three fixed, equally spaced and equally populated layers in a hexagonal simulation box, i.e., 504 particles in each layer. Starting from random positions TABLE I. Number of particles, N , and bond orientational parameters, 4 and 6 , as obtained from simulations per layer of the state point characterized by D = 4σ and ρσ 3 = 0.2. IC-1 and IC-2 refer to the two different initial conditions used in the simulations (cf. text). IC-1
IC-2
Layer
N
4
6
4
6
1 2 3
522 536 529
0.0719 0.0794 0.0715
0.9402 0.9396 0.9405
0.0808 0.0782 0.0808
0.9435 0.9456 0.9435
Author complimentary copy. Redistribution subject to AIP license or copyright, see http://jcp.aip.org/jcp/copyright.jsp
224504-11
Ordered equilibrium structures in thin layers
therefore be strongly influenced by the latter. Thus, an entirely independent formation of a layered structure for an “isolated” state point, as we can easily simulate it with the tools used in this contribution, is not accessible in experiment; (iii) an accurate identification of the complex transitional structures is definitely affected by the minute energy differences of the competing structures; as we have seen in our investigations, even in relatively large ensembles and assuming adaptive cell geometries, the formation of “ideal” lattice structures is out of reach; (iv) since most theoretical concepts are based on approximate assumptions, it is difficult to estimate the ensuing consequences for the identification of the structures. Of course, there is no guarantee that optimization algorithms based on genetic algorithms always find the optimized particle configuration for a given set of external parameters. Other successful optimization schemes, such as the basin hopping algorithm53 or metadynamics simulations,54 represent undoubtedly optimization tools with a comparable success rate. The most obvious question that arises is related to the expected effects of finite temperature. Extending the present genetic algorithm method to T > 0, the key problem to be faced is the inclusion of entropy in the thermodynamic potential. For this particular model the situation is not that hopeless: reasonable results for the free energy of the Gaussian core model can be obtained by assuming a mean-field type of density functional, where the excess contribution to the free energy functional is given by � � 1 drdr� ρ(r)�(|r − r� |)ρ(r� ), F ex [ρ] = 2 ρ(r) is the one particle density profile. This functional is known to provide reliable information for ultrasoft systems, in particular for the Gaussian core model.41, 55, 56 Conceptually, this approach represents a realizable solution to cope with finite temperatures. However, the model introduces further parameters in the functional, i.e., the width of the one-particle density profile, leading thereby to additional parameters that have to be optimized; thus we risk to pass the computational limits of the genetic algorithm approach. For other systems, a reliable evaluation of the entropic contribution to the thermodynamic potential represents, however, a serious problem. Being approximate in nature, these concepts might introduce an error to the evaluation of the thermodynamic potential which is difficult to estimate with unpredictable consequences for the optimization step. In the end, one is left with a rather unclear situation and one can never be sure if this conceptual error is responsible for predicting a “wrong” structure. Note added in proof: During the production of this manuscript, a closely related topic was addressed in Ref. 57.
ACKNOWLEDGMENTS
We thank Dieter Gottwald and Julia Fornleitner (both Wien), Christos N. Likos (Düsseldorf and Wien) as well as T. Palberg, A.B. Fontecha, and H.-J Schöpe (all Mainz) for helpful discussions. This work was funded by the Austrian
J. Chem. Phys. 133, 224504 (2010)
Science Foundation (FWF), under Project Nos. 17823-N08 and P19890-N16. J.-J.W. and G.K. gratefully acknowledge financial support by the Programme Hubert Curien AMADEUS under Project Nos. 13815TF and FR 09/2007. 1 P.
Pieranski, L. Strzelecki, and B. Pansu, Phys. Rev. Lett. 50, 900 (1983). Pansu, Pi. Pieranski, and Pa. Pieranski, J. Phys. (Paris), 45, 331 (1984). 3 D. H. Van Winkle and C. A. Murray, Phys. Rev. A 34, 562 (1986). 4 S. Neser, C. Bechinger, P. Leiderer, and T. Palberg, Phys. Rev. Lett. 79, 2348 (1997). 5 A. B. Fontecha, H.-J. Schöpe, H. König, T. Palberg, R. Messina, and H. Löwen, J. Phys.: Condens. Matter 17, S2779 (2005). 6 F. Ramiro-Manzano, F. Meseguer, E. Bonet, and I. Rodriguez, Phys. Rev. Lett. 97, 028304 (2006). 7 F. Ramiro-Manzano, E. Bonet, I. Rodriguez, and F. Meseguer, Phys. Rev. E 76, 050401 (2007). 8 A. B. Fontecha, T. Palberg, and H.-J. Schöpe, Phys. Rev. E 76, 050402 (2007). 9 A. B. Fontecha and H.-J. Schöpe, Phys. Rev. E 77, 061401 (2008). 10 T. Chou and D. R. Nelson, Phys. Rev. E 48, 4611 (1993). 11 M. Schmidt and H. Löwen, Phys. Rev. Lett. 76, 4552 (1996). 12 M. Schmidt and H. Löwen, Phys. Rev. E 55, 7228 (1997). 13 R. Zangi and S. A. Rice, Phys. Rev. E 61, 660 (2000). 14 H. Bock, K. E. Gubbins, and K. G. Ayappa, J. Chem. Phys. 122, 094709 (2005). 15 A. Fortini and M. Dijkstra, J. Phys. Condens.: Matter 18, L371 (2006). 16 D. Gottwald, C. N. Likos, G. Kahl, and H. Löwen, Phys. Rev. Lett. 92, 068301 (2004). 17 D. Gottwald, C. N. Likos, G. Kahl, and H. Löwen, J. Chem. Phys. 122, 074903 (2005). 18 H. Löwen, A. Esztermann, A. Wysocki, E. Allahyarov, R. Messina, A. Jusufi, N. Hoffmann, D. Gottwald, G. Kahl, M. Konieczny, and C. N. Likos, J. Phys.: Conf. Ser. 11, 207 (2005). 19 B. M. Mladek, D. Gottwald, G. Kahl, M. Neumann, and C. N. Likos, Phys. Rev. Lett. 96, 045701 (2006); Erratum, ibid. 97, 019901 (2006). 20 B. M. Mladek, D. Gottwald, G. Kahl, C. N. Likos, and M. Neumann, J. Phys. Chem. B 111, 12799 (2007). 21 T. Tückmantel, F. Lo Verso, and C. N. Likos, Mol. Phys. 107, 523 (2009). 22 J. Fornleitner and G. Kahl, Europhys. Lett. 82, 18001 (2008). 23 J. Fornleitner and G. Kahl, J. Phys.: Condens. Matter 22, 104118 (2010). 24 J. Fornleitner, F. Lo Verso, G. Kahl, and C. N. Likos, Soft Matter 4, 480 (2008). 25 J. Fornleitner, F. Lo Verso, G. Kahl, and C. N. Likos, Langmuir 25, 7836 (2009). 26 A. Chremos and C. N. Likos, J. Phys. Chem. B 113, 12316 (2009). 27 J. Dobnikar, J. Fornleitner, and G. Kahl, J. Phys.: Condens. Matter 20, 494220 (2008). 28 G. J. Pauschenwein and G. Kahl, Soft Matter 4, 1396 (2008). 29 G. J. Pauschenwein and G. Kahl, J. Chem. Phys. 129, 174107 (2008). 30 G. J. Pauschenwein and G. Kahl, J. Phys.: Condens. Matter 21, 474202 (2009). 31 D. P. Stucke and V. H. Crespi, Nano Lett. 3, 1183 (2003). 32 L. Filion and M. Dijkstra, Phys. Rev. E 79, 046714 (2009). 33 G. Doppelbauer, E. Bianchi, and G. Kahl, J. Phys.: Condens. Matter 22, 104105 (2010). 34 A. Nikoubashman and C. N. Likos, J. Phys.: Condens. Matter 22, 104107 (2010). 35 M. Kahn, J.-J. Weis, C. N. Likos, and G. Kahl, Soft Matter 5, 2852 (2009). 36 F. Stillinger, J. Chem. Phys., 65, 3968 (1976). 37 A. A. Louis, P. G. Bolhuis, J.-P. Hansen, and E. J. Meijer, Phys. Rev. Lett. 85, 2522 (2000). 38 C. N. Likos, S. Rosenfeldt, N. Dingenouts, M. Ballauff, P. Lindner, N. Werner, and F. Vögtle, J. Chem. Phys. 117, 1869 (2002). 39 I. O. Götze, H. M. Harreis, and C. N. Likos, J. Chem. Phys. 120, 7761 (2004). 40 A. R. Denton, Phys. Rev. E 67, 011804 (2003); Erratum, ibid. 68, 049904 (2003). 41 A. Lang, C. N. Likos, M. Watzlawek, and H. Löwen, J. Phys.: Condens. Matter 12, 5087 (2000). 42 S. Prestipino, F. Saija, and P. V. Giaquinta, Phys. Rev. E 71, 50102 (2005). 2 B.
Author complimentary copy. Redistribution subject to AIP license or copyright, see http://jcp.aip.org/jcp/copyright.jsp
224504-12
Kahn, Weis, and Kahl
43 D. Gottwald, G. Kahl, and C. N. Likos, J. Chem. Phys. 122, 204503 (2005). 44 W.
Press, S. Teukolsky, W. Vetterling, and B. Flannery, Numerical Recipes in C: The Art of Scientific Computing, 2nd ed. (Cambridge University Press, Cambridge, UK, 1992). 45 M. Kahn, Diploma thesis, “Ordered equilibrium structures of soft particles in layered systems”, TU Wien, 2008 (unpublished); http://tph.tuwien.ac.at/ smt/extra/publications/diploma/kahn.pdf. 46 M. Parrinello and A. Rahman, J. Appl. Phys. 52, 7182 (1981). 47 S. Yashonath and C. N. R. Rao, Mol. Phys. 54, 245 (1985). 48 D. Levesque, J.-J. Weis, and M. L. Klein, Phys. Rev. B 34, 178 (1986). 49 K. J. Strandburg, Rev. Mod. Phys. 60, 161 (1988). 50 A. Okabe, B. Boots, K. Sugihara, and S. N. Chiu, Spatial Tessellations: Concepts and Applications of Voronoi Diagrams (Wiley, New York, 2000).
J. Chem. Phys. 133, 224504 (2010) 51 A.
D. Bruce, A. N. Jackson, G. J. Ackland, and N. B. Wilding, Phys. Rev. E 61, 906 (2000). 52 P. J. Steinhart, D. R. Nelson, and M. Ronchetti, Phys. Rev. B 28, 784 (1983). 53 D. J. Wales, Energy Landscapes (Cambridge University Press, Cambridge, UK, 2003). 54 R. Martonak, A. Laio, M. Parrinello, Phys. Rev. Lett. 90 075503 (2003). 55 C. N. Likos, A. Lang, M. Watzlawek, and H. Löwen, Phys. Rev. E 63, 031206 (2001). 56 A. A. Louis, P. G. Bolhuis, and J.-P. Hansen, Phys. Rev. E 62, 7961 (2000). 57 A. Reinmüller, H. J. Schöpe, and T. Palberg, Soft Matter 6, 5312 (2010).
Author complimentary copy. Redistribution subject to AIP license or copyright, see http://jcp.aip.org/jcp/copyright.jsp