Woodilla and Averbach.[29]. Fig. 2âTTT diagram of a Au-40 at. pct Ni alloy determined from TEM characterization. The C curve for spinodal decomposition is ...
Ordering Transformation and Spinodal Decomposition in Au-Ni Alloys JI-CHENG ZHAO and MICHAEL R. NOTIS A transmission electron microscope (TEM) was employed to study the ordering and phase separation processes in Au-40 at. pct Ni and Au-50 at. pct Ni alloys in order to test for the possible existence of a transient long-range–order (LRO) phenomenon within a disordered miscibility gap. An L10 LRO phase was found in the Au-50 at. pct Ni alloy when spinodally decomposed specimens were reannealed at ;490 7 C on a TEM hot stage. This observation, together with the literature results, indicates that a transient LRO did exist in the Au-Ni system, although it appeared during a reversion process. Attempts to nd the L10 and L12 LRO phases during decomposition processes of a single-phase homogeneous solid solution were unsuccessful, except in very thin sections of the TEM foils. Elastic strain energy relaxation was employed to explain the experimental observations. Time-temperaturetransformation (TTT) diagrams for the two Au-Ni alloys were constructed based on the TEM characterization. In bulk-annealed samples, only spinodal decomposition and discontinuous precipitation structures were observed.
I.
INTRODUCTION
THE purpose of this study was to nd a previously predicted transient ordering phenomenon within a disordered miscibility gap. Theoretical calculations by Zunger and coworkers[1–4] predicted the possibility of the occurrence of metastable long-range–order (LRO) phases within a disordered miscibility gap. Recent computer simulations also provided a similar prediction. Chen and Khachaturyan,[5] using a generic two-dimensional square lattice numerical simulation and assuming a pair interaction model, demonstrated that, during an isostructural decomposition of a disordered phase into a mixture of two disordered phases, as typically shown by a miscibility gap, it was possible to form one or more transient (virtual) ordered phases prior to the formation of the two equilibrium disordered phases. Their simulation was based upon the mean- eld microscopic kinetic theory developed by Khachaturyan.[6,7] Reinhard and Turchi,[8] using a Monte Carlo simulation based on a rst-principle electronic structure calculation, also demonstrated that transient B32 ordering could take place before the separation of a bcc matrix of a Ti50 V50 alloy into Ti- and V-rich disordered bcc phases. These calculation and simulation results are signi cant to the theories of phase stability and phase transformations, because they challenge a widely accepted concept that only atomic clustering (no ordering) could occur within a disordered miscibility gap. However, no convincing evidence in bulk alloys has yet been found for the appearance of transient LRO states within a disordered miscibility gap. Au-Ni is a good alloy
JI-CHENG ZHAO, formerly Graduate Student, Department of Materials Science and Engineering, Lehigh University, is Staff Materials Scientist, General Electric Corporate Research and Development, Schenectady, NY 12301. MICHAEL R. NOTIS, Professor, is with the Department of Materials Science and Engineering, Lehigh University, Bethlehem, PA 18015. Manuscript submitted June 30, 1998. METALLURGICAL AND MATERIALS TRANSACTIONS A
system to test for the existence of this transient ordering phenomenon. The Au-Ni system has been a testing ground for theories of phase stability.[9] Theoretical study on the phase stability of the Au-Ni system has been extensive, and a critical review of literature results and a state-of-the-art calculation can be found in Wolverton and Zunger.[9] This most recent study is in agreement with the majority of previous theoretical studies that, for the fcc phase, the elastic (size mismatch) contribution to the heating of mixing (DHm ) is a large positive value favoring clustering, and the chemical contribution to DHm is a smaller negative value favoring ordering. The total (net) DHm is still a small positive value, in agreement with the results experimentally evaluated by Wu and Cohen.[10] For the ordered structures, Lu et al.[11] and Lu and Zunger[12] de ned an ordering energy of dEord 5 DH F (sx ) 2 DHm ix(x); where DHF (sx ) is the formation enthalpy of an ordered compound of structure s, and DHmix (x) is the mixing enthalpy of a random alloy of composition x. If dEord , 0, the random alloy could develop a short-range order (SRO) of the type underlying the structure s. When DHF (sx) , 0, the LRO con guration s could become a stable ‘‘ground-state structure,’’ whereas DHF (sx ) . 0 means that the ordered structure s is unstable with respect to phase separation. According to their calculations for a Au50 Ni50 alloy, DHF (L10 ) 5 176.8 meV/atom and dEord (L10) 5 247.5 meV/atom. Therefore, a Au50 Ni50 alloy can develop an L10-type SRO, but no LRO under normal equilibrium conditions. Experimental investigations of ordering and phase separation in Au-Ni alloys have also been extensive, and the literature results pertinent to the present study are brie y summarized here. LRO structures have been observed in Au-Ni alloy thin lms.[13–16] Khan and Francombe[13] rst observed both L12 and L10 LRO structures in Au 15 at. pct Ni alloy thin lms having a thickness of 60 to 70 nm, which were annealed at 500 7 C for 1 hour. This annealing temperature was inside the miscibility gap but very close to the miscibility gap VOLUME 30A, MARCH 1999—707
boundary. No ordered structures were found in thin- lm specimens annealed at 400 7 C and 450 7 C for 1 hour. The thin lms were sputter deposited and epitaxially grown at ;400 7 C onto cleaved surfaces of NaCl. Fedot’ev et al.[14] observed a AuNi3 ordered structure in electrodeposited thin lms (thickness unknown) of Au-Ni alloys with 74 to 77 at. pct Ni. Outside this narrow composition range, the deposited thin lms did not form any LRO structure. Similarly, Shimizu and Tanabe[15] also observed ‘‘metastable intermediate phases which probably have similar structures to the phases of AuNi or AuNi3’’ in thin lms (;100-nm thick) electrodeposited in a citric acid–cyanide acidi ed bath at 50 7 C. The lms were not annealed and the ordered structures were observed in the composition range from 45 to 95 at. pct Ni. Dynna et al.[16] recently reported the formation of an L10 LRO structure in equiatomic AuNi thin lms (;11-nm thick) grown by molecular-beam epitaxy (MBE) at room temperature on Au(001). The thin lms grown by alternating deposition of exact monolayers of Au and Ni possessed an L10 LRO structure free of periodic antiphase boundaries, whereas the lms grown by a less controlled process formed an L10 LRO structure with periodic antiphase boundaries. None of the previous results can be taken as evidence for the existence of transient LRO structures in bulk Au-Ni alloys, because all of the results were found in thin lms. Many observed metastable or even ‘‘forced’’ structures in thin lms were often not found in bulk alloys. For example, Liu and Singh[17] were able to produce bcc cobalt thin lms epitaxially grown on GaAs substrates; this bcc structure could only exist in lms with thicknesses less than 36 nm. In cobalt bulk specimens, the bcc structure was not found (e.g., Zhao and Notis[18]). One research group[19–23] reported that they observed both L10 and L12 LRO in bulk Au-Ni alloys. However, the ordered structures were not observed during the decomposition process; instead, they were found during the reversion process. Sanadze and Gulyaev[19,20,21] started with a twophase (Au-rich and Ni-rich) mixture structure at room temperature and observed the formation of ordered structures during heating the specimens to higher temperatures. They solution-treated Ni-Au alloys of 0.7 to 6.7 at. pct Au at 900 7 C for 16 hours, and then annealed the alloys at 500 7 C for 4 hours and subsequently quenched them to room temperature. They reported that all the alloys were in a two-phase state at room temperature. They then applied a so-called successive quenching method, i.e., they heated the specimens to different temperatures and quenched them ‘‘instantly’’ in water. (No information was given as to how long they kept the specimens at each temperature). It was reported from X-ray diffraction results that both L10 and L12 ordered structures formed in these alloys at temperatures from ;550 7 C to ;900 7 C (note that most of the temperature range was above the miscibility gap). Sanadze and Gulyaev[22] subsequently studied a Ni-8.82 at. pct Au alloy in a similar manner, i.e., they started with a two-phase structure and isothermally annealed it at 500 7 C and monitored the structure change. They observed, again, both L10 and L12 LRO structures. Similar observations were made on a Ni-10 at. pct Au alloy at 550 7 C, 600 7 C, and 725 7 C.[23] Sanadze et al.[24] attempted, but failed to nd similar LRO structures during decomposition (from a single phase) of the same Ni-10 at. pct Au alloy. Okamoto and Massal708—VOLUME 30A, MARCH 1999
ski[25] attributed the formation of these ordered phases to the low purity of the starting materials (99.9 pct Au and an unknown purity of Ni) of Sanadze and Gulyaev. Although Sanadze and Gulyaev’s results were not taken as direct evidence for the existence of transient LRO (because the LRO structures were found only in a path opposite to that predicted by simulations), their results at least suggest the possible existence of (transient) metastability of both L10 - and L12 -type LRO structures in Au-Ni bulk alloys. The spinodal decomposition process in Au-Ni alloys has been studied intensively.[26–36] Spinodal modulation was observed along the {001} directions, and the coherent spinodal line was generally agreed to be ;225 7 C for Au-Ni alloys with Ni compositions ranging from 20 to 80 at. pct. Discontinuous precipitation in Au-Ni alloys has been studied by several groups,[30,37– 44] but none of these investigations was detailed enough to allow construction of a TTT diagram for the discontinuous precipitation process. Because the transient ordered states, if they exist, should appear before spinodal decomposition or before discontinuous precipitation, according to previous simulation results, it was believed worthwhile to study the discontinuous precipitation kinetics and the spinodal decomposition kinetics so that the temperature and time regimes in which the transient ordered states may exist could be determined. In this connection, TTT diagrams were constructed for these two Au-Ni alloys. II.
EXPERIMENTAL PROCEDURES
Two Au-Ni alloys were made for this study. Au-50 at. pct Ni is the stoichiometric composition for an L10 ordered structure; thus, if a transient LRO state exists, it will very likely be L10 . The other alloy, Au-40 at. pct Ni, has been widely studied in the literature and it is a nonstoichiometric composition for L10 or L12 ordered states; thus, it is of interest to know what kind of transient LRO structures this alloy may have. The Au-Ni specimens were prepared from spongy Au of 99.999 pct purity and a nickel bar of 99.999 pct purity. The starting materials were weighed and placed into a quartz tube which was sealed with a vacuum of ;5 3 1027 torr. It was then put into a furnace and heated to 1175 7 C for melting and casting. Periodic turning of the quartz capsule was done in order to prevent Au from settling at the bottom (due to the high density of Au). The Au-40 at. pct Ni alloy was solidi ed by quenching the capsule in water without breaking it. The capsule was then placed into a furnace at 900 7 C for homogenization, which lasted 13 days. The bullet-shaped alloy piece was then quenched in water by breaking the capsule and was then cold rolled into a sheet of ;0.15 to 0.2 mm in thickness by using many passes, with each pass producing only a small reduction in thickness. The cold-rolled thin sheet was then sealed in quartz tubes with a vacuum of ;5 3 102 7 torr and rehomogenized and solution treated at 900 7 C for 20 days. The sheet was then quenched in an ice-brine solution of ;15 wt pct NaCl by breaking the capsule. Due to the large reduction during cold rolling and to the prolonged annealing at 900 7 C, abnormal (secondary) recrystallization took place, resulting in an average grain size of ;2 mm. Thus, each TEM sample (3-mm diameter) was essentially a single crystal. METALLURGICAL AND MATERIALS TRANSACTIONS A
alloys was performed in a heat-treating salt bath for temperatures at or higher than 200 7 C and in a silicone oil bath for temperatures lower than 200 7 C. All annealed specimens were then quickly quenched in the ice-brine solution. The TEM specimens were punched from the annealed thin (0.1-to 0.2-mm thick) sheets and then jet-polished in a molar solution of LiCl in methanol at ;250 7 C. All TEM specimens were examined in a PHILIPS* 400T analytical *PHILIPS is a trademark of Philips Electronic Instruments Corp., Mahwah, NJ.
electron microscope operated at 120 kV. Hot-stage in situ annealing was also conducted for many Au-Ni alloy samples. III.
EXPERIMENTAL RESULTS
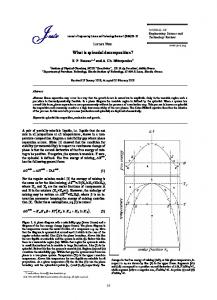
A. General Kinetics Fig. 1—TTT diagram of a Au-50 at. pct Ni alloy determined from TEM characterization. The C curve for spinodal decomposition is based on Woodilla and Averbach.[29]
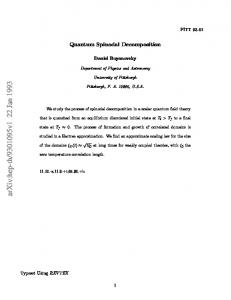
Fig. 2—TTT diagram of a Au-40 at. pct Ni alloy determined from TEM characterization. The C curve for spinodal decomposition is based on Woodilla and Averbach.[29]
The Au-50 at. pct Ni alloy was processed in a slightly different way. It was melted and cast twice in order to assure homogenization. After melting and casting, the alloy bullet was directly cold-rolled by many passes (without prehomogenization) to 0.1 to 0.18 mm. The cold-rolled specimen was sealed in a quartz capsule at ;5 3 102 7 torr and then put into a furnace for solution and homogenization treatment at 900 7 C for 20 days. The sample was then quenched in the ice-brine solution by breaking the capsule. The average grain size was also ;2 mm. The alloy samples were solution treated at a temperature above the miscibility gap and were rapidly quenched in the ice-brine solution to retain the high-temperature structure to room temperature. Annealing was performed at different temperatures for different lengths of time in order to catch the possible transient ordered states. The annealing for both METALLURGICAL AND MATERIALS TRANSACTIONS A
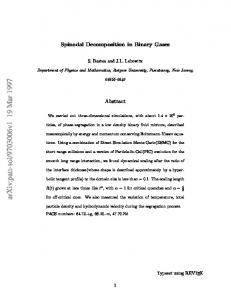
Experimental results for the overall transformation kinetics of the two Au-Ni alloys are summarized in the TTT diagrams shown in Figures 1 and 2. The C-curve for spinodal decomposition was based on a careful study by Woodilla and Averbach.[29] A spinodal decomposition structure was observed in specimens of both alloys annealed at both 200 7 C and 100 7 C. The selected-area diffraction patterns (SADPs) taken from the Au-50 at. pct Ni alloy specimens annealed at 200 7 C for 30 ks (8.3 hours), 350 ks (4 days), and 2800 ks (32 days) are shown in Figure 3. The spinodal ‘‘satellites’’ extended far from the fundamental re ections, which indicates a very short modulation wavelength (l). The l did not vary signi cantly, even after annealing at 200 7 C for 32 days (from the general kinetics shown in Figures 1 and 2, it would take more than a year at 200 7 C for the equilibrium Au-rich and Ni-rich phases to form by discontinuous precipitation). The spinodal satellites did not show up as distinct spots, which indicates that the wavelength was very irregular. The spinodal decomposition process in the Au-40 at. pct Ni alloy was very similar to that of the Au-50 at. pct Ni alloy. Note that these two Au-Ni alloys underwent natural aging, i.e., spinodal decomposition occurred at room temperature several days after the specimens were quenched. This natural aging phenomenon made it dif cult to handle specimens used for the transient ordering study, because if spinodal decomposition had already taken place at room temperature, there was no chance of nding the transient congruent ordering phenomenon, according to early simulations. In this connection, special attention was paid to specimen handling. One approach was to jet-polish and examine specimens immediately after they were heat treated and quenched. Every effort was made to shorten the time period between specimen preparation and TEM examination. Very often the rst SADP was taken within several minutes after the specimen was quenched. The other way to handle specimens was to store them in a liquid nitrogen Dewar ask. After jet polishing, TEM specimens were wrapped in thin Al foils and put into liquid nitrogen. At the time of TEM examination, a sample was taken out of liquid nitrogen, unwrapped from the Al foil, washed in ethanol at room temperature, and then put into the microscope. A typical morphology for the discontinuous precipitation products formed in bulk-annealed Au-Ni alloy specimens VOLUME 30A, MARCH 1999—709
Fig. 3—[001] zone SADPs of Au-50 at. pct Ni alloy specimens annealed at 200 7 C, showing the spinodal ‘‘satellites’’: (a) 30 ks (;8.3 h), (b) 350 ks (4 days), and (c) 2800 ks (32 days).
is shown in Figure 4, in which the dark regions were the Au-rich phase and the bright areas were the Ni-rich phase, which had been practically polished away during the jetpolishing process. In bulk-annealed Au-Ni alloy samples, only discontinuous precipitation and spinodal decomposition were observed in the time and temperature regimes investigated, and the overall kinetics can be well described by the TTT diagrams of Figures 1 and 2. B. Attempts to Find Transient Ordered Phases in Au-Ni Alloys Various attempts were made to test for the possible existence of the transient LRO states in the two Au-Ni alloys. 710—VOLUME 30A, MARCH 1999
1. Attempt 1—bulk anneal at 700 7 C This annealing temperature was very close to the miscibility gap boundary. This experiment was designed in consideration of the fact that Khan and Francombe[13] observed LRO phases in Au-15 at. pct Ni alloy thin lms annealed at a temperature very close to the miscibility gap boundary, and the fact that Sanadze and Gulyaev[19–23] observed both L10 and L12 LRO structures during heating initially two-phase– mixture structures up to high temperatures. Solution-treated (900 7 C for 10 minutes) specimens were quenched in the ice-brine solution and then annealed at 700 7 C for different periods of time, which spanned from 5 seconds to 1.8 ks in very small intervals, as shown in Figures 1 and 2. In all these bulk-annealed samples, no LRO structure was observed, except in the very thin edges of the METALLURGICAL AND MATERIALS TRANSACTIONS A
4. Attempt 4—in situ hot-stage anneal at 525 7 C This experiment was similar to that in attempt 2, except that it was carried out in situ on a hot stage; thus, thin TEM samples were used in the anneal rather than bulk samples, as in attempt 2. In consideration of the fact that the atomic size mismatch is ;14 pct, thin samples might help in releasing the strain energy and might, thus, promote the formation of LRO structures. Still, no LRO structure was found, except at the very thin edges of the TEM foils, in the in situ anneal for times of up to 40 minutes, when discontinuous precipitation appeared. 5. Attempt 5—in situ hot-stage solution treatment and anneal Even though ice-brine–quenched samples showed no evidence of spinodal decomposition, there was a slight possibility that very weak spinodal decomposition occurred during the quenching process. To avoid the complication of such a spinodal decomposition process, in situ solution treatment was performed for both alloys. Because the solvus temperature (;725 7 C and 765 7 C for the Au-40 at. pct Ni and Au-50 at. pct Ni alloy, respectively) is different, slightly different temperatures were used for the solution and the annealing treatment, as described subsequently. a. Au-50 at. pct Ni: 823 7 C for 10 minutes ® 682 7 C for 30 minutes ® 147 7 C for 30 minutes A thin TEM sample was quickly heated to 823 7 C in the hot stage and held at this temperature for 10 minutes for solution treatment. The temperature was then lowered to 682 7 C and held for 30 minutes (this anneal was similar to attempt 1). The annealing temperature was then suddenly lowered to 147 7 C and held for 30 minutes. Both the SADPs and the images were monitored constantly during the isothermal anneals and also during the cooling processes, and no transient LRO phase was found except in very thin edges of the TEM foils.
Fig. 4—Morphology of discontinuous precipitates in annealed bulk AuNi alloy samples:(a) Au-50 at. pct Ni, annealed at 593 7 C for 300 s; and (b) Au-40 at. pct Ni, annealed at 450 7 C for 3 ks.
TEM foils where the L10 LRO structure was sometimes observed, as shown in Figure 5. Discontinuous precipitation was observed in the Au-50 at. pct Ni specimens annealed for 1.2 ks and longer. 2. Attempt 2—bulk anneal at 500 7 C This approach was similar to attempt 1, only the annealing temperature was changed to 500 7 C, an intermediate temperature. Again, no LRO structure was found, except sometimes in the very thin edges of the TEM foils. 3. Attempt 3—in situ hot-stage anneal at 165 7 C This experiment was performed on the Au-50 at. pct Ni alloy. The annealing temperature was intentionally chosen to be below the coherent spinodal temperature (;225 7 C) of this alloy. An in situ anneal of a solution-treated and icebrine–quenched specimen was carried out at 165 7 C. Constant monitoring of the SADP and the image was exercised until the spinodal satellites were clearly visible (;1 hour). No LRO structure was detected. METALLURGICAL AND MATERIALS TRANSACTIONS A
b. Au-40 at. pct Ni: 758 7 C for 8 minutes ® 650 7 C for 15 minutes ® 160 7 C for 30 minutes The treatment was similar to the 50 at. pct Ni alloy; no LRO effects were found except in the very thin edges of the TEM foils. All of the aforementioned attempts were implemented to nd the transient ordered phases by a decomposition process of a solution-treated single-phase alloy, and all of them failed to nd the presence of any LRO phases except, sometimes, at the very thin edges of the TEM foils. 6. Attempt 6—reversion (heating) experiment This attempt was made to reproduce the nding of Sanadze and Gulyaev[19–23] of LRO phases by heating twophase (decomposed) specimens to high temperatures. A specimen was rst annealed at 200 7 C for 32 days, producing a spinodally decomposed two-phase structure (the corresponding SADP is shown in Figure 3(c)). This specimen was then loaded on the TEM hot stage and in situ annealed at 490 7 C for time periods of up to 6.3 ks (1.75 hours). The result of this reversion experiment is shown in Figure 6, in which Figures 6(a) through and (d) were taken at about 0 seconds (before heating) and at 600 seconds, 3.6 ks (1 hour), and 5.4 ks (1.5 hours) after heating, respectively. The spinodal satellites can be clearly seen, and some of them are shown by arrows in Figure 6(a). In addition, diffuse intensity around the {011} re ections seemed related to a VOLUME 30A, MARCH 1999—711
faceted. The L10 ordered phase formed mostly along the interfaces between the Ni-rich precipitates and the matrix or on the surfaces of the Ni-rich precipitates (Figure 8(b)). A very small fraction of the ordered-phase particles did not seem to be associated with the Ni-precipitates, and they probably formed on the free surfaces of the sample. This reversion experiment was repeated on another sample that was rst spinodally decomposed at 200 7 C for 30 ks (8.3 hours) and then in situ annealed at 490 7 C. The L10 ordered structure was also found. IV.
Fig. 5—[001] zone SADP from the very thin edge of the TEM foil of a Au-50 at. pct Ni alloy specimen annealed at 700 7 C for 20 s, showing the {011} type superlattice re ections from the L10 LRO phase. The streaking resulted from {111} twinning and strain energy associated with the twins.
SRO effect, as shown by Wolverton and Zunger.[9] After ;600 seconds of annealing, a weak L10 ordering effect can be found in the specimen, as shown in Figure 6(b). The {011}-type superlattice re ections from the z-variant (axis perpendicular to the TEM foil) of the L10 ordered phase were much stronger than these from the {001} type from the x- and y-variants; but the {001} re ections, even though very weak, could still be seen, as indicated by small arrows. Re ections such as the one indicated by a long arrow in Figure 6(b) were from the {111} twinning effect. This kind of twinning re ection usually appears in off-axis [001] zone SADPs and has been discussed in detail by Pashley and Stowell.[45] After a 1-hour in situ annealing, the superlattice re ections became stronger, as shown in Figure 6(c); and, after a 1.5-hour annealing, the superlattice re ections from the three variants of the L10 can be clearly seen in Figure 6(d). Re ections from the Ni-rich precipitates are shown by arrows in Figure 6(d). After 6.3 ks (1.75 hours) of in situ annealing, the aforementioned specimen was cooled in the microscope by turning off the hot-stage heating current and then reloaded on a double-tilt (conventional) TEM specimen holder for room-temperature examination. The result is shown in Figures 7 and 8. A lightly exposed [001] zone SADP (Figure 7(a)) showed the re ections from both the alloy matrix and the Ni-rich precipitates (illustrated by arrows); the heavily exposed one (Figure 7(b)) showed the superlattice re ections. The z-variant {011}-type re ections could be seen, whereas the {001}-type re ections were very weak. These weak {001} re ections could be seen more clearly in off-axis SADPs, as shown in Figure 7(c). Figure 8 is the corresponding bright- eld (Figure 8(a)) and central dark- eld (Figure 8(b)) images under two-beam conditions using a (011) superlattice re ection. The Ni-rich precipitates can be seen in Figure 8(a), and they were somewhat
712—VOLUME 30A, MARCH 1999
DISCUSSION
The L10 ordered structure is made up of alternating layers of Au and Ni, and it is a tetragonal phase. The tetragonality can be measured by the c/a ratio (c is the lattice parameter in the z direction (perpendicular to the layers), and a is the lattice parameter in the x or y (in layer) direction), which was determined to be ;0.931 to 0.938[46,47,48] for the equiatomic CuAu(I) phase (an L10 ordered structure). For such a c/a ratio, the cubic (fcc)–to–tetragonal (L10 ) transformation resulted in a very high strain energy. In order to accommodate this high strain energy, the L10 ordered phase usually forms {110}-type twins.[3,49] The atomic-size mismatch for the Au-Ni system (13.6 pct) is even higher than that of the Au-Cu system (11.4 pct); thus, it may be expected that the L10 phase in the Au-Ni system might also have a high tetragonality. Lu[50] recently obtained a c/a value of 0.913 for Au-Ni alloys from his ab initio calculations. In this consideration, the L10 ordered phase in AuNi alloys might appear as {110}-type twins if it formed intragranularly in the disordered fcc matrix. Alternatively, it might appear along grain boundaries, interphase interfaces, or on surfaces, where stress can be relaxed. The L12 ordered structure is cubic, and its lattice parameter is only ;0.1 pct smaller than that of the disordered fcc phase in the Au3 Cu alloy.[51] It is expected that, in the AuNi system, a similar situation might be observed. Thus, the fcc-to-L12 transformation should have less dif culty with respect to stress relaxation. It should be noted that not all disordered miscibility gaps can have transient LRO phases. Transient LRO can only appear in systems where the free energy of the ordered phases is below that of the disordered solid solution, but is still higher than that of the equilibrium two-phase mixture. For the Au-Ni system, recent ab initio calculations showed that the formation enthalpy of the L10 and the L12 ordered structures (DHF (L10) and DHF (L12)) is lower than that of the respective random solutions.[11,12] If these calculations are reliable, then the L10 and the L12 ordered phases are thermodynamically feasible as transient LRO phases. The observation of the L10 LRO structure in the very thin edges of TEM foils seemed relatively easy to understand. At the very thin edges, the strain energy could be relaxed; thus, the chemical contribution to the Gibbs free energy might dominate, resulting in the L10 LRO structure. The SADP of Figure 5 looks similar to that (Figure 8 in Dynna et al.[16] ) observed in the equiatomic AuNi thin lms grown by MBE, i.e., only the z-variant {011}-type re ections appeared. This indicates that in the very thin edges of the TEM foils, the Au atom layers and Ni atom layers were
METALLURGICAL AND MATERIALS TRANSACTIONS A
Fig. 6—SADPs from a Au-50 at. pct Ni specimen that was rst spinodally decomposed at 200 7 C for 32 days and then in situ annealed at 490 7 C in a TEM hot stage holder: (a) before heating, showing spinodal satellites (shown by arrows) and SRO diffuse intensity around {011}; (b) after ;10 min annealing, showing the appearance of order re ections; (c) after ;1 h annealing, showing strong L10 LRO superlattice re ections; and (d ) after ;1.5 h annealing, clearly showing the re ections of the L10 ordered phase.
aligned parallel to the plane of the TEM foils (and were perpendicular to the electron beam). Only in this con guration can the strain energy be relaxed. In thicker thin lms, strain could not be suf ciently relaxed inside the fcc matrix. The L10 LRO structure could only form along grain boundaries or interphase interfaces. Moreover, for nonstoichiometric compositions (not 25, 50, or 75 at. pct Ni), atomic diffusion seemed necessary for the formation of the LRO structures. In explaining the observation of the LRO structures in Au-15 at. pct Ni alloy thin lms, Khan and Francombe[13] stated that ‘‘The fact that they (both the L10 and the L12 ordered structures) were observed in the present work, but not in Fukano’s studies on lms (70 nm) of essentially similar composition (Au-20 at. pct Ni), may be explained in the following way. The comparatively low substrate temperatures used in preparing the sputtered epitaxial lms may be expected to produce structures with small crystalline size and large strain and free surface energy. Heat treatment at temperatures higher than those used during thin- lm deposition leads to rapid
METALLURGICAL AND MATERIALS TRANSACTIONS A
recrystallization and atom diffusion. If, at the annealing temperatures used, the energies of the superlattice structures are intermediate between those of the disordered solid solution and the precipitated structure, the Ni atoms will diffuse into lattice sites consistent with the NiAu3 or NiAu ordered states. The tendency to precipitation would favor a progressive increase in the formation of Ni-Ni pairs and explain the observed transformation: disordered alloy ® NiAu3 ® NiAu ® Ni-rich precipitate. Since Fukano’s alloy lms were prepared by evaporation and homogenized at 700 7 C, subsequent annealing at much lower temperatures (;500 7 C) would be unlikely to promote atom diffusion of the type needed for complete superlattice formation.’’ This is probably a valid explanation for the observation in thin lms. The electrodeposited thin lms examined by Fedot’ev et al.[14] and Shimizu and Tanabe[15] also had high inhomogeneity as well as a very small grain size. The atom diffusion process needed to form the composition and structure of the ordered phases can be easily realized at the abundant grain boundaries present in these specimens.
VOLUME 30A, MARCH 1999—713
Fig. 8—(a) Bright- eld and (b) central dark- eld image pair using the (011) superlattice re ection, showing (a) the intragranular Ni-rich precipitates and (b) ordered phase particles. The specimen was the same as that used for Fig. 7.
Fig. 7—SADPs from the same specimen as in Fig. 6 but cooled to room temperature after ;1.75 h in situ annealing and reloaded on a double tilt conventional TEM specimen holder for room temperature examination: (a) lightly exposed, showing the re ections from the Ni-rich precipitates; (b) heavily exposed, showing the superlattice re ections; and (c) off-axis SADP, showing the {001} type re ections (one of them shown by an arrow). 714—VOLUME 30A, MARCH 1999
Sanadze and Gulyaev[19–23] used a similar explanation for their observation of LRO structures in bulk Au-Ni alloy specimens found during the reversion process. In all their studies, they monitored the composition redistribution by means of lattice parameter changes and attributed the formation of the ordered structures to the kinetics of Au and Ni atom redistribution at interphase interfaces during heating. According to the Au-Ni phase diagram, as the temperature increases, the solubility of Au in Ni (and vice versa) increases. Thus, when an initially two-phase alloy was heated from room temperature, Au atoms in the Au-rich phase should diffuse into the Ni-rich phase and vice versa, and the phases should nally combine together. When the composition at the interphase interfaces locally reached the concentration of Ni3 Au, NiAu, and NiAu3, the respective ordered phase appeared. Note that at interphase interfaces the strain energy can be relaxed. The present observation of the L10 LRO structure in the Au-50 at. pct Ni alloy during the reversion experiments METALLURGICAL AND MATERIALS TRANSACTIONS A
Table I.
Summary of the Observations from the Present Work and from the Literature and Possible Explanations
Sample Thickness Very thin lms
Homogeneity homogeneous
Observation L10
Evidence MBE thin lms (11 nm) of Dynna et al.(16) very thin edges of TEM sample of this work
Possible Explanation strain energy can be relaxed
Thicker thin lms
homogeneous
no L10
thicker regions of the TEM foils of this work thin lms (70 nm) of Fukano[26]
insuf cient strain relaxation
Thicker thin lms
inhomogeneous and/or small grain size
L10
thin lms (60 to 70 nm) of Khan and Francombe[13] thin lms (;100 nm) of Shimizu and Tanabe[1 5] reversion experiment (attempt 6) of this work
equiatomic compositions could be reached locally at grain boundaries and interphase interfaces strain could be relaxed at these locations
Bulk alloys
homogeneous
no L10
attempts 1 through 5 of this work attempt by Sanadze et al.[24 ]
strain could not be relaxed
Bulk alloys
inhomogeneous
L10
reversion experiments by Sanadze and Gulyaev[19– 23]
equiatomic compositions could be reached locally at grain boundaries and interphase interfaces strain could be relaxed at these locations
might be explained in a similar manner. During the reversion annealing, when the Ni-rich phase started to precipitate from the matrix, diffusion processes which occurred at the Ni-rich phase/matrix interfaces could promote L10 LRO phase formation by forming local regions with an equiatomic AuNi composition. The strain energy associated with the L10 LRO phase formation could be relaxed at the interfaces. It is clear from Figure 8 that the L10 ordered phase regions were mostly associated with the Ni-rich precipitates. The vacuum in the TEM was not particularly clean and, with electron beam heating, it may be arguable that impurities might have caused the L10 ordering in the thinnest sections of the TEM foils. However, such an argument cannot explain the formation of the L10 LRO in thick heterogeneous samples. The alloys used in the present study were of very high purity and the TEM samples were essentially single crystals. Thus, the L10 LRO structure produced in these high-purity single-crystal samples during the reversion experiments suggest that Sanadze and Gulyaev[19–23] observation in bulk samples were accurate and not due to impurity effects. If we accept this argument, it is reasonable to conclude that transient LRO did exist in the Au-Ni bulk alloys. In this connection, at temperatures inside the miscibility gap, the free energy of the L10 and the L12 ordered phases must be intermediate between that of the corresponding disordered solid solution and that of the equilibrium two-phase mixture. This result is consistent with recent ab initio calculations.[9,11,12] The transient ordering phenomenon, thus, can be used to check the reliability of the calculated free energy of metastable phases which do not appear in equilibrium-phase diagrams. Due to the high strain energy associated with the L10 LRO phase formation, only in very thin edges of TEM foils or in very thin lms could congruent L10 ordering take place. In bulk Au-Ni alloy samples, congruent (composition-invariant) L10 ordering could not take place intragranMETALLURGICAL AND MATERIALS TRANSACTIONS A
ularly. When the local compositions at grain boundaries and interphase interfaces reached equiatomic AuNi, the L10 LRO phase can be formed in bulk samples. Experimental observations on the L10 LRO phase formation and possible explanations are summarized in Table I. Most observations of LRO structures by Sanadze and Gulyaev[19–23] were made at very high temperatures (above the miscibility gap) during heating of two-phase alloys. From phase stability, LRO is not possible at temperatures above the miscibility gap, because the free energy of the disordered phase is the lowest at these temperatures (if the equilibrium-phase diagram is correct). Thus, the experimental observations of Sanadze and Gulyaev[19–23] also suggested that a diffusion (kinetic) process might have played an important role in governing the formation of the L10 LRO phase. It is currently unknown whether or not a stoichiometric Au75 Ni25 or Au25 Ni75 alloy will undergo an fcc-to-L12 transformation without involving any diffusion process, because of the relatively low strain energy. It is worth further investigation to test whether such an L12 congruent ordering process can take place in Au-Ni alloys.
V.
CONCLUSIONS
1. A systematic study was performed on Au-40 at. pct Ni and Au-50 at. pct Ni alloys in order to test for the possible existence of transient LRO states within a disordered miscibility gap. An L10 LRO phase was found in the Au-50 at. pct Ni alloy when spinodally decomposed specimens were reannealed at ;490 7 C on a TEM hot stage. This observation, together with the literature results, indicates that a transient ordering phenomenon did exist in the Au-Ni system, although it appeared only during a reversion process. 2. The free energy of the L10 and L12 ordered phases at VOLUME 30A, MARCH 1999—715
low temperatures must be intermediate between that of the disordered solid solution and that of the equilibrium two-phase mixture, which is consistent with the results of recent ab initio calculations. The transient ordering study is a good way to check the reliability of theoretical calculations of the free-energy state of metastable ordered phases. 3. Various attempts, by means of both bulk annealing and in situ TEM hot-stage annealing, have been made to nd transient ordered phases during a decomposition process of a single-phase solid solution. No LRO structures have been found, except at the very thin edges of the TEM foils. The results indicated that elastic strain energy played an important role in transient-phase formation in Au-Ni alloys. 4. The TTT diagrams for the two Au-Ni alloys were constructed based on TEM characterization. In bulk annealed samples, only discontinuous precipitation and spinodal decomposition were observed. 5. It was found that both the Au-40 at. pct Ni and Au-50 at. pct Ni alloys underwent natural aging, i.e., spinodal decomposition took place at room temperature several days after the specimens were quenched. Future investigators of these or similar Au-Ni alloys should pay special attention to the specimen handling process. ACKNOWLEDGMENTS This work was supported by Lehigh University under university scholarships and Horner fellowships to JCZ. The authors greatly appreciate the valuable discussions with Drs. D.E. Laughlin, A.G. Khachaturyan, D.B. Williams, L.Q. Chen, Y. Wang, and A.M. Ritter. REFERENCES 1. G.P. Srivastava, J.L. Martins, and A. Zunger: Phys. Rev., 1985, vol. B31, pp. 2561-64. 2. A.A. Mbaye, L.G. Ferreira, and A. Zunger: Phys. Rev. Lett., 1987, vol. 58, pp. 49-52. 3. L.G. Ferreira, A.A. Mbaye, and A. Zunger: Phys. Rev., 1988, vol. B37, pp. 10547-10570. 4. A. Zunger: in Statics and Dynamics of Alloy Phase Transformations, P.E.A. Turchi and A. Gonis, eds., Plenum Press, New York, NY, 1994, pp. 361-419. 5. L.-Q. Chen and A.G. Khachaturyan: Phys. Rev., 1991, vol. B44, pp. 4681-84. 6. A.G. Khachaturyan: Sov. Phys. Solid State, 1968, vol. 9, pp. 204051. 7. A.G. Khachaturyan: Theory of Structural Transformations in Solids, Wiley, New York, NY, 1983. 8. L. Reinhard and P.E.A. Turchi: Phys. Rev. Lett., 1994, vol. 72, pp. 120-23. 9. C. Wolverton and A. Zunger: Comput. Mater. Sci., 1997, vol. 8, pp. 107-21. 10. T.B. Wu and J.B. Cohen: Acta Metall., 1984, vol. 32, pp. 861-67. 11. Z.W. Lu, S.-H. Wei, and A. Zunger: Europhys. Lett., 1993 vol. 21, pp. 221-26. 12. Z.W. Lu and A. Zunger: Phys. Rev., 1994, vol. B50, pp. 6626-36. 13. I.H. Khan and M.H. Francombe: J. Appl. Phys., 1965, vol. 36, pp. 1699-1706.
716—VOLUME 30A, MARCH 1999
14. N.P. Fedot’ev, P.M. Vyacheslavov, O.G. Lokshtanova, and E.G. Kruglova: J. Appl. Chem. USSR, 1967, vol. 40, pp. 2167-71. 15. Y. Shimizu and Y. Tanabe: Kinzoku Hyomen Gijutsu, 1976, vol. 27, pp. 20-24. 16. M. Dynna, A., Marty, B. Gilles, and G. Patrat: Acta Mater., 1997, vol. 45, pp. 257-72. 17. A.Y. Liu and D.J. Singh: J. Appl. Phys., 1993, vol. 73, pp. 6189-91. 18. J.-C. Zhao and M.R. Notis: Scripta Metall. Mater., 1995, vol. 32, pp. 1671-76. 19. V.V. Sanadze and G.V. Gulyaev: Sov. Phys. Crystallogr., 1960, vol. 4, pp. 496-502. 20. V.V. Sanadze and G.V. Gulyaev: Sov. Phys. Crystallogr., 1960, vol. 4, pp. 646-54. 21. V.V. Sanadze: Sov. Phys. Crystallogr., 1964, vol. 8, pp. 695-700. 22. V.V. Sanadze and G.V. Gulyaev: Sov. Phys. Dokl., 1965, vol. 9, pp. 753-55. 23. V.V. Sanadze and G.V. Gulyaev: Sov. Phys. Crystallogr., 1967, vol. 11, pp. 499-503. 24. V.V. Sanadze, Yu.I. Stamateli, and E.R. Kuteliya: Sov. Phys. Crystallogr., 1970, vol. 15, pp. 408-12. 25. H. Okamoto and T.B. Massalski: in Phase Diagrams of Binary Gold Alloys, H. Okamoto and T.B. Massalski, eds., ASM INTERNATIONAL, Metals Park, OH, 1987, pp. 193-208. 26. Y. Fukano: J. Phys. Soc. Jpn., 1961, vol. 16, pp. 1195-1204. 27. R.M. Fisher and J.D. Embury: Proc. 3rd Eur. Reg. Conf. on Electron Microscopy, Prague, 1964, vol. A, pp. 149-50. 28. S.C. Moss: in Local Atomic Arrangements Studies by X-Ray Diffraction, J.B. Cohen and J.E. Hilliard, eds., Gordon & Breach, New York, NY, 1966, pp. 95-122. 29. J.E. Woodilla, Jr. and B.L. Averbach: Acta Metall., 1968, vol. 16, pp. 255-63. 30. G. Borelius: Phys. Scripta, 1971, vol. 4, pp. 127-31. 31. R. Gronsky, R. Sinclair, and G. Thomas: Acta Metall., 1976, vol. 24, pp. 789-96. 32. R. Gronsky and G. Thomas: AIP Conf. Proc., 1979, vol. 53 pp. 26668. 33. D.J.H. Cockayne and R. Gronsky: Phil. Mag., 1981, vol. A44, pp. 159-75. 34. C.K. Wu: Trans. Jpn. Inst. Met., 1984, vol. 25, pp. 663-71. 35. H. Hofer and P. Warbichler: Z. Metallkd., 1985, vol. 76, pp. 11-15. 36. Y. Asai, Y. Isobe, K. Nakai, C. Kinoshita, and K. Shinohara: J. Nucl. Mater., 1991, vols. 179–181, pp. 1050-52. 37. W. Heike and H. Kessner: Z. Anorg. Allgem. Chem., 1929, vol. 182, pp. 272-80. 38. W. Koster and W. Dannohl: Z. Metallkd., 1936, vol. 38, pp. 248-53. 39. H. Bohm: Metall, 1959, vol. 13, pp. 929-39. 40. F.R.L. Schoening and P.J. Flanders: Phil. Mag., 1962, vol. 7, pp. 1069-71. 41. J. Ordonez, A.A. Johnson, and K. Mukherjee: Nature, 1968 vol. 217, pp. 442-44. 42. A.A. de Keijzer and C. de Groot: Proc. Kon. Ned. Akad. Wetensch., 1970, Ser. B, vol. 73, pp. 46-63. 43. W. Gust, B. Predel, and T. Nguyen-Tat: Z. Metallkd., 1976, vol. 67, pp. 110-17. 44. K. Mukherjee, T.W. Hsu, and M. Kato: Phys. Status Solidi, 1984, vol. A81, pp. 439-44. 45. D.W. Pashley and M.J. Stowell: Phil. Mag., 1963, vol. 8, pp. 160532. 46. M. LeBlanc, K. Richter, and E. Schiebold: Ann. Phys., 1928, vol. 86, pp. 929-1005. 47. R. Hultgren and L. Tarnopol: Trans. AIME, 1939, vol. 133, pp. 22837. 48. M.I. Novgorodova, A.I. Tsepin, A.I. Gorshkov, I.M. Kudrevish, and L.N. Vyalsov: Zap. Vsc. Mineral. Ova, 1977, vol. 106 (5), pp. 54052. 49. V.I. Syutkina and E.S. Jakoveva: Phys. Status Solidi, 1967, vol. 21, pp. 465-80. 50. Z.W. Lu: University of California at Davis, Davis, CA, private communication, 1995. 51. H. Okamoto, T.B. Massalski, D.J. Chakrabarti, and D.E. Laughlin: Bull. Alloy Phase Diagrams, 1987, vol. 8, pp. 454-74.
METALLURGICAL AND MATERIALS TRANSACTIONS A