Barbara Hagerman. X. X. Fishhawk (Clatsop). X. X. X. X. X. Garrison (Curry). X. X ... Dave & Linda Lauck. Sunset (Clatsop). X. X. X. X. N. Tenmile/Tenmile (Coos).
Oregon Lake Watch 2000 Final Report
Mark Sytsma and Carrie Haag Center for Lakes and Reservoirs Portland State University
May 2001
Oregon Lake Watch Program Final Report
2000
Executive Summary Nineteen volunteers and several organizations donated 81 hours to monitor water quality at eleven Oregon lakes in the 2000 Oregon Lake Watch (OLW) Program. Monitoring was conducted between January 1, 2000 and December 15, 2000. Most monitoring was conducted during the summer months. The amount of monitoring hours was lower than in previous years because of a lack of funding for the OLW Program. Funding was reinstated mid-year and will carry over into the next OLW monitoring season. While it is often difficult to differentiate annual variation and long-term trends in lake water transparency, some potential trends were identified in the 2000 data. Most of the coastal lakes continued recent trends of increasing Secchi transparency, while Devils Lake exhibited a dramatic decrease after an increasing trend since 1994, and Woahink Lake reversed a declining trend observed since 1993. No overall trend in the Willamette Ecoregion lake water transparency was evident in the OLW data. In the Cascade Ecoregion, Lake of the Woods experienced a slight decrease after observing an increasing trend since 1994 and transparency in Lake Odell has decreased substantially since 1996. Dissolved oxygen concentration was measured in Woahink Lake, Lake of the Woods, Fairview Lake, and Thornton Lake. Oxygen depletion occurred in the hypolimnion of all of these lakes during the summer (except Fairview Lake, which does not have a hypolimnion). A total of 50 lakes in four Oregon Ecoregions have been monitored since the inception of the OLW Program. Although only eleven lakes were monitored in 2000, the dedication and enthusiasm for the OLW Program is high. Data collected from the OLW volunteers is valuable in identifying water quality trends. More comprehensive monitoring coverage and intensive supplemental sampling of selected lakes with incipient water quality problems should be included in an Oregon lake management program. In addition, management strategies should be developed to deal with the problems identified by OLW volunteers.
ii
Oregon Lake Watch Program Final Report
2000
Table of Contents Executive Summary .............................................................................................................i Table of Contents ...............................................................................................................iii List of Tables...................................................................................................................... iv List of Figures ....................................................................................................................iv SECTION 1 INTRODUCTION.......................................................................................... 1 1.1
BACKGROUND ................................................................................................... 1
1.2
VOLUNTEER PARTICIPATION ........................................................................ 1
1.3
METHODS ............................................................................................................ 3
1.3.1
Secchi Disk Depth........................................................................................... 3
1.3.2
Temperature .................................................................................................... 3
1.3.3
Dissolved Oxygen ........................................................................................... 3
SECTION 2 RESULTS...................................................................................................... 5 2.1
RESULTS .............................................................................................................. 5
2.2
Secchi Disk Transparency and Temperature ......................................................... 5
2.2.1
Secchi Disk Transparency: Coastal Ecoregion ............................................... 6
2.2.2
Secchi Disk Transparency: Willamette Ecoregion........................................ 12
2.2.3
Secchi Disk Transparency: Cascade Ecoregion ............................................ 13
2.3
Dissolved Oxygen................................................................................................ 15
2.3.1
Dissolved Oxygen: Coastal Ecoregion.......................................................... 17
2.3.2
Dissolved Oxygen: Willamette Ecoregion.................................................... 17
2.3.3
Dissolved Oxygen: Cascade Ecoregion ........................................................ 19
SECTION 3 QUALITY ASSURANCE PROJECT PLAN ............................................. 20 3.1
Quality Assurance Project Plan (QAPP).............................................................. 20
SECTION 4 RECOMMENDATIONS ............................................................................ 22 4.1
Summary.............................................................................................................. 22
4.2
Recommendations................................................................................................ 22
SECTION 5 REFERENCES............................................................................................ 24
iii
Oregon Lake Watch Program Final Report
2000
List of Tables Table 1. Lakes and Volunteers in the Citizen Lake Watch Program ................................. 2
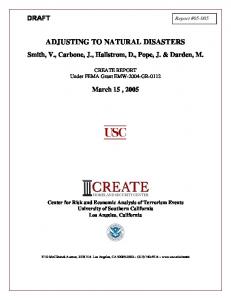
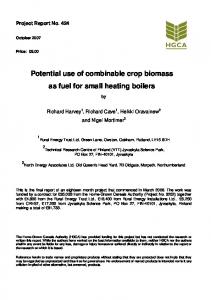
List of Figures Figure 1. OLW Program Lakes and Volunteers from 1988 to December 2000. ............... 3 Figure 2. Hours Volunteered Per OLW Station in 2000 .................................................... 4 Figure 3. 2000 summer (June-August) mean and annual range in Secchi disk depth for lakes in the OLW Program. (The number in parentheses indicates the number of summer Secchi depth measurements used to calculate the average.) Maximums and minimums are for data collected between January 1, 2000 and December 15, 2000. . 6 Figure 4. Bradley Lake summer (June-August) Secchi disk depth mean (± 1 standard error) from 1998 to 2000. ............................................................................................. 7 Figure 5. Cullaby Lake summer (June-August) Secchi disk depth mean (± 1 standard error) from 1989 to 2000. ............................................................................................. 7 Figure 6. Devils Lake summer (June-August) Secchi disk depth mean (± 1 standard error) from 1993 to 2000. ............................................................................................. 8 Figure 7. Mercer Lake summer (June-August) Secchi disk depth mean (± 1 standard error) from 1989 to 2000. ............................................................................................. 9 Figure 8. Siltcoos Lake summer (June-August) Secchi disk depth mean (± 1 standard error) from 1992 to 2000. ............................................................................................. 9 Figure 9. North Tenmile Lake summer (June-August) Secchi disk depth mean (± 1 standard error) from 1994 to 2000.............................................................................. 10 Figure 10. Wohaink Lake summer (June-August) Secchi disk depth mean (± 1 standard error) from 1989 to 2000. ........................................................................................... 11 Figure 11. Woahink Lake monthly disk depth for individual testing sites in 2000. ........ 11 Figure 12. Fairview Lake summer (June-August) Secchi disk depth mean (± 1 standard error) from 1991 to 2000. ........................................................................................... 12 Figure 13. Thornton Lake summer (June-August) Secchi disk depth mean (± 1 standard error) from 1996 to 2000. ........................................................................................... 13 Figure 14. Lake of the Woods summer (June-August) Secchi disk depth mean (± 1 standard error) from 1988 to 2000.............................................................................. 14 Figure 15. Odell Lake summer (June-August) Secchi disk depth mean (± 1 standard error) from 1989 to 2000. ........................................................................................... 14 Figure 16. Dissolved oxygen concentration in the hypolimnion of Woahink Lake from 1994 through 2000...................................................................................................... 17 Figure 17. Dissolved oxygen concentration in the hypolimnion of Thornton Lake from 1996 through 2000...................................................................................................... 18 Figure 18. Dissolved oxygen concentration in the hypolimnion of Lake of the Woods from 1993 through 2000. ............................................................................................ 19 Figure 19. Comparison of volunteer Secchi disk and OLW staff Secchi disk measurements. ............................................................................................................ 21
iv
Oregon Lake Watch Program Final Report
2000
SECTION 1 INTRODUCTION 1.1
BACKGROUND
Oregon lakes are a unique and valuable resource. They provide habitat, drinking water, drainage, recreation, and are an aesthetic feature of the landscape that enhance property values and the quality of life in Oregon. Invasive, non-native aquatic weeds; conflicts among users; and, non-point pollution threaten these uses. Despite multiple functions, benefits and threats, Oregon lakes have received little study; only a few lakes have benefited from the development of thoughtful management plans. Lack of adequate resources and basic limnological information on which to base management decisions stimulated the Oregon Department of Environmental Quality (DEQ) to initiate a volunteer monitoring program for selected lakes in Oregon in 1988. One of the primary goals of this effort was to characterize and identify changes in physical, chemical, or biological characteristics in Oregon lakes. In 1989, funding by the United States Environmental Protection Agency (EPA) allowed an expansion in the DEQ’s Lakes Water Quality Assessment Project to include this newly formed network of lakes and volunteers. The DEQ and various contractors coordinated the program until 1991, when the program was transferred to Portland State University (PSU). Since 1991, DEQ, PSU, and the team of volunteers have worked together to collect and analyze data concerning Oregon lakes. In addition to the volunteer monitoring of lake water quality, the Oregon Lake Watch (OLW) Program included more detailed limnological characterization of selected Oregon lakes by project staff at Southern Oregon University and PSU in 1998. This report contains data collected from January 1, 2000 through December 15, 2000 by volunteers in the OLW. Data from 2000 is discussed in the text and presented in tabular and graphical form in the appendices A and B, respectively. The Lake Watch Quality Assurance/Quality Control (QA/QC) Plan is included in this report as Appendix C. 1.2
VOLUNTEER PARTICIPATION
In 2000, 19 volunteers contributed 81 hours to monitor eleven lakes (Table 1, Figures 1, and 2). The lower number of lakes and volunteers in the program in 2000 reflects the termination of the project period in June 1999. Eight volunteers have continued to monitor lake conditions through the summer and fall of 2000 even though project funding ended in June 1999. Funding was reinstated through the Center for Lakes and Reservoirs in July 2000 and will carry over through the 2001 OLW monitoring period.
1
Oregon Lake Watch Program Final Report
2000
Table 1. Lakes and Volunteers in the Citizen Lake Watch Program Lake (County) Blue Mtn. Ecoregion Morgan (Union) Penland (Morrow) W allowa (W allowa) Cascade Ecoregion Big Lava Blue (Jefferson) Cast (Jefferson) Clear (W asco) Cultus (Deschutes) Diam ond (Douglas) Diam ond (Klam ath) East (Deschutes) Emigrant (Jackson) Hosmer (Deschutes) Lake of the W oods (Klamath) Laurance (Hood River) Lost (Hood River) Mirror (Clackamas) Odell (Klam ath) Olallie (Marion) Paulina (Deschutes) Rock Creek (W asco) South Twin (Deschutes) Suttle (Jefferson) Timothy (Clackamas) Trillium (Clackamas) W aldo (Lane) Coast Ecoregion Big Creek Res (Lincoln) Bradly (Coos) Clear (Lane) Coffenbury (Clatsop) Cullaby (Clatsop) Devils (Lincoln) Stn 002 Stn 005 Stn 006 Fishhawk (Clatsop) Garrison (Curry) Howard Prarie (Jackson) Loon (Douglas) Lytle (Tillamook) Mercer (Lane) Munsel (Lane) Siltcoos (Douglas) Sunset (Clatsop) N. Tenmile/Tenmile (Coos)
Triangle (Lane) W oahink (Lane) W illamette Ecoregion Blue (Multnomah) Fairview (Multnomah) Fern Ridge Lake Hagg (W ashington) Oswego (Clackamas) Thornton (Benton)
2000 Volunteers
1988
1989
1990
1991
Lakes in Lake W atch Program 1992 1993 1994 1995 1996
X X
Lee A. Bogle X
X
X
X
X
X
X
X X
X X
X X X
X X
X X
X
X
X
X
X
X
X
X
X X
X X
X
X X
X X X X X X
X X X X X X
X
X
X
X
X
X
1997
1998
X
X
1999
2000
X X
X X X
X
Christine Sinclair
X
Catherine Hayes
Vince & Paulette Jesse
X
X X
X
X X X
X
X X X X X
X
X X
X X X X X X
X X
X X X X
X
X
X
X
X
X
X
X
X X X X
X
Ed Zeibell Elmer W aite Janette Goolsby Al Rice
X
X
X
X X
X
X
X
X
X X
X
X X X X
X X
X X
X X
X X
X X
X X
X X
X
X
X
X X
X X
X X
X X
X X
X X X X X
X X X X X
X X X X
X X X X
X
X
X X X
X
X X X
X X X
X X X
X
X X
X X
X X
X X
X X X
Barbara Hagerm an
Ron Boehi
X
Paul Cornett Dave & Linda Lauck
X
X
X
X X
X
W illiam Emblen Franklin Gray Dan Jordan
X
X X
Bob Anderson
X
X
X
X
Koren Marthaller Jim & Jane Graybill
X X
X
X
X
X
X
X
X
X
X X
X X
X X
X
X
X
X
X X
X
X
X X
X
X
X
X X
Henry Pollack & Jack W hite
2
X X
X
X
Oregon Lake Watch Program Final Report
2000
50 Lakes
Number
40
V o lu n te e rs
30 20 10
00 20
99 19
97
96
98 19
19
19
95
93
94
19
19
19
92
90
91
19
19
19
89 19
19
88
0
Y ear
Figure 1. OLW Program Lakes and Volunteers from 1988 to December 2000. 1.3
METHODS
OLW volunteers collected Secchi transparency, temperature, and dissolved oxygen data. Methods and procedures conducted in 2000 are discussed in the following sections. 1.3.1 Secchi Disk Depth OLW volunteers measured water transparency with a 20-centimeter, black and white Secchi disk attached to a reel-type fiberglass measuring tape. Secchi depth was reported in feet and converted to meters for reporting. Measurements were typically made between 10 a.m. and 2 p.m. on the shady side of the boat. No viewing tube was used for surface glare reduction. 1.3.2 Temperature Surface water and air temperatures were monitored with a hand held mercury or alcohol thermometer. Water temperatures at depth were measured with the same thermometer, after collection with a Beal Sampler (a Van Dorn type sampler designed and constructed by James Beal, US Army Corps of Engineers Fern Ridge Project). Thermometers were calibrated, over a 10-40 °C range, with a certified thermometer. Only thermometers measuring within 0.5 °C of the certified thermometer were distributed to volunteers. 1.3.3
Dissolved Oxygen
OLW volunteers measured dissolved oxygen with a Chemetrics kit (Model I-2002). The QA protocol required duplicate measurements on ten percent of the samples.
3
Oregon Lake Watch Program Final Report
2000
Lake of the W oods
W oahink
Cullaby
Devils
Lake
N.Tenmile
Fairview
Thornton
Bradley
Mercer
Siltcoos
Odell 0
5
10
15
Total Hours
Figure 2. Hours Volunteered Per OLW Station in 2000.
4
20
25
30
Oregon Lake Watch Program Final Report
2000
SECTION 2 RESULTS 2.1
RESULTS
All data collected in 2000 by volunteers in the OLW Program are included in Appendix A and B. 2.2
Secchi Disk Transparency and Temperature
Secchi disk depth, or transparency, measures the maximum depth of visibility of the Secchi disk in the water (usually at the depth that corresponds to approximately 10% of surface light); thus, it is a measure of the amount of material suspended or dissolved in the water column (Wetzel 1983). Changes in the amount of suspended material, which may include sediment, phytoplankton, and/or dissolved organic matter, influences the Secchi disk depth. When the amount of this material increases, the Secchi disk depth or transparency of the lake may decrease, as the material obscures the disk from view; thus, the depth to which light is able to penetrate is decreased. Decreased lake transparency can impact lake biology by altering photosynthetic rates of algae and macrophytes. Mean summer (June to August) Secchi transparency of lakes in the program varied from 8.06 meters (m) (Lake of the Woods) to 0.28 m (Fairview Lake). Lake of the Woods also had the deepest (9.50 m) Secchi disk depth reading measured in 2000. The shallowest Secchi disk depth (0.28 m) was recorded at the dock in Fairview Lake (Figure 3). The figures in the following sections represent mean summer (June to August) Secchi disk transparency. The variation within years is described by the standard error of the mean, and is illustrated as vertical bars above and below the mean value. A larger standard error indicates greater variability in the Secchi depths within years.
5
Oregon Lake Watch Program Final Report
2000
Secchi Disk Depth (m)
Br ad C ly ( ul 2) la D by ev (1 i 4 Fa ls ( ) irv 3) Fa iew irv Fa iew E. C irv a Fa iew Fai nal irv - rvie (1) Fa iew Osb w irv - ur Cre Fa iew Ou n C ek irv - tlet re (1 La iew Doc (1) ek ( ) 1) ke - k M of Cen (1) er th te c e M er W r( er - A o 1) o ce M r (1) ds er - B (1 ce 5) N r (1) .T -C N enm (1 .T i ) e le O nm - L de il in e d l Si l (1 - B ros ltc ) la A oo ch rm Th s s or (1 Ar (2) m W nto ) (3 oa n ) (2 h W in ) oa k W hin A t l oa k - a s W hin Bri ( 9 ) oa k - dg W hin Bri e 1 o a k - dg (8 hi B e 2 ) n k rid - O ge (8) ut 3 ( l e 8) t( 6)
Lake in OLW Program
0 2 4 6 8 10 12 14 16 18 20
Figure 3. 2000 summer (June-August) mean and annual range in Secchi disk depth for lakes in the OLW Program. (The number in parentheses indicates the number of summer Secchi depth measurements used to calculate the average.) Maximums and minimums are for data collected between January 1, 2000 and December 15, 2000. 2.2.1 Secchi Disk Transparency: Coastal Ecoregion Most of the lakes monitored in 2000 were in the Coastal Ecoregion. Most of the coastal lakes continued recent trends of increasing Secchi transparency, while Devils Lake experienced a dramatic decrease after observing an increasing trend since 1994, and Woahink Lake reversed a declining trend observed since 1993. Bradley Lake The 2000 Secchi disk readings for Bradley Lake indicate that transparency has increased by 17 percent since 1998 (Figure 4). Clearly, additional data are required to adequately document a trend in Bradley Lake.
6
Oregon Lake Watch Program Final Report
2000
Secchi Disk Depth (m)
2.50 2.00 1.50 1.00 0.50 0.00 1997
1998
1999
2000
2001
Year
Figure 4. Bradley Lake summer (June-August) Secchi disk depth mean (± 1 standard error) from 1998 to 2000. Cullaby Lake Cullaby Lake experiences minor fluctuating Secchi transparency. However, the mean Secchi disk reading for 2000 is the lowest recorded for the lake since it entered the OLW Program, a 24 percent decrease from 1999 (Figure 5).
Secchi Disk Depth (m)
1.2 1.0 0.8 0.6 0.4 0.2 0.0 1988 1989 1990 1991 1992 1993 1994 1995 1996 1997 1998 1999 2000 2001 Year
Figure 5. Cullaby Lake summer (June-August) Secchi disk depth mean (± 1 standard error) from 1989 to 2000.
7
Oregon Lake Watch Program Final Report
2000
Devils Lake Mean summer Secchi disk depth in Devils Lake had increased 120 percent from 1994 to 1999. In contrast, Secchi disk depth readings from 2000 indicate that transparency has decreased to near 1993 levels (Figure 6). From mid-August through October 2000, a large algal bloom occurred in the lake. This large algal bloom caused the decrease in near summer Secchi disk transparency in 2000. Additional Secchi transparency data from the Devils Lake Water Improvement District indicates a similar decline in Secchi disk transparency during this time (Campbell 2001). Overall, predications of water quality trends are difficult in the Devils Lake because of the severely altered lake system as a result of the eradication of vegetation by grass carp.
Secchi Disk Depth (m)
3.5 3 2.5 2 1.5 1 0.5 0 1992
1993
1994
1995
1996
1997
1998
1999
2000
2001
Year
Figure 6. Devils Lake summer (June-August) Secchi disk depth mean (± 1 standard error) from 1993 to 2000. Mercer Lake Mercer Lake has a history of minor fluctuating Secchi transparency, with the exception of 1998 in which Secchi transparency increased by 44 percent from 1997 (Figure 7). Secchi disk readings from 1999 were not recorded and only one reading was taken in 2000. Regression analysis revealed a significant (P = 0.0298) decline (0.095 m/yr) in transparency since 1988, when the anomolously high mean summer transparency in 1998 was omitted. Time serves as a surrogate for some other causative factor, such as nutrient loading, in this analysis. Because of the lack of recorded data in the past two years, continued monitoring is necessary to document if a decline in transparency will continue at the lake.
8
Oregon Lake Watch Program Final Report
2000
Secchi Disk Depth (m)
7.0 6.0 5.0 4.0 3.0 2.0 1.0 0.0 1988 1989 1990 1991 1992 1993 1994 1995 1996 1997 1998 1999 2000 2001 Year
Figure 7. Mercer Lake summer (June-August) Secchi disk depth mean (± 1 standard error) from 1989 to 2000. Siltcoos Lake Secchi transparency in Siltcoos Lake increased by 18 percent from 1999 and 48 percent from 1998 (Figure 8). This trend suggests that Secchi transparency is increasing to levels equivalent of past years; however, only one Secchi reading was taken in 2000. Additional data are required to adequately document this increasing trend in Siltcoos Lake.
Secchi Disk Depth (m)
3.0 2.5 2.0 1.5 1.0 0.5 0.0 1991 1992 1993 1994 1995 1996 1997 1998 1999 2000 2001 Year
Figure 8. Siltcoos Lake summer (June-August) Secchi disk depth mean (± 1 standard error) from 1992 to 2000.
9
Oregon Lake Watch Program Final Report
2000
North Tenmile Lake Mean summer Secchi transparency in North Tenmile Lake in 2000 was the highest recorded for the lake since it entered the OLW Program, an increase of about 17 percent from the previous high reading in 1994 (Figure 9). However, the increase is not significant given that North Tenmile Lake exhibits substantial within year fluctuations in transparency.
Secchi Disk Septh (m)
5 4 3 2 1 0 1993
1994
1995
1996
1997
1998
1999
2000
2001
Year
Figure 9. North Tenmile Lake summer (June-August) Secchi disk depth mean (± 1 standard error) from 1994 to 2000. Woahink Lake Mean summer transparency of Woahink Lake in 2000 increased by 23 percent from 1999 (Figure 10). A steep decline in transparency began in 1994 and was stopped in 1998, decreased again in 1999, and increased slightly again in 2000. Secchi transparency readings in the arms of the lake (Bridge 1 = 1st Arm; Bridge 2 = 2nd Arm; and Bridge 3 = 3rd Arm) were generally lower than the mid-lake station (Atlas station) (Figure 11). Erosion in the watershed contributes sediment to the arms of the lakes. Continued high sediment loading to Woahink Lake will eventually lead to changes in the lake trophic state and degradation of water quality. Transparency of Woahink Lake appears to be strongly influenced by climate factors. Transparency increased substantially following the end of a dry period in 1993. However, Woahink has continued to receive input from septic tank drainfields and sediment loading from the watershed, which may negate improvement, related to climatic factors.
10
Oregon Lake Watch Program Final Report
2000
9 Secchi Disk Depth (m)
8 7 6 5 4 3 2 1 0 19
58 960 962 964 966 968 970 972 974 976 978 980 982 984 986 988 990 992 994 996 998 000 002 1 1 1 1 1 1 1 1 1 1 1 1 1 1 1 2 1 1 1 2 1 1
Year
Figure 10. Woahink Lake summer (June-August) Secchi disk depth mean (± 1 standard error) from 1960 to 2000.
Secchi Disk Depth (m)
N ov
O ct
Se pt
g Au
Ju l
Fe
b M ay Ju n
Month
Bridge 1 Bridge 2 Bridge 3 Atlas Outlet
0 1 2 3 4 5 6 7 8 9 10
Figure 11. Woahink Lake monthly disk depth for individual testing sites in 2000.
11
Oregon Lake Watch Program Final Report
2.2.2
2000
Secchi Disk Transparency: Willamette Ecoregion
No overall trend in the Willamette Ecoregion lake water transparency was evident in the OLW data. Fairview Lake continues to display the lowest Secchi transparency of all the lakes in the OLW Program, and Thornton Lake exhibits variable data indicating no clear trends. Fairview Lake Mean summer Secchi transparency in Fairview Lake in 2000 was the highest recorded for the lake since it entered the OLW Program (Figure 12). Secchi transparency averaged 0.47 m during 2000, a 12 percent increase over 1998 and a greater than 100 percent increase from the 1994 low reading of 0.20 m. Fairview Lake continues to have the lowest Secchi transparency of all the lakes in the OLW Program. Fairview Lake is a shallow (1 m) reservoir near the Columbia River that is subject to wind re-suspension of sediments and high sediment loading from a highly developed watershed. Shoreline development has increased along the lake within the past 2 years. The increased shoreline development might lead to increased sedimentation, high turbidity, and the loss of rooted aquatic plant vegetation; however, the 2000 high Secchi disk reading does not presume this trend.
Secchi Disk Depth (m)
0.60 0.50 0.40 0.30 0.20 0.10 0.00 1990 1991 1992 1993 1994 1995 1996 1997 1998 1999 2000 2001 Year
Figure 12. Fairview Lake summer (June-August) Secchi disk depth mean (± 1 standard error) from 1991 to 2000. Thornton Lake Secchi transparency in Thornton Lake in 1998 was approximately 50 percent lower than 1997; however, in 2000 Secchi transparency increased again by almost 130 percent (Figure 13). The 2000 Secchi disk mean is the highest recorded for the lake since it entered the OLW Program. Secchi transparency is variable for Thornton Lake and could be influenced by herbicide applications to control the noxious aquatic weed,
12
Oregon Lake Watch Program Final Report
2000
Secchi Disk Depth (m)
Egeria densa. Additional data are required to adequately document the transparency trend in Thornton Lake.
2.5 2 1.5 1 0.5 0 1995
1996
1997
1998
1999
2000
2001
Year
Figure 13. Thornton Lake summer (June-August) Secchi disk depth mean (± 1 standard error) from 1996 to 2000. 2.2.3
Secchi Disk Transparency: Cascade Ecoregion
Only two lakes in the Cascade Ecoregion were monitored during the 2000 OLW period. Lake of the Woods experienced a slight decrease following an increasing trend since 1994. Transparency in Lake Odell has decreased substantially since 1996 but the number of measurements is low and could be the result of a change in volunteer. Lake of the Woods Mean summer Secchi transparency in Lake of the Woods nearly doubled from 1993 to 1998, and transparency continued to increase at a rate of 0.9 m per year (Figure 14). This year, the trend was reversed: mean transparency decreased in 2000 by 13 percent from 1998. Logging and other activities in the watershed were considered causes of the decreasing transparency trend evident in 1993. However, Lake of the Woods data illustrates the importance of long-term data sets for determination of trends. A high percent cover of noxious aquatic weeds was observed in Lake of the Woods in 2000 but is not the cause of the decreasing Secchi readings.
13
Oregon Lake Watch Program Final Report
2000
Secchi Disk Depth (m)
12 10 8 6 4 2 0 1986
1988
1990
1992
1994
1996
1998
2000
2002
Year
Figure 14. Lake of the Woods summer (June-August) Secchi disk depth mean (± 1 standard error) from 1988 to 2000. Odell Lake The 1998 and 2000 Secchi disk readings suggest that transparency has dropped substantially in the lake from 1996 (Figure 15). However, this observation is based on single Secchi disk readings. Also, in 1998 there was a change in volunteers. The measurement taken in 2000 was from the dock instead of the center of the lake (where it was taken in previous years). Additional data is required to adequately document water quality in Odell Lake.
Secchi Disk Depth (m)
14 12 10 8 6 4 2 0 1988
1990
1992
1994
1996
1998
2000
Y ear
Figure 15. Odell Lake summer (June-August) Secchi disk depth mean (± 1 standard error) from 1989 to 2000.
14
2002
Oregon Lake Watch Program Final Report
2.3
2000
Dissolved Oxygen
Dissolved oxygen concentrations, especially in the hypolimnion (bottom) of a lake, are an indicator of the trophic condition of a lake. Most lakes in Oregon, with a depth of 20 feet of more, develop two temperature-defined layers during the summer when the surface waters, warmed by the sun, become less dense than the colder, denser, bottom waters. This type of zonation in lakes is called “stratification.” The upper layer of the lake is referred to as the epilimnion (epi=upper) and the bottom layer as the hypolimnion (hypo=bottom). The epilimnion is separated from the hypolimnion by a transition zone called the metalimnion (meta=middle), where temperature changes rapidly with depth. This zone functions as a mixing barrier by separating the warm, upper water from the denser bottom waters. Temperature stratification has profound impacts on the biology and chemistry of a lake. The upper layer is well mixed by wind so that dissolved gases are in near equilibrium with the atmosphere. The hypolimnion, however, is not exposed to the atmosphere because the temperature stratification prevents its mixing with the surface waters. As a result, the hypolimnetic water chemistry and gas concentrations can be drastically different from the eplimnion, when the lake is stratified. In eutrophic lakes, which have abundant phytoplankton, oxygen concentrations will be equal or nearly equal through the entire water column during times of the year when the lake is isothermal (well mixed). When the lake stratifies and the bottom waters stop mixing with surface waters, the hypolimnion is no longer exposed to the atmosphere. Without exposure to atmospheric oxygen, oxygen concentration in bottom waters of stratified lakes can become depleted through respiration by bacteria and fungi, which use oxygen to consume the dead algal cells that rain down from the epilimnion. In oligotrophic lakes, which do not have abundant phytoplankton, the “algal rain” from the epilimnion is not heavy enough to support high levels of decomposition and oxygen concentrations remain high in the hypolimnion. Some lakes are naturally eutrophic with anoxic hypolimnion. Abundant algae production in the epilimnion and reduced oxygen concentrations in the hypolimnion are primarily a concern when they result from human impacts on the lake; such human-induced change in lake productivity is termed “cultural eutrophication.” Since the organisms we commonly observe and like to see in lakes require oxygen for survival (only some types of bacteria can survive in environments lacking oxygen), oxygen depletion in the hypolimnion can reduce habitat availability. Cold-water fish like trout, for example, can’t move into the colder water of the hypolimnion to escape the high water temperatures in the epilimnion if there is no oxygen available. Similarly, the zooplankton populations can be reduced to very low levels by fish predation in lakes with anoxic hypolimnion. Algae populations, which are often kept in check by zooplankton grazing, can bloom if zooplankton populations are reduced, causing water quality problems.
15
Oregon Lake Watch Program Final Report
2000
Oxygen concentration also has a profound effect on the solubility of various chemical compounds important in lake ecology. Phosphorous availability, for example, often limits growth of algae in lakes. In oxygenated water, phosphorous binds to iron compounds in the water that settle out of the water column and thus are not available for use by algae. When the dissolved oxygen in the hypolimnion is depleted, the oxidation state of iron changes, causing the iron-phosphate complexes to break down; this releases both iron and phosphate into the hypolimnion. As a result of this process, the hypolimnion of a eutrophic lake can contain very high concentrations of iron and phosphorous. In the fall, when air temperatures drop and the surface waters cool to the same temperature as the bottom water, resistance to mixing is reduced and the entire lake can freely circulate (fall turnover) mixing phosphorous-rich hypolimnetic water with surface waters. With phosphorous available, algae production is no longer nutrient limited. The influx of high nutrient water from the hypolimnion at fall turnover often results in “fall blooms” of phytoplankton in lakes that stratify in the summer. In mild-winter areas, like on the coast and in the Willamette Valley, lakes usually continue to mix completely during the winter. In colder regions of Oregon, however, inverse stratification can occur. Inverse stratification happens when surface waters are colder than 4°C, and therefore colder than the bottom waters. In spring, as the surface waters warm and the lake becomes isothermal (the same temperature throughout the water column) wind action can, again, cause complete mixing of the lake and spring turnover occurs; spring turnover can also lead to algae blooms by the same mechanism. The temperature of the water and amount of biological activity determine the concentration of dissolved oxygen. Cold water can contain more dissolved oxygen than warm water. Plants increase oxygen concentration in the water through photosynthesis during the daylight hours, and consume oxygen at night through respiration. Large fluctuations can occur in surface waters of lakes with high productivity (abundant phytoplankton and macrophytes), as the plants produce oxygen during the day and consume it at night. Volunteers regularly on four lakes (Fairview, Lake of the Woods, Thornton, and Woahink) conducted dissolved oxygen sampling for the OLW Program in 2000. Dissolved oxygen concentrations were measured to compare epilimnion and hypolimnion concentrations and to determine the rate of depletion of dissolved oxygen in the hypolimnion of the lakes. The rate of the hypolimnetic dissolved oxygen is a function of lake productivity. In this report, hypolimnetic dissolved oxygen depletion rate was calculated as the change in hypolimnion dissolved oxygen concentration over time and is reported as milligrams per liter per day (mg/L/day). Dissolved oxygen content of the hypolimnion was not volume weighted. Rates of depletion are not comparable between lakes. Hypolimnion volume in each lake is assumed to be constant within the between years.
16
Oregon Lake Watch Program Final Report
2.3.1
2000
Dissolved Oxygen: Coastal Ecoregion
Woahink Lake
12 10
1994 1995
8
1996
6
1997 1998
4
1999
2
2000
307
297
285
270
250
236
228
210
192
177
160
133
0 98
Hypolimnetic Dissolved Oxygen Concentration (mg/L)
Dissolved oxygen concentrations in the hypolimnion of Woahink Lake were generally lower than in previous years (Figure 16). The lowest concentration measured just prior to turnover was 4 mg/L. Lower concentrations were measured in the hypolimnion when turnover occurred later. If dissolved oxygen concentration in the hypolimnion drops to around 2 mg/L, anoxic conditions could develop at the sediment surface and result in a substantial nutrient release. Long periods of stratification in Woahink permit greater dissolved oxygen depletion, and increase the likelihood of internal nutrient loading and substantial long-term degradation of lake water quality.
Julian Day
Figure 16. Dissolved oxygen concentration in the hypolimnion of Woahink Lake from 1994 through 2000. 2.3.2
Dissolved Oxygen: Willamette Ecoregion
Fairview Lake In 1999, dissolved oxygen was measured at five locations in Fairview Lake (East Channel, Fish Creek, Otter Creek, Outlet, and Center). Dissolved oxygen ranged from 10.6 near the Outlet to 14.2 near Otter Creek. The percent oxygen saturation (determined with dissolved oxygen and temperature) was approximately 165%. In 2000, dissolved oxygen was measured at the Outlet and the Center of the lake, and ranged from 8.0 to 10.8. The percent oxygen saturation ranged from 122% in September to 85% in October. The lake can become oversaturated during the day when photosynthesis produces abundant oxygen, although the extremely high saturated levels suggest that there could have been errors in dissolved oxygen or temperature measurements. Conversely, the lake can become undersaturated at night when respiration exceeds photosynthetic oxygen
17
Oregon Lake Watch Program Final Report
2000
production. Clearly, additional data are required to adequately document a trend in Fairview Lake. (See Appendix A and B for dissolved oxygen data and figure). Thornton Lake
Hypolimnetic Dissolved Oxygen Concentration (mg/L)
In 1998 and 2000, dissolved oxygen concentrations in the hypolimnion were less than 2 mg/L by mid-August, and fall turnover occurred in mid-September (Figure 17). Additional data are required to adequately document a trend in Thornton Lake. 9 8 7 6 1996 1998 2000
5 4 3 2 1 0 212
241
243
257
259
316
338
457
Julian Day
Figure 17. Dissolved oxygen concentration in the hypolimnion of Thornton Lake from 1996 through 2000.
18
Oregon Lake Watch Program Final Report
2000
2.3.3 Dissolved Oxygen: Cascade Ecoregion Lake of the Woods
12 1993 -35 ft 1995 -35 ft 1996 -35 ft 1997 -45 ft 1997 -35 ft 1998 -45 ft 2000 -45 ft
10 8 6 4 2
3
8
5
5
3 28
27
26
26
5
1
25
25
3
2
7
2
4
7
24
23
22
21
20
19
16
5
0 17
Hypolimnetic Dissolved Oxygen Concentration (mg/L)
Dissolved oxygen concentration in the hypolimnion of Lake of the Woods in 2000 declined to 2 mg/L by the end of September (Figure 18). This pattern is similar to the decline of dissolved oxygen observed in 1998. In contrast, dissolved oxygen in the hypolimnion of Lake of the Woods in 1997 was less than 2 mg/L when sampling began in mid-July but increased through August. There is no clear explanation for such divergent hypolimnetic dissolved oxygen concentration dynamics.
Julian Day
Figure 18. Dissolved oxygen concentration in the hypolimnion of Lake of the Woods from 1993 through 2000.
19
Oregon Lake Watch Program Final Report
2000
SECTION 3 QUALITY ASSURANCE PROJECT PLAN 3.1
Quality Assurance Project Plan (QAPP)
Quality assurance (QA) is a set of operating principles created to ensure that a sampling program produces data of a known and defensible quality. The QAPP for the OLW program is located in Appendix C. This plan was designed to ensure that all measurements made will yield consistent results that are representative of the media and conditions sampled. OLW staff was directly responsible for many of the QA procedures. All equipment used by the volunteers in 2000 was inspected prior to the summer testing season. • •
Thermometers issued to volunteers were calibrated using a certified thermometer (Ever Ready Thermometer Company). All thermometers issued to volunteers measured to within 0.5°C of the certified thermometer. Between June and September of 2000 OLW staff visited 10 of the 11 lakes surveyed that year. Volunteer Secchi disk measurements were compared during these visits against those taken by staff.
Recommended quality checks for data recording, reduction, and storage were closely adhered to by OLW staff. Volunteers performed numerous procedures as a part of the QAPP. During various times throughout the year, volunteers took duplicate water quality measurements. Duplicate Secchi disk readings were taken at 6 of the 11 lakes (Figure 19). All duplicate measurements agreed to within 10 percent. Duplicate dissolved oxygen and temperature measurements also agreed within 10 percent. Reported QA results from both OLW staff and volunteers suggest that conforming collection methods are being utilized and data compiled by volunteers is reliable.
20
Oregon Lake Watch Program Final Report
2000
6
CLW Staff Secchi Disk Measurments (m)
5
4
3
2
1
0 0
1
2
3
4
5
CLW Volunteer Secchi Disk Measurements (m)
Figure 19. Comparison of volunteer Secchi disk and OLW staff Secchi disk measurements.
21
6
Oregon Lake Watch Program Final Report
2000
SECTION 4 RECOMMENDATIONS 4.1
Summary
Since its inception in 1988, the OLW program has surveyed fifty lakes from four ecoregions in Oregon. Several volunteers have logged hundreds of hours monitoring lake water quality in the state. Volunteer commitment to the OLW Program has been incredibly high. Many volunteers have continued to monitor lake water quality in 2000 even after the program funding ended. Data collected from volunteers has helped to identify trends and causes of water quality problems in Oregon lakes. The importance of long-term monitoring of lakes has been demonstrated through volunteer collection of data that illustrate the influence of climate on lake water quality. As Oregon continues to grow, more pressure will be placed on our lentic ecosystems. It is essential that Oregon’s lakes continue to be monitored to identify changes caused by natural and anthropogenic events. Oregon lakes cannot be managed responsibly without basic information on lake water quality. 4.2
Recommendations
Funding for the OLW Project ended in June 1999 but was reissued in July 2000. The inconsistent funding for 1999 and 2000 resulted in a low number of OLW monitored lakes in 2000. Below is a list of recommendations to continue lake monitoring and management of lakes in Oregon. Coordination of volunteers and data management • • • •
Continue to support and use the committed and knowledgeable volunteers in the OLW Program. Expand the program by recruiting more volunteers, volunteer coordinators, and lakes. Maintain existing lakes in the OLW Program to develop a long-term database. Provide a knowledgeable regional contact to answer volunteer questions. Regular volunteer contact is needed to maintain the OLW Program and for QA.
Critical Problems to Address • •
Woahink Lake: Address nutrient loading to the lake to prevent further increase in productivity and the potential for hypolimnetic dissolved oxygen depletion that could lead to irreversible degradation of the lake. Devils Lake: Removal of vegetation from the lake by grass carp appears to have caused changes in the frequency of algae blooms and seasonal dynamics of phytoplankton populations. These changes should be documented and used to make better management decisions in other lakes with noxious weed infestations.
22
Oregon Lake Watch Program Final Report
•
2000
Toxic algae blooms and aquatic weeds: Identify common toxic algae blooms and problems with invasive aquatic weeds in Oregon.
23
Oregon Lake Watch Program Final Report
2000
SECTION 5 REFERENCES Campbell, Lori. 2001. Devils Lake Water Improvement District: 2000 Secchi disk data from Devils Lake. Daggett, Steven. 1994. Evidence for the Eutrophication of Selected Coastal Dunal Lakes: Historical Comparisons of Indices for Nutrient Enrichment. Masters Thesis. Portland State University. 140 pp. Johnson, D.M., R.R. Peterson, D.R. Lycan, J.W. Sweet, M.E. Neuhaus, A.L. Schaedel. 1985. Atlas of Oregon Lakes. Oregon State University Press, Corvallis, Oregon. Sytsma, M.D. and S. Berglund Breiling. 1995. 1994 Lake Water Quality Assessment Annual Report, Prepared for DEQ. 20 pp + Appendices. Sytsma, M.D. 1996. Devils Lake Revegetation and Water Quality Study Final Report, Prepared for Devils Lake Water Improvement District. 15 pp + 1 Appendix. Sytsma, M.D. 1997. Fern Ridge Volunteer Water Quality Monitoring Report, Prepared for United States Army Corps of Engineers, Fern Ridge Project. 30 pp. Sytsma, M.D., R.P. Peterson, S. Berglund, and K. Perkins. 1998b. 1996 Lake Water Quality Assessment Annual Report, Prepared for DEQ. 20 pp + Appendices. Wetzel, R.G. 1983. Limnology. CBS College Publishing, Philadelphia, Pennsylvania.
24
Oregon Lake Watch Program Final Report
2000
25
APPENDIX B 2000 Oregon Lake Watch Figures
Appendix B. 2000 Oregon Lake Watch Figures The following figures include data collected by the CLW Volunteers in 2000. The figures represent Secchi disk depth verses temperature throughout the sampling period. The scale on the left side of each figure depicts the depth in meters below the lake surface. The scale on the right side of the figure depicts the surface water temperature in Celsius (C°). The top of the figure lists the months of the year in which sampling was conducted. The Secchi disk depth is represented by the bars stretching down from the top of the graph. The temperature is represented by the diamonds, and is read by comparing the equivalent value on the scale on the right of the figure. Also included in this appendix is the dissolved oxygen data collected for Fairview Lake. The following figures are represented in Appendix B. ! ! ! ! ! ! ! ! ! ! ! ! ! ! ! ! ! !
Bradley Lake – 2000 Cullaby Lake – 2000 Devils Lake – 2000 Lake of the Woods – 2000 Fairview Lake (East Canal) – 1999/2000 Fairview Lake (Fairview Creek) – 1999/2000 Fairview Lake (Otter Creek) – 1999/2000 Fairview Lake (Outlet) – 1999/2000 Fairview Lake (Lake Center) – 1999/2000 Fairview Lake (Dock) – 1999/2000 Fairview Lake: Dissolved Oxygen Concentrations – 1998-2000 Mercer Lake – 2000 North Tenmile Lake (Lindros Arm) – 2000 North Tenmile Lake (Blacks Arm) – 2000 Odell Lake – 2000 Siltcoos Lake – 2000 Thornton Lake – 2000 Woahink Lake (Mean of all Stations) - 2000
Oregon Lake Watch 2000 Bradley Lake Coos County Month Sept
Nov
0
25
0.5
20
1
15
1.5
10
2
5
2.5
0
Surface Water Temperature (C)
Secchi Disk Depth (m)
Aug
Oregon Lake Watch 2000 Cullaby Lake Clatsop County
0.0 0.1 0.2 0.3 0.4 0.5 0.6 0.7 0.8 0.9 1.0
Oct
Sept
Aug
Jun
Mar
Dec 25 20 15 10 5 0
Surface Water Temperature (C)
Secchi Disk Depth (m)
Feb
Month
Oregon Lake Watch 2000 Devils Lake Lincoln County Month Oct
Nov
30
0.5 Secchi Disk Depth
Dec
25
1.0 20
1.5
15
2.0 2.5
10
3.0 5
3.5
Surface Water Temperature (C)
Mar Apr Jul Sept 0.0
0
4.0
Oregon Lake Watch 2000 Lake of the Woods Klamath County
5 10 15 20 25 30
Aug
Sept
10 9 8 7 6 5 4 3 2 1 0
Secchi Disk Depth (m)
Surface Water Temperature (C)
0
Jul
Jun
Month
Oregon Lake Watch 1999/2000 Fairview Lake Multnomah County (East Canal) Month Jul-99
Sep-99
Aug-00
Oct-00
0
30
0.1
25
0.2
20
0.3
15
0.4
10
0.5
5
0.6
0
Surface Water Temperature (C)
Secchi Disk Depth (m)
Jun-99
Oregon Lake Watch 1999/2000 Fairview Lake Multnomah County (Fairview Creek) Month Jul-99
Sep-99
Aug-00
Oct-00
0
30
0.1
25
0.2
20
0.3 15 0.4 0.5
10
0.6
5
0.7
0
Surface Water Temperature (C)
Secch Disk Depth (m)
Jun-99
Oregon Lake Watch 1999/2000 Fairview Lake Multnomah County (Otter Creek) Month Jul-99
Sep-99
Aug-00
Oct-00
0
30
0.1
25
0.2
20
0.3
15
0.4
10
0.5
5
0.6
0
Surface Water Temperature (C)
Secchi Disk Depth (m)
Jun-99
Oregon Lake Watch 1999/2000 Fairview Lake Multnomah County (Outlet) Month
Secchi Disk Depth (m)
0 0.05 0.1 0.15 0.2 0.25 0.3 0.35 0.4 0.45 0.5
Jul-99
Sep-99
Aug-00
Oct-00 30 25 20 15 10 5 0
Surface Water Temperature (C)
Jun-99
Oregon Lake Watch 1999/2000 Fairview Lake Multnomah County (Lake Center) Month Jul-99
Sep-99
Aug-00
Oct-00
0
30
0.1
25
0.2
20
0.3
15
0.4
10
0.5
5
0.6
0
Surface Water Temperature (C)
Secchi Disk Depth (m)
Jun-99
Oregon Lake Watch 1999/2000 Fairview Lake Multnomah County (Dock) Month Jun-00
Aug-00
Oct-00
0
30
0.1
25
0.2
20
0.3 15 0.4 0.5
10
0.6
5
0.7
0
Surface Water Temperature (C)
Secchi Disk Depth (m)
Sep-99
Oregon Lake Watch 1999/2000 Fairview Lake Multnomah County Dissolved oxygen concentration from 1998 through 2000
Dissolved Oxygen (mg/L)
16 14 12 10
1998
8
1999 2000
6 4 2 0 165
187
245
262 Julian Day
265
276
277
Oregon Lake Watch 2000 Mercer Lake Lane County
Month
Secchi Disk Depth (m)
0 1 1 2 2 3 3 4 4
18 16 14 12 10 8 6 4 2 0
Surface Water Temperature (C)
Sept
Oregon Lake Watch 2000 North Tenmile Lake Coos County (Lindros Arm) Month Aug
Sept
Oct
Nov
Secchi Disk Depth (m)
0
25
1
20
2 15 3 10 4 5
5 6
0
Oregon Lake Watch 2000 North Tenmile Lake Coos County (Blacks Arm) Month
Secchi Disk Depth (m)
1
Aug
Sept
Oct
Nov 25 20
2 15 3 10 4 5 6
5 0
Surface Water Temperature (C)
Jun 0
Surface Water Temperature (C)
Jun
Oregon Lake Watch 2000 Odell Lake Klamath County Month Sept
Secchi Disk Depth (m)
16
0.5
14 1
12
1.5
10 8
2
6
2.5
4 3
2
Surface Water Temperature (C)
18
0
0
3.5
Oregon Lake Watch 2000 Siltcoos Lake Douglas County Month Sept 18
Secchi Disk Depth (m)
16 0.5
14 12
1 1.5
10 8 6
2
4 2
2.5
0
Surface Water Temperature (C)
0
Oregon Lake Watch 2000 Thornton Lake Benton County Month Sept
Nov
0.0
25
0.5
20
1.0
15
1.5
10
2.0
5
2.5
0
Surface Water Temperature (C)
Secchi Disk Depth (m)
Aug
Oregon Lake Watch 2000 Woahink Lake Lane County (Mean of all Stations) Month Jul
Aug
Sept
Oct
Nov
0 1
25
2 3 4
20
5 6 7 8 9 10
15 10 5 0
Surface Water Temperature (C)
Secchi Disk Depth (m)
May Jun
APPENDIX C Oregon Lake Watch Quality Assurance Project Plan
Oregon Lake Watch QAPP
2000
1.0
OREGON LAKE WATCH QAULITY ASSURANCE PROJECT PLAN (QAPP)
1.1
Project Description
Freshwater lakes in Oregon are valuable as sources of drinking water, as recreation sites, as sources of water for irrigation, and as unique natural ecosystems. These uses are threatened by invasive, nonnative aquatic macrophytes, conflicts among users, and nonpoint pollution. The largest concern is the aquatic pests such as rooted aquatic macrophytes that degrade recreational uses of lakes, and reduce water quality and wildlife habitat value. Despite their multiple functions, benefits and threats, Oregon lakes have received little study; only a few have benefited from the development of thoughtful management plans. 1.2
Historical Overview
Lack of adequate resources and basic limnological information on which to base management decisions stimulated the Oregon Department of Environmental Quality (ODEQ) to initiate a volunteer monitoring program for selected Oregon lakes in 1988. One of the primary goals of this effort was to characterize and identify changes in physical, chemical, or biological characteristics in Oregon lakes. In 1989, funding by the United States Environmental Protection Agency (EPA) allowed an expansion in the ODEQ’s Lake Water Quality Assessment Project to include this newly formed network of lakes and volunteers. The ODEQ and various contractors coordinated the program until 1991, when the program was transferred to Portland State University (PSU). Since that time, ODEQ, PSU, and the team of Oregon Lake Watch (OLW) volunteers have worked together to collect and analyze data concerning Oregon lakes. Non-indigenous aquatic plants have invaded many of Oregon’s lakes and streams. Approximately forty-three percent of the lakes and reservoirs on the ODEQ list of water quality limited waterbodies (totaling over 118,500 acres) are listed because of aquatic weeds. Many additional waterbodies are impacted but not listed because of lack of adequate data (ODEQ 1996). Many coastal and Willamette Valley lakes, reservoirs, and streams have been invaded by non-native plants that have displaced native species and disrupted ecosystem function. Aquatic plants are also an important component of natural aquatic ecosystems. Native aquatic vegetation stabilizes sediments, provides structure that is habitat for fish and invertebrates, and play a major role in the cycling of nutrients. When invasive, non-indigenous aquatic plants are introduced to an aquatic system, the function and health of the ecosystem is degraded (Carpenter and Lodge 1986). Management of aquatic vegetation in Oregon has been haphazard and ineffective. Management activities themselves have often caused extensive environmental damage. A well-conceived and implemented aquatic vegetation management plan provides control of the problem vegetation and preserves all the beneficial uses of the waterbody with minimal environmental impact.
1
Oregon Lake Watch QAPP
1.3
2000
Sampling Objectives
The sampling conducted on this project is designed to identify and report the characteristics of each lake monitored. Secchi disk depth, temperature, and dissolved oxygen (DO) data will be collected by volunteers from several selected lakes in Oregon. 1.4
Document Purpose and Scope
This report describes the sampling plan and data quality objectives required to identify and report Oregon lake characteristics and trends. The scope of this report includes experimental design and sampling for limnological data. Sampling for water quality variables (Secchi disk depth, DO, temperature, turbidity) are included. 2.0
PROJECT ORGANIZATION
The ODEQ is the lead agency of the OLW Program. Ms. Karen Williams is the ODEQ project manager of the OLW Program. The ODEQ has contracted PSU and the OLW volunteers to conduct the field evaluations of selected lakes of Oregon. 2.1
Quality Assurance Responsibility
The volunteers are responsible for sample site establishment, monitoring, and sampling. The primary volunteer coordinator (as of September 2000), Carrie Haag, is responsible for the supply of materials, information and equipment as well as maintaining a correspondence with volunteers via on site quality management. Dr. Mark Sytsma, the PSU project coordinator, is primarily responsible for project coordination and reporting. An addition to the OLW Program is Dr. Michael Park, the Southern Oregon University (SOU) volunteer/project coordinator. Dr. Park will also provide assistance disseminating information and equipment as well as conducting on site quality management. Dr. Sytsma will review all data generated on the project to assure compliance with data quality objectives established in the QAPP. All correspondence, data and quality management results will be compiled by the primary volunteer coordinator and submitted to Dr. Sytsma for final submission to ODEQ. 3.0
DATA QUALITY OBJECTIVES
Quality assurance (QA) is a set of operating principles that ensure that a sampling program will produce data of known and defensible quality. This section describes the QA objectives, or the quantitative and qualitative requirements that the data must meet to achieve the project objectives. The quality control (QC) procedures, or the methods to be used to attain the QA objectives are discussed in Section 8.0. Project requirements determine QA objectives. The overall purpose of the QA objectives is to ensure that data of known and acceptable quality are provided. All measurements will be made to yield consistent results that are representative of the media and conditions
2
Oregon Lake Watch QAPP
2000
sampled. Data quality objectives necessary to meet the project requirements are defined by six attributes presented in the table below. Attribute Precision
Volunteers should take duplicate readings for each variable they measure every 5 times they sample. The duplicate readings should agree to within 10%; this will be determined by OLW staff. Bias Once a month (during the summer months), volunteer measurements should be checked against those taken by OLW staff and should agree to within 10% (Volunteer or Procedure Bias). During these monthly visits, equipment should be inspected by the volunteer coordinator to ensure that it is in proper working order (Equipment Bias). New volunteers will be issued equipment that has been calibrated by OLW staff (thermometers will agree with the certified/calibrated thermometer to within 0.5 degrees Celsius (°C) at 20 °C; DO kits are calibrated to manufacturer’s specifications). Completeness Goal: Volunteers should try to collect 2 samples per month However, because volunteers are collecting the data and they collect data at their convenience, this criteria will be relaxed such that all data collected by the volunteers will be considered complete. Representativeness Parameters, such as surface water temperature, are obviously not representative of the entire lake; rather, the parameters reported by the volunteers are representative of that specific site and depth. Comparability OLW staff will examine the data to determine if there are any “outliers,” or single data points that differ (by more than 50%) from the readings taken at a similar time at this or a similar lake.
4.0
FIELD DATA COLLECTION PROCEDURES
All field data will be collected from an established collection station/stations at each of the selected lakes. Data collection procedures for lake water quality in 2000 will be the same as in previous years to enable comparisons between years. Sampling will focus on evaluating the improvement or deterioration of the lake status. Physical and chemical characteristics of the lake water will be characterized. Secchi disk depth, temperature, DO, and turbidity will be measured. Once per month, data collection will be duplicated to ensure accurate equipment usage.
3
Oregon Lake Watch QAPP
5.0
2000
DATA CUSTODY
The PSU volunteer coordinator will conduct the water quality data processing. 6.0
CALIBRATION PROCEDURES AND FREQUENCY
Accurate calibration procedures are necessary in order to obtain QA objectives. The OLW Program requires DO kits and thermometers to be calibrated during the monitoring period. The DO kits will be calibrated per the manufacturer’s production requirements. The Oxygen 2 Single Analyte Meter (SAM) is a microprocessor-based instrument. The instrument uses the indigo carmine method (Gilbert et al 1992). All DO kits will be calibrated before each use. During the next OLW sampling period (2001), DO samples will be calibrated against the DO Winkler method in order to ensure data correctness. The certified calibration thermometer will be used to calibrate all thermometers before being disseminated into the field. The liquid-in-glass-thermometer was calibrated by the Ever Ready Thermometer Company against a standard calibrated thermometer at the National Institute of Standards and Technology on April 21, 1998. The Report of Calibrations is presented in the table below. Thermometer Reading (°C) -7.00 0.00 10.00 20.00 30.00
Correction (ITS-90) (°C) 0.02 0.00 0.00 0.00 0.00
All temperatures in this report are based on the International Temperature Scale of 1990 (ITS-90). Once every project period, the volunteer coordinator will conduct on site training and perform duplicate data collection. This will ensure proper equipment use and allow for equipment calibration along with an additional training of the volunteers. 7.0
DATA REDUCTION, VALIDATION, REVIEW AND REPORTING
Data reduction, validation, review, and reporting are measures used attain QA objectives. 7.1
Data Reduction
Field collected water quality data will require little reduction. All quantitative data collected will be entered into Excel spreadsheets. Original data sheets will be archived at PSU.
4
Oregon Lake Watch QAPP
7.2
2000
Data Validation and Review
All field data will be examined by Carrie Haag for validity, accuracy, and completeness immediately upon receipt of data cards from volunteers. Dr. Sytsma will provide an additional review and validation prior to report production. Carrie Haag and Dr. Parker will coordinate with the volunteers to ensure data collection procedures are followed. 7.3
Data Reporting
All data will be included in the final project report produced at the conclusion of the project. 8.0
INTERNAL QC CHECKS AND PROCEDURES
Internal QC procedures are designed to meet the QA objectives described in Section 3 (Data Quality Objectives). Section 3 describes the analytical requirements of the data, and this section describes how the data requirements will be met (EPA 1991). 8.1
QC Checks on Water Quality Data Collection Procedures
To demonstrate that the water quality was collected in a manner that minimizes the potential for inaccurate equipment use the QC data will be collected. Bias may be introduced into the data by errors in data collection. A method duplicate will be used to assess this error. A duplicate data will be collected and compared to the original data on each collection date. Comparison of data results for the two readings will provide an assessment of the reproducibility, or precision, of analyzed quantification.
5
Oregon Lake Watch QAPP
2000
Attribute Precision
If duplicate measurements are not taken at least every 5th time by the volunteer, OLW staff will again request that they do so. If the duplicate measurements do not agree to within 10%, OLW staff will visit the volunteer to ensure correct procedures and working equipment. Faulty equipment will be replaced. Bias If the volunteer readings are not within 10% of the OLW staff readings, OLW taff will determine the type of bias and proceed as follows: Procedure Bias – If procedures are incorrect, volunteers ill be retrained by OLW staff. Equipment Bias – Volunteers will be issued new and calibrated equipment. Volunteer Bias – If the volunteer is using correct procedure and has working equipment, a note will be made in the report that flags the data as not meeting the QA standards. Completeness All data received from the volunteers will be considered complete. Representativeness The report should indicate that the measurements taken are representative of the specific site and depth at which they were taken. The report should also indicate that only a limited amount of data was collected. Comparability Any data point flagged as 50% different than an expected value for that time of year and that type of lake will be investigated by OLW staff. If no other data support the aberrant point, it will be ignored. 8.2
QC Checks on Data Recording, Reduction, and Storage
All field data cards and monthly sheets will be reviewed for completeness and legibility prior to inclusion in permanent project files. All quantitative data will be entered into Excel spreadsheets for reduction and report production. Multiple copies of all electronic files will be stored at PSU. 9.0
CALCULATION OF DATA QUALITY INDICATORS
This section complements Section 4 (QA Objectives) and Section 7.4 (Internal QC Checks) by providing the formulas used to calculate data quality indicators. Section 4 specifies data quality indicators that will be used; Section 7.4 uses these indicators to generate acceptance criteria; and this section provides the equations used to calculate the data quality indictors to prevent confusion among future data users and reviewers (EPA 1991). Bias and precision in the collection of water quality data (Secchi disk depth, temperature, DO, and turbidity) in this study will be determined by correct calibration of the meters used to make the measurements. Replicate water quality data will be recorded for each particular station on the selected lakes.
6
Oregon Lake Watch QAPP
10.0
2000
CORRECTIVE ACTION
The corrective action plan must include predetermined acceptance limits, the corrective action to be initiated when acceptance limits are not met, and the names of individuals responsible for implementing necessary corrective actions. Routine QC procedures are identified in Section 8 (Internal QC Checks and Procedures) of this plan. This section includes “non-routine” corrective action not described elsewhere in this QAPP. Non-routine corrective action may result from common monitoring activities, such as: (1) performance evaluation audits; and/or (2) technical system audits. Carrie Haag will be responsible for collecting all routine data necessary for assessing whether data quality objectives described in this QAPP were met, making such assessments, and implementing corrective actions (Table 1) as necessary to achieve data quality objectives. If unforeseen logistical problems are encountered in the field, Dr. Sytsma will be responsible for: (1) implementing the necessary modifications of procedures identified in this QAPP to solve the problem; and (2) documenting the problem and corrective action taken in the field notes.
7
Oregon Lake Watch QAPP
11.0
2000
REFERNCES
Carpenter, S.R. and Lodge, D.M. 1986. Effects of Submerged Macrophytes on Ecosystem Processes. Aquatic Botany 26: 341-370. Gilbert, T.W., Behymer, T.D., Castaneda, H.B. 1982. “Determination of Dissolved Oxygen in Natural and Wastewaters,” American Laboratory. Pp 119-134. March. Oregon Department of Environmental Quality. 1996. Water Quality Limited Waterbodies in Oregon (303-d listing). Oregon Department of Environmental Quality, 811 SW 6th Avenue, Portlan, OR 97204. United States Environmental Protection Agency. 1991. Preparation Aids for the Development of Category III Quality Assurance Project Plans. Office of Research and Development, Risk Reduction Engineering Laboratory, Cincinatti, OH. PB91-211920.
8
Oregon Lake Watch QAPP
2000
9