Available online at www.sciencedirect.com
Procedia Computer Science 16 (2013) 323 – 332
Conference on Syst Eds.: C. Paredis, C. Bishop, D. Bodner, Georgia Institute of Technology, Atlanta, GA, March 19-22, 2013.
Organizational Simulation for Model Based Systems Engineering a* bNational
and Mikel D. Pettyb**
Aeronautical and Space Administration, Marshall Space Flight Center Huntsville, AL 35811 bUniversity of Alabama in Huntsville, 301 Sparkman Drive, Huntsville AL 35899
Abstract Organizations creating complex systems often have hierarchical team networks; this structure affects system performance because some teams have greater influence over dimensions of parts produced by other teams. Dimensional interdependencies among components produce ripple-effects; examples include load paths and thermal flows. Simulating such phenomena requires finite element and computational fluid dynamics models. Characteristics, like weight, cost, and reliability can be calculated for parts and summed to accumulate or roll-up the values at subsystem and system levels. This paper describes multi-agent models and simulations of an organization developing a complex system. One model determined that NetLogo can generate a hierarchical model of thousands of highly interconnected teams. A second model accumulates weights and reliabilities of components with some accretion at each level of integration and generates a system level weight and reliability. A simulation generates part dimensions based on team interaction. A second simulation uses a finite element model to demonstrate temperature gradients of parts and agents moving through the structure to transfer heat among the parts. Simulating physical characteristics in an organizational simulation enables an analyst to demonstrate how different organizational structures affect the system performance. NetLogo proved to be a powerful development environment for organizational and system simulations. © 2013 The Authors. Published by Elsevier B.V. Selection and/or peer-review under responsibility of Georgia Institute of Technology Keywords: Organization; Simulation; Systems Engineering
1. Introduction Organizational simulation provides opportunities to explore ramifications of decisions related to systems engineering methodologies, behavioral dynamics, and hierarchical structure of interacting teams. Often, organizations producing large complex systems have hierarchical networks of teams that produce components, assemble subsystems, and integrate the subsystems into the system. Dimensional interdependencies among the components and subsystems produce ripple-effects where a change in one part of the system causes other parts of the system to change. The resulting system has its own internal environment where load paths and thermal flows affect performance, which can be analyzed with finite element and computational fluid dynamic models. Other characteristics, such as weight, cost, and reliability can be calculated for parts and summed or multiplied to accumulate or roll-up the values at subsystem and * Tel.: +1-256-544-5405; daniel.a.oneil@nasalgov ** Tel.: +1-256-824-4368;
[email protected]
1877-0509 © 2013 The Authors. Published by Elsevier B.V. Selection and/or peer-review under responsibility of Georgia Institute of Technology doi:10.1016/j.procs.2013.01.034
324
Daniel A. O’Neil and Mikel D. Petty / Procedia Computer Science 16 (2013) 323 – 332
system levels. This paper reports the development of Multi-Agent Simulations (MAS) of hierarchical team networks that produce parts with interdependent dimensions and analysis of physical characteristics including heat gradients, weight, and reliability. 1.1. Research Objectives Simulating an organization developing a large complex system requires knowledge about organizational structures, team interactions, system interfaces, and multi-disciplinary optimization. Previous simulation development efforts, especially MAS, provide examples for software objects and behavioral algorithms. Organizational interaction models, complexity theory, and multi-disciplinary optimization methods provide ideas on how to simulate the relationships between a large complex system and the organization that develops it. Specific research objectives for this study project included: Simulate interactions within an organization developing a large complex system. Create a proof-of-concept simulation to determine whether the NetLogo MAS development system can generate a highly-connected hierarchical network of thousands of teams in an organization. Create a proof-of-concept simulation to determine whether NetLogo can produce Finite Element Model (FEM) based heat transfer analysis application. Conduct experiments with the organizational network simulation and compare the resulting system weights with a real-world system in this case a General Electric GEnx jet engine. Identify potential relationships between organizational simulation, multidisciplinary optimization, and model based engineering.
describes four simulations developed with the NetLogo MAS development system. The prototypes simulate hierarchical organizational networks and accumulation or distribution of subsystem attributes including weight, reliability, and heat. 2. Organizational Models Within the context of an organizational simulation, how do we define an organization? Kathleen Carley explains "In general, organizations are characterized as: large-scale problem solving technologies, comprised of multiple agents (human, artificial, or both), engaged in one or more tasks; organizations are systems of activity, goal directed (however, goals can change, may not be articulable, and may not be shared by all organizational members), able to act and be acted on by their environment, having knowledge, culture, memories, history, and capabilities distinct from any single agent, having legal standing distinct from that of individual agents" [1] Simulations described in this paper consider interactions or influence among teams and physical characteristics of the system that arise from organizational complexity. 2.1. Influence states and changes accordingly. Each entity in the network has a specifically defined strength of influence over every other entity in the network, and, equivalently, each relationship can be weigh [2]. A simulation described in this paper simulates influence among teams through rules of weighted probabilities. Neighboring teams may either change dimensions of one, both or neither part based on generated random numbers and comparing the number to the rules. 2.2. Organizational Complexity affects Physical Characteristics How does the organizational complexity affect the characteristics of the system? During a design process, MAS can be used either to predict or discover potential design challenges as design teams visualize and interact with data; including spatial and geometric configurations, adjacency and proximity measures, slopes and gradients, time based measurements, structural analysis, environmental system performance
Daniel A. O’Neil and Mikel D. Petty / Procedia Computer Science 16 (2013) 323 – 332
measures and more complexly individual and group d [3]. In the study described in this paper, Finite Element Modeling (FEM) of heat diffusion was applied within the same simulation environment as the MAS organizational simulations. By simulating both the organization and holistic performance of the system, an analyst can determine how organizational changes affect the system. 3. System Design Optimization One method for design optimization involves rearranging a Design Structure Matrix (DSM). A DSM is a square matrix with identical row and column labels. are represented by the shaded elements along the diagonal. An off-diagonal mark signifies the dependency of one element on another. Reading across a row reveals what other elements the element in that row provides to; scanning down a column reveals what other elements the element in that column depends on. That is, reading down a column reveals input sources, while reading across a row indicates output sinks" [5]. Section 4.2 will explain how the simulations used a DSM to generate organizational links. 3.1. Functional Decomposition Thomas Pimmler and Steven Eppinger development of any complex engineered system or product, the function of the device is decomposed into multiple sub-functions so that the team can research solutions for each of the smaller pieces. There are two reasons why this approach is attractive: simplification the smaller problems are generally simpler to solve than the large system; and speed solutions to the sub-problems can be derived in parallel . steps to integration analysis are: (1) decomposing the system into elements, (2) documenting the interactions between the elements, and (3) clustering the elements into architectural chunks. Integration analysis is a process which can translate a given product decomposition into a product architecture and development team structure 4]. Often projects organize teams in accordance with the hierarchical product breakdown structure; so, as a project development team decomposes a system concept, they are also identifying potential teams within the project organization. In recent years, DSM methods started to attract attention for managing the complexity of large engineering systems and complex product development processes [6] 3.2. Design Rules System optimization techniques use a DSM to depict subsystem interfaces. Reorganizing the rows and to subsystems possible to cluster all interactions into small chunks. Rather, several out-of-chunk interactions will remain. These out-of-chunk interactions, which could be either positive or negative, can be viewed as system engineering "flags" which indicate that special attention is required 4]. How is this relevant to organizational simulation? Algorithms can automate the process or reorganizing a DSM and an analyst can visually identify subsystem candidates for combination. Combining the subsystems will reduce the number of interfaces in the large complex system and consequently reduce the number of interacting teams. Part count is useful to track in studying an engineering system because it is related to the challenges of initially launching a system (e.g., to manufacturability) and to the challenges of keeping a system in service (e.g., to reliability)" [8] Integrally bladed rotors (IBRs), also called bladed disks or blisks, are onepiece units that make up the rotating portion of a fan or compressor stage of a jet engine. IBRs consist of several blades (airfoils) attached to a rotor that holds the blades in position and is attached to the other compressor/fan rotors and shaft in the engine. An IBR can be manufactured as a single part or the blades can be welded to [9]. 4. Organizational Simulation Prototypes Objectives of the prototyping efforts included development of two proof-of-concept demonstrations and two organizational network simulations. The first subsection describes one of the proof-of-concept simulations of a 3D hierarchical network simulation depicted in Figure 1. The second subsection describes a peer-to-peer network among teams in an organization. The simulation includes interaction rules that affect
325
326
Daniel A. O’Neil and Mikel D. Petty / Procedia Computer Science 16 (2013) 323 – 332
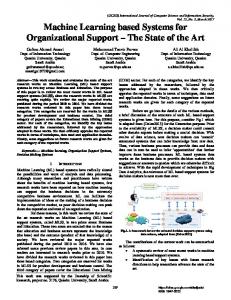
the dimension of the parts produced by the teams. A third subsection describes a hierarchical organization with a graphic layout of concentric rings. Each team in the outer most ring produces components, which are integrated by the teams in the inner rings. The simulation accumulates subsystem attributes including weight and reliability. The last subsection of this section describes a prooff off concept that simulates the diffusion of heat through randomly sized plates in a lattice. These simulations provided an opportunity to demonstrate applicability of the NetLogo MAS development system to simulating large complex organizations. The following subsections describe the development environment and the prototypes developed for this project. 4.1. Hierarchical Network Simulation A 3D NetLogo simulation named generates a hierarchical network. Figure 1 depicts the view frame with linked color cube shaped turtles representing teams in a hierarchical organization. Table 1 lists the numbers of teams at each level and the number of sub-teams under each team. The total of number of teams is 13,649 teams and sub-teams with 34,156 links. This prototype demonstrated the power of NetLogo to represent thousands of interacting objects within a 3D display. This demonstration also enabled timing studies for rendering large complex organizations. With continuous screen updates on, render time for this image was less than two minutes. Adding one more subteam to each team in levels two through six causes the continuous screen update render time to increase to about 30 minutes. Additional timing studies could be done with the screen updating feature turned off. Presently, this program does not include algorithms for exchanging data or navigating among the network nodes. The next two simulations do have interacting nodes in a 2D simulation. Potential follow-on activities include revising the algorithms in the 2D simulations to work in this 3D simulation. 4.2. Radial Layout Network A 2D NetLogo file named 20120723_System_Generator.nlogo contains code that simulates 108 interacting teams and it takes approximately three minutes to finish execution. Figure 1 presents the screen with the view of the 108 teams represented as cyan colored filled circles and the links between the teams represented as grey lines. A few more teams could fit on the screen if the circle shaped turtles were smaller; however, the density of this image indicates a practical limit for representing a large complex network in this layout. A problem with the 3D presentation is the outer teams obscure the inner teams. NetLogo provides functions for hiding turtles, so algorithms could be developed to hide sections of the hierarchy that are not of current interest.
Figure 1 Hierarchical Network and Radial Layout Simulations
Daniel A. O’Neil and Mikel D. Petty / Procedia Computer Science 16 (2013) 323 – 332
Table 1 Teams in Hierarchical Network
An Excel workbook, named System DSM Generator, produces a Design Structure Matrix with randomly generated Level 0 1 Team subsystem names and interfaces. Workbook macros generate a random pattern of ones to represent the interfaces of the Level 1 8 teams 5 system. Another macro generates lists of nodes that define the links in the network. After manually copying the generated Level 2 40 teams 4 lists of links into a text file, a file reader in the NetLogo Level 3 160 teams 4 simulation imports the data to configure the network. These Level 4 640 teams 4 data sets of random numbers serve as stake-holders for future Level 5 2,560 teams 4 data sets that reflect actual or planned systems. While this simulation used randomly generated data, the DSM could Level 6 10,240 teams Total Links represent an actual system if provided with detail about an Total 13,649 teams 34,156 actual PBS. A read-file function in the System Generator NetLogo simulation reads the lists form a text file. A global list-based data structured variable represents the network; Figure 1 depicts such a network. Turtles that represent the teams own data about the parts produced by the teams, and a graphical user interface for with widgets for configuring variables used by the simulations and a view frame for presenting the agents that simulate the teams. During execution, the current team or node of interest turns blue and the current interacting team turns red. During the interaction between the two teams, the link will change from grey to yellow if both teams change the dimensions of the parts they are designing, blue if the team of interest changes its part dimensions, and red if the other team changes its part dimensions. If neither team changes their part dimensions the link remains grey. A function steps through each link connected to the current node of interest and a random number generator determines whether none, one, or both teams will change their part dimensions. If the node of interest has to change its part dimensions, a priority value of the interacting teams determines which team will influence the changes in the length, height, and width of the part. Combinations of the length, height and width are multiplied by a small thickness to determine the Each team has several subteams
subject to high temperatures which require high strength, excellent high temperature creep resistance, fatigue life, phase stability, as well as oxidation and corrosion resistance ]. The company Special Metals produces a superalloy named INCONEL (nickel-chromiumfor applications [that] require resistance to corrosion and heat ]. Multiplying these volumes by the density of INCONEL, 8497 kg/m3, determines the weights of the hollow boxes. INCONEL is one of many materials found in a jet engine; future versions of this simulation could have a variety of materials that are either randomly selected or assigned by the Excel workbook DSM generator. When the weight estimating function completes, it writes the values of the parts to a text file. 4.3. Hierarchical Team in a Radial Layout A third NetLogo simulation, named 20120628_ConcentricRing_Network, presents 752 teams in a hierarchical radial network where the top team is in the middle. Teams at the lowest level, or outer-most ring, generate part weights via a random number generator. Figure 2 presents the graphical user interface and viewing frame for the simulation. Notice the On and Off switch named Accretion? This switch sets a flag in the simulation code that determines whether to add weight at each level of integration. The Accretion Percentage slider bar determines how much of the incoming weight from the lower level to add as the integration weight; for example, if the center is level zero then each team at level four receives parts from two teams at level five, for the current setting, the level four teams add 10% of the incoming weight as the accretion value. As the simulation steps through each of the teams, the color changes from blue to yellow. In Figure 2, the image was captured as about a third of the level five teams handed their weight values up to the level four teams.
327
328
Daniel A. O’Neil and Mikel D. Petty / Procedia Computer Science 16 (2013) 323 – 332 / Proc rro oceedi oc ed diia Com d dia Co C oom mp pu put utter er Sci Sccience S een enc nce 00 nc 00 (201 201 20 0012 123) 000 00 000 00 0 00 00
Figure 2 Hierarchical Radial Layout and Heat Diffusion
Additionally, the concentric ring network simulation calculates system reliability. For each part developed by the teams at level five, a floating point random number generator produces a reliability value between 0.85 and 0.9999. The SystemReliability = (1 - (1 - SystemReliability) * (1 - reliability)) . If the Accretion switch is on then at each level subtracts a small amount of reliability 0.0001; it is assumed that integration of parts decreases reliability by a small fraction. 4.4. Heat Diffusion Simulation A NetLogo file, named 20120716 Multiple Rectangular Plates with HeatTurtles, simulates heat diffusion through randomly sized metal plates with heat transfer among the plates facilitated by turtles. A primary point of this prooff off concept demonstration was to determine capability, offered by NetLogo, to create an FEM simulation. Another reason was to develop a system level simulation that exchanged attributes other than the additive values of weight and reliability. This code builds upon a NetLogo heat diffusion simulation created by Uri Wilensky in 1998.[16] According to the documentation of the original simulation, ) at different rates through different media. These rates can be determined and are called the Thermal Diffusivity of the material. The Greek letter alpha is often associated with this value. The diffusivity of a material does not change based on how much of the material there is. It is always the same. Wood has a lower heat diffusivity than, say, iron. This means that it takes a longer for heat to spread through a wooden object than an iron one. The model allows you to change thermal diffusivity of the plate in two ways. You can directly change the value of ALPHA to any value you like, or you can indirectly change ALPHA by selecting a material [12]. The formula at the heart of the heat diffusion simulation is temperature = (heat-diffusivity * (sum [old-temperature] of neighbors4)) + ((1 - ( 4 * heat-diffusivity )) * old-temperature). The original simulation had a single plate with slider bars around the view area that controlled the constant edge temperatures of the plate. Changing the sliders adjusted the edge temperatures, which would cause the heat to diffuse across the plate. Significant extensions of the heat-diffusion simulation include generation of randomly sized plates distributed across a lattice structure and turtles that horizontally traverse the lattice. If the turtles are hotter than the plate, the heat is introduced to the patches within the plate. If the plate is hotter than the turtle, then some of the heat is transferred from the plate patches to the turtle. An Off and On switch, named Randomizer, on the user interface switches the edge temperatures from being set by the slider bars around the viewing area to being set by random number generators. Figure 2 presents the graphical user interface and viewing area of the simulation. The heat diffusion algorithm can be re-implemented in NetLogo 3D in a future version of this simulation. A powerful idea embodied by this simulation was expressed in the introductory paragraph of the section about Model Based Systems Engineering: within the NetLogo IDE, we have the capability to create a combination of MAS and simple FEM simulations. This capability to integrate the organizational behavior, system structure, and physical phenomena enables holistic systems
Daniel A. O’Neil and Mikel D. Petty / Procedia Computer Science 16 (2013) 323 – 332
thinking and demonstration of ripple effects from decisions. Applying design optimization methods on a DSM could produce a design with fewer organizational and system interface. Attributes of the spatial, energy, information, and material flows could be affected by the team interactions. A FEM for energy and material transfer could demonstrate the ramifications of the decisions. 5. Simulation Validation Approach Two proof-of-concept simulations were developed for this project. The hierarchical network explored visualization of a large highly connected organizational structure with the 3D version of NetLogo. The heat diffusion simulation explored the possibility of creating a Finite Element Model (FEM) in NetLogo. Visual inspection can validate the proof-of-concepts. Figure 1 provides the visual evidence that NetLogo 3D can generate a large complex hierarchical network, which can represent an organization. Figure 2 provides visual evidence that NetLogo can produce a FEM-based heat-diffusion simulation. The intent of the other two prototype simulations was illustrative or intellective. A hierarchical organization with a radial layout represents the process of organizations calculating the weight of a system. Figure 2 is the Hierarchical Organization in Radial Layout with a total of 752 teams. As described in a previous section, the simulation depicted in Figure 2 simply generates random numbers for weights and sums them with some accretion as the weights are handed up through the organization. When an organization estimates the weight of a system, teams at the bottom of the organization hand their weight values up to a common management team; as each layer of the organization receives the weights, the estimate integrators add more weight for integration. Conceptually, this model is valid because it represents the process of multi-layer organizations receiving, summing, and adding additional weight for integration. Typically, organizations use spreadsheets to bookkeep values of the component; this simulation performs the same task with a visual representation of the process. A slider bar on the user interface sets an accretion percentage that the integration teams use to increase the value. This across-the-board single accretion may not realistically represent the integration process within an organization because certain parts of an organization may have greater accretion percentages than other parts of the organization. The organizational simulation depicted in Figure 1 illustrates interacting team negotiations that determine the dimensions of parts produced by the teams. A set of rules determine whether none, one, or both interacting teams increase or decrease part dimensions. Every team has a priority that determines which team has the most influence in the part dimension negotiations. Teams within an organization have varying levels of influence or decision priority and do interact and negotiate on part dimensions; so, conceptually, the model does represent the evolution of part dimensions due to team interactions. A question is whether the rule-based negotiation simulation generates more realistic system weights than a spreadsheet summing random numbers. Two experiments validate the simulation by comparing the summation of random numbers with numbers generated by the interacting team part-dimension negotiations. If the team interaction rules do not produce a significantly better system weight estimate than the simple sum of random numbers then the rules are not contributing any realism. The next section presents experimental results from this comparison. 6. Experimental Results Consider the General Electric GEnx and the Rolls Royce Trent 1000. The Boeing 787 Dreamliner can be delivered with either of these engines. Data sources for Table 2 include values articles about these engines[14][15], the GE Fact Sheet [13], and a BBC documentary about the Rolls Royce jet engine plan in Darby England.[17] Unit part values, number of company divisions and the number of parts per employee were derived through experimentation. The estimated part counts match the company part counts. An interesting future study could be to conduct a similar exercise with a wide variety of companies that produce engines, jets, tanks, and rockets to determine whether there exists a heuristic for estimating part counts based on the system volumes company workforce size and a few other parameters.
329
330
Daniel A. O’Neil and Mikel D. Petty / Procedia Computer Science 16 (2013) 323 – 332
Table 2 System and Organization Attributes
from a spreadsheet and the NetLogo organizational simulation. The dry weight of the Trent 1000 and GEnx are 5,765 kg [14] and 5,816 kg [15] respectively. The density of the Trent 1000 is 190.7and the density of the GEnx is 111. With the unit part dimensions and densities, we can generate random values with the spreadsheet and compare it to bottoms-up, organizationally simulated values. 6.1. Experiment 1: Compare Random Numbers to Simulation Generated Values Table 3 includes the unit weight, which is the unit part volume multiplied by the engine density. Using weight values were generated and divided by 100 to get a weight for a component. The simulation generates weights for 104 parts, so the spreadsheet generates 104 numbers and takes an average. The average value was multiplied by the number of parts in the system and compared to the actual system weight. The simulation includes a unit part length, height, and width set to 0.101m and delta values of 0.04m. During interactions with the other teams, the length, height, and width of the part can increase or decrease by the delta value. The simulation generates 104 part weights, which is summed and multiplied by 481 to get 50,000 parts for the GEnx engine. A single run of the simulator yields 12.85kg for 104 parts; multiplying this value by 481 yields 6,183kg, which is 367kg more than the actual or 6.31% over the actual amount. In this case, the random number generator outperformed the simulator with an error of 1.38%. The simulation did not do too badly considering that the weight is based in the density of Inconel, an alloy used in jet engine parts. The density used by the Excel based random number generator is based on a density derived from the published dimensions and weight of the engine; so, of course the numbers will be close. This experiment ought to be repeated several times to determine whether there is a significant difference f between the spreadsheet and simulator. Experiment 2 does execute the simulation multiple times, in a couple of cases, the percentage error of the simulation output was less than one percent. 6.2 Experiment 2: Compare Weights with Respect to Interaction Rules The simulation includes percentage based interaction rules. Depending on how the percentages are set, the one, both, or neither team will change the dimensions of their parts. Table 4 defines four rule sets. Table 5 presents the results from three trials for each of the rule sets. Hypothesis: Rules do not affect weight. For Rule Set 1,
Table 3 Estimated Part Counts Based on Physical Dimensions
Daniel A. O’Neil and Mikel D. Petty / Procedia Computer Science 16 (2013) 323 – 332
Table 5 Trials and Rule Sets
Table 4 Likely-hood of dimension changes for each rule set
If the random number generator produces a value between 1 and 20 then neither team changes the dimensions of their parts. If the value is between 21 and 40 then the other team changes its part. If the value is between 41 and 70 then the current team of interest changes its part dimensions. If the value is between 71 and 100 then both teams change the dimensions of
in any dimension could be + or 0.04meters. The weight is based on hollow boxes with a wall thickness of 0.001 meters and the density of Inconel at 8497kg/m3. Results from the three trials disprove the hypothesis because in all three cases the numbers generated under the first rule set were significantly better. In two out of three trials, the error percentage was lower than the randomly generated number in Experiment 1. A conclusion to draw from this experiment is that team interaction rules affect the system weight and can lead to values that are closer to reality than randomly generated weights. 7. Conclusions Large complex systems and organizations that produce them need to be optimized as an integrated system. Multi-agent simulations provide a platform for comparing the As-Is and Go-To versions of the organization and system. NetLogo proved to be a powerful development system for MAS and simple Computational Fluid Dynamics (CFD). Additional NetLogo functions that could be applied in future work include System Dynamics, exporting Java applets for websites, and Local Area Network (LAN) based applications. A general purpose simulation development environment enables the simulationist to focus on the problem instead of having to spend a lot of effort creating code libraries. Previous paragraphs mentioned Excel and an ontology editorExperiments conducted with one of the prototype simulations determined that the interaction rules did affect the system weight and produced realistic numbers. Knowledge gained during the research of previous organizational simulation development efforts and the experience of using the simulation taught a lesson that it is important to design the experiments before developing the simulation. When developing a simulation a good place to start are the questions, which help define the use-cases, which help define the classes, etc. While the random number data-sets provided a lot of freedom during the design process, it is important to work with real data about organizations and systems. A large complex system like a jet-engine or rocketengine is too much for a single individual to capture every detail. A small appliance like a toaster or chainsaw might be a good starting point for developing the end-to-end model based engineering process described in this paper. Dismantling an old appliance and studying the owners-manual can provide detailed data for an ontology that describes the system. Operations research and business school papers along with company websites and Youtube videos can provide insight to the manufacturing company which can supply the organizational structure side of the ontology.
331
332
Daniel A. O’Neil and Mikel D. Petty / Procedia Computer Science 16 (2013) 323 – 332
Future Work Four independent simulations were developed to explore the capabilities of NetLogo to simulate hierarchical organizations and physical characteristics of the system to be developed by the organization. Future efforts can focus on integrating these simulations either through the NetLogo Hubzone functions or network communications implemented though the application programming interface. Another approach to integration could be process oriented where simulations import and export data from a data file; for example, a future version of the concentric ring network simulation could read the weight data file generated by the System Generator simulation. Genetic algorithms could be applied to the DSMs to optimize the organizations and the system designed by the organizations. Acknowledgements The first author appreciates Dr. Paul Collopy for his guidance in the development of simulations developed during this study project; his explanations of the real-world problem, constructive comments, and encouragement gave the author insight and energy to produce the study products. The NetLogo heat diffusion simulation provided an excellent example and starting point that saved a lot of time; so, this author appreciates the work of Dr. Uri Wilensky. References 1. 2.
3. 4. 5. 6. 7. 8. 9. 10. 11. 12. 13. 14. 15. 16. 17.
Carley, K.: Intra-organizational Complexity and Computation. A report funded by Grant No. N00014-97-1-0037 and by the National Science Foundation under Grant No. IRI9633662; December 2000. Wei Pan, W.: Modeling Dynamical Influence in Human Interaction. IEEE Signal Processing Magazine (March 2012) http://www.cos.cs.cmu.edu/publications/papers/overview2.pdf Kavulya, G., Gerber, D., Burcin, B.-G.: 'Designing In' Complex System Interaction: Multi-Agent Based Systems for Early Decision Making. In : International Association for Automation and Robotics in Construction (June 2011) Eppinger, T.: INTEGRATION ANALYSIS OF PRODUCT DECOMPOSITIONS. In : ASME Design Theory and Methodology Conference (September 1994) Browning, T.: Applying the Design Structure Matrix to System Decomposition and Integration Problems: A Review and New Directions. IEEE TRANSACTIONS ON ENGINEERING MANAGEMENT 48(3) (AUGUST 2001) YASSINE, A.: Connectivity maps: modeling and analysing relationships in product development processes. Journal of Engineering Design 14(3), 377 394 (2003) Sosa, M., Eppinger, S., Rowles, C.: The Misalignment of Product Architecture and Organizational Structure in Complex Product Development., INSEAD (2004) Frey, D.: Part Count and Design of Robust Systems. In : INCOSE Obaid Younossi, M.: Military Jet Engine Acquisition Technology Basics and Cost-Estimating Methodology., RAND (2002) Lepeulas, L.: Superalloy. In: Wikipedia The Free Encyclopedia. Available at: http://en.wikipedia.org/wiki/Superalloys. Accessed August 3, 2012. Special Metals: INCONEL. In: Special Metals company website. Available at: http://www.specialmetals.com/documents/Inconel%20alloy%20600%20%28Sept%202008%29.pdf. Accessed August 3, 2012. Wilensky, U.: NetLogo Heat Diffusion model. Available at: http://ccl.northwestern.edu/netlogo/models/HeatDiffusion. Accessed July 24, 2012. General Electric company: Fact Sheet GE. Available at: http://www.ge.com/company/factsheets/corporate.html. Accessed July 26, 2012. http://www.theengineer.co.uk/sectors/aerospace/indepth/dream-factories/1014251.article Gas Turbine Engines. Aviation Week & Space Technology Source Book 2009. p 118. Wilensky, Uri, Heat Diffusion web page, Netlogo Modeling Commons website, 1998. http://ccl.northwestern.edu/netlogo/models/HeatDiffusion How to Build a Jumbo Engine BBC Documentary, December 2009. https://www.youtube.com/watch?v=VfomloUg2Gw