Vol.6(7), pp. 131-140, September 2014 DOI: 10.5897/IJEAPS2014.0370 Article Number: A95911446966 ISSN 2141-6656 Copyright © 2014 Author(s) retain the copyright of this article http://www.academicjournals.org/IJEAPS
International Journal of Educational Administration and Policy Studies
Full Length Research Paper
Orientation impact on performance of undergraduate students in University of Cape Coast (Ghana) Georgina Asi Owusu*, Millan Ahema Tawiah, Cynthia Sena-Kpeglo and Jeff Teye Onyame University of Cape Coast, Ghana. Received 28 May, 2014; Accepted 22 August, 2014
Orientation is widely conceived to encompass activities that support the transition into educational institutions. The University of Cape Coast, Ghana places a premium on orientation for fresh year students and yet the impact of such programmes on students’ performance remains a difficult thing to determine. This study, therefore, focuses on finding out the impact of orientation on the academic performance of students. The study used the descriptive survey design and multiple sampling procedures to select 250 Level 200 students from the university. Data were collected primarily through questionnaire. The results revealed among other things that orientation programmes provide fresh students with good academic information regarding academic programmes, policies and regulation that enhance students’ learning. Also, it came out that participation in orientation significantly and positively impacted their academic performance. The outcome also showed that a significant difference existed in the mean Cumulative Grade Point Average (CGPA) scores of students who participated in the 2012 orientation programme for fresh students and those who did not. Based on these findings, a recommendation was made for organisers to plan orientation programmes geared towards helping students to maximise learning. Key words: Students’ orientation, UCC, CGPA scores. INTRODUCTION Orientation can be considered as any effort by an institution to help students make a successful transition from their previous environment into the collegiate experience (Upcraft and Farnsworth, 1984). The goals for such programmes may include academic preparation, personal adjustment, and increasing awareness of students and parents during the transition process (Perigo and Upcraft, 1989; Cook, 1996). Although orientation programmes have been part of the higher education landscape for more than a century, it was not until recent decades that these types of programmes have gained
popularity and numbers. Strumpf et al. (2003) found that, between 1980 and 2000, more students and parents were attending orientation programmes. Hunter et al. (2003) estimated that 74 per cent of the institutions of higher learning within the United States have an orientation course or first-year seminar. Institutions of higher education realize the value of these programmes in addressing transitional issues for the many types of students enrolling in higher education. Some studies attributed the higher Cumulative Grade Point Averages (CGPAs) of student participants due to
*Corresponding author. E-mail:
[email protected]. Authors agree that this article remain permanently open access under the terms of the Creative Commons Attribution License 4.0 International License
132
Int. J. Educ. Admin. Pol. Stud.
chance (Sidle and McReynolds, 1999), while some studies found non-participants to have earned higher GPAs (Prola et al., 1977; Mark and Romano, 1982). Suffice it to say that the literature on orientation programmes and courses yielded varied results as it relates to the impact on academic performance (Nadler and Miller, 1997). Despite the broad recognition of their potential, institutions of higher learning in Ghana such as the universities struggle with little success in transitioning students through orientation. Studies in the United States, however, have placed the first-year retention rate for community colleges at slightly less than 50 per cent (Rode, 2004). Perhaps the challenge of public universities to successfully transition and retain students in the university environment has much to do with the kinds of students that are enrolling in these institutions. In the USA, Community-college students are often first-generation and lower-ability students (Cohen and Brawer, 2003). Some years back, the University of Cape Coast, Ghana offered no pre-enrollment orientation programme or intervention that gave new students an overview of the university. At that time, students had two methods by which they could enroll in courses at the university: they could only self-advise, and or they could visit an advising office (Student Affairs Section) to receive information about placement testing and programme requirements. With only these avenues of entry into the university, research has shown that as a result, students often lacked comprehensive information regarding curricula requirements and had a limited understanding of course requirements (Gentry et al. 2006; Booker, 2006). Again, students who opted to participate in orientation were often faced with long queues at both the designated venues for the orientation and registration of students (Hollins, 2004). Students also lacked important knowledge about institutional policies, services, courses and resources on campus that could aid them in a successful transition into the university and ultimately help them achieve their academic goals. If orientation programmes (which, target fresh men and women) are so important, then what is their impact on the academic performance of students? It is in a quest to seek answers to these glaring questions that the researchers have been motivated to put this study into being.
Statement of the problem Perhaps one of the most under emphasised strategies for achieving student success within the university is the development and implementation of orientation for new students to the university environment. The University of Cape Coast, like other public universities have always made orientation a core item for fresh year students. Despite the importance of orientation to the new
students, literature on the subject is very scanty if not unavailable especially in Ghana where the subject of orientation is virtually swept under the carpet. In other words, very little research has been conducted in the Ghanaian context to show the effects of new-students’ orientation programmes on students’ academic success. The knowledge gap created provided the researchers the sufficient impetus to conduct this study. The primary purpose of this study was to explore impact of orientation programme on students’ academic performance (CGPA) in the University of Cape Coast.
Research questions/hypotheses In order to delve into the subject under study, a research question and two research hypotheses were formulated. 1. What are students’ views on the significance of the orientation programme for fresh students in the University of Cape Coast? 2. H0: There is no significant correlation between participation in students’ orientation programme and academic performance of students. H1: There is a significant correlation between participation in students’ orientation and academic performance of students. 3. H0: The mean CGPA scores of second year students who participated in the 2012 orientation programme were not statistically different from the mean CGPA scores of students who did not take part in that orientation programme. H1: The mean CGPA scores of second year students who participated in the 2012 orientation programme were statistically different from the mean CGPA scores of students who did not take part in that orientation programme.
Significance of the study The outcome of this research has significant implications for designing and implementing strategic support interventions for fresh year students in our tertiary universities. This material would provide insight into university authorities and the public relation unit on the rudiments of efficient organization of orientation programmes for undergraduate students. Again, the current study could be potentially beneficial to undergraduate students in particular and graduate students in general since it would expose them to the importance of participating in orientation programmes. The study would also serve as a framework for evaluating the success or otherwise of future orientation programmes for students in tertiary institutions. Finally, this study would provide an excellent starting point and an appropriate literature base for
Owusu et al.
133
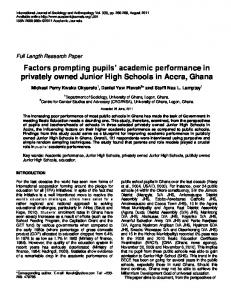
Figure 1. The W–Curve Model showing process of students’ adjustment to new learning environments (Zeller and Mosier, 1993).
those who wish to further interrogate other dimensions of students’ orientation in Ghana and elsewhere.
have some feelings of homesickness mixed in with all of the fun and energy of a new beginning.
THEORETICAL FRAMEWORK
Culture shock
The W-curve
At this stage, the newness of the college culture begins to wear off. Students then begin to deal with the reality of all the adjustments (that is, roommates, eating in a cafeteria, and the diversity that comes with meeting people from different backgrounds and cultures). Academic adjustments that are unfamiliar territory of the college classroom, large lecture classes, unclear guidelines for note taking and studying, and unfamiliar and somewhat distant faculty). Routine tasks become problematic chores (that is, where to go shopping, get a haircut, or receive medical attention). At this point, homesickness may increase (that is, maintaining strong ties to their home community, going home on weekends, staying in constant contact with friends from home, and continuing a romantic relationship). This is a period of positive change, and a period of intense personal conflict and anxiety.
The W-Curve is a predictable pattern of stages which occurs when a person experiences cultural shock. This is based upon research done with students studying abroad. Zeller and Mosier (1993) found that the W-Curve could also be applied to first-year college students and the phases they go through in adapting to a new culture. It is normal to have the ups and downs of the W-Curve, and knowing about this may help make the transition easier. At the first signs of culture shock, some first-year students may think this means they have made a mistake about going to college or university or that they have chosen the wrong institution. With time this doubt in their minds gets cleared with orientation. If they see that this is just part of a journey that everyone goes through, they may be better able to take it all in stride as shown in Figure 1.
Initial adjustment The honeymoon Honeymoon starts before students first arrive on campus (ie., school packets, housing assignments, orientation and moving away from parental oversight). Overall feeling here is often characterised by one of excitement and positive anticipation. It is common for students to begin to
First-year students experience an upswing as they have successfully managed many of the issues that have come their way. Overcoming the culture shock which is achieved largely through orientation brings about a sense of well being. Students fall into a routine as they gain confidence in their ability to handle the academic and
134
Int. J. Educ. Admin. Pol. Stud.
social environment of campus life. Orientation helps them at this stage to regain some sense of control and normalcy in their lives. Conflicts and challenges may still continue to come and go, but students would now be feeling more in the swing of things until they experience the phase of mental isolation.
Mental isolation At this juncture, first-year students relapse into a sense of isolation as they compare new culture and home culture (that is, especially after students go home for an extended break between semesters). They experience strong feelings of homesickness. They feel caught between two worlds and not totally belonging in either place. The new college environment is still not as comfortable as home, and home is now not as familiar as it once was. The initial euphoria of the entrance into the university dissolves as the realities of campus life surface (that is, not all professors are friendly and helpful, not all living-group peers are potential friends, and everything is not as great as publicity brochures and admissions staff may have indicated). They may feel their beliefs and values systems being challenged, and they may not be able to adapt or integrate the new values of the university cultures. Firstyear students must seek resolution to this second cultural shock, move from feelings of isolation, and join new university cultures. This requires integrating values and beliefs of their home culture with their new university environment.
Acceptance, integration and connectedness As students become more involved in campus opportunities as a result of orientation, they gain some history with new friends, get to know some faculty and staff members, they begin to feel a true connection to the campus community. They begin to have a balance and realistic view of the university; they see and integrate the good experiences with the challenges. The original home culture becomes somewhat foreign where there is less dependence on parents and former peers. A true sense of acceptance, integration, and connectedness occurs when students have successfully adapted to their new learning environment through orientation. The question one may ask is “what is the impact of orientation then on student success?” The ensuing pages of this study would attempt to handle this issue.
Impact of orientation on student success Very little research has been conducted to show the effects of pre-college, new-student orientation programmes
on student success as defined by academic performance and student retention, and even fewer studies have examined the impact of these programmes on the success of students within the community college. However, Busby et al. (2002) found that students who participated in newstudent orientation programmes generally performed better academically than students who did not. Perhaps this conclusion could be explained by the notion that students who participate in orientation programmes are more likely to miss fewer classes, participate in more extracurricular activities, talk with faculty and staff about personal concerns, become friends with those whose interests were different from their own, and attend lectures or panel discussions (Gentry et al., 2006). In general, students who participate in new-student orientation programmes are satisfied with them (Bumgarner et al., 1997; Booker, 2006) and believe that the programmes provide good academic information and develop personal relationships (Nadler and Miller, 1997). Over the past twenty years, numerous studies have been conducted to examine the impact of an orientation course on students’ experiences in college. Much of the research on this type of intervention focused on participation in these types of courses and its relationship with academic performance, as well as student retention and/or persistence. In terms of the impact of orientation courses on academic performance, mixed results have been found. Several studies have found significant differences in grade point averages (GPAs) between students who participated in orientation courses and those who did not (Yarbrough, 1993; Brunelle-Joiner, 1999; Starke et al., 2001). Other studies attributed the higher GPAs of participants to chance (Boudreau and Kromrey, 1994; Stewart, 1997; Green and Miller, 1998; Sidle and McReynolds, 1999), while some studies found nonparticipants to have earned higher GPAs (Prola et al. 1977; Mark and Romano, 1982). Suffice it to say that the literature on orientation programmes and courses yielded varied results as it relates to the impact on academic performance. The majority of studies examining the impact of orientation courses on student retention found higher retention rates for participants in these courses, whether statistically significant (Boudreau and Kromrey, 1994; Green and Miller, 1998; Sidle and McReynolds, 1999; Hollins, 2004) or by chance (Yarbrough, 1993; Stewart, 1997; Brunelle-Joiner, 1999). About 16% of students who enter a four-year institution leave during the first year or do not return for their second year (Horn, 1998). Most students who leave do so only temporarily, as, 64% return to a college within 6 years, but these students are generally at a disadvantage in that they either experience a longer time to degree or are less likely to earn a bachelor’s degree (Choy, 2002). Clearly, stopping out, dropping out, or transferring out has a negative impact on the cost of higher education and degree attainment rates. Institutions have developed an
Owusu et al.
array of first-year attrition intervention programmes, such as orientation programmes for first year students, to encourage student success in the first year. A large body of literature indicates that orientation programmes for first year students have a positive impact on their academic and social integration, key concepts of persistence proposed by Tinto (2006-2007). For example, researchers have shown that seminar participants earn, on average, higher grades in other first-year classes and are less likely to be placed on academic probation (Cannici and Pulton, 1990; Chapman and Reed, 1987; Davis, 1992; Fidler, 1991; Williford et al., 2001); they have higher frequencies of participation in campus activities or services (Cannici and Pulton, 1990; Davis-Underwood and Lee, 1994; Fidler, 1991); and they report more outof-class connections with faculty members (DavisUnderwood and Lee, 1994; Fidler, 1991). Other studies have investigated how students’ characteristics impact the outcomes of orientation programmes for first year students.
The current content of students’ orientation at the University of Coast The University of Cape Coast, as a routine, exclusively devotes one week for orienting their new student entrants (University of Cape Coast, 2012). Virtually, the programmes lined-up are packed with connoisseurs in the various fields; ranging from the academic to the administrative staffs in the university who address the fresh men and women. The first day is devoted to the opening ceremony where the chairperson, usually the Vice-Chancellor or the Pro-Vice Chancellor, the Dean of Students and the Registrar address them. On this day, the freshmen/ women are addressed on a wide range of issues touching on overview of communicative skills, energy conservation in the university, health services, academic programmes, policies and regulations, and a question time. On the subsequent days and sessions, topics such as ‘succeeding in the world of learning, regulations for junior members (students), sports, disability services, campus security services, dating on campus are often shared with students (UCC, 2012). Again, topics which touch on the structure of the university/channels of communication, the university policy on sexual harassment, immigration requirements for foreign students, library services, counselling services in the university, issues about the student loan scheme, speeches by student leaders (Students Representative Council, Graduate Students Association of Ghana, Ghana National Association of Teachers on Campus, Local NUGS among others where the university anthem is taught. Finally, the remaining programmes touch on the overview of faculties, schools and academic departments. These sessions are addressed by their respective officers found in the various
135
sections of the university. At any point in time, students are allowed to pose questions to which the resource persons and facilitators respond (UCC, 2012).
Objectives for student orientation in the University of Cape Coast The university administration expects that during orientation programme, new students would be provided with the necessary information and assistance that help them to succeed academically and develop their personality. It is also the aim of the university to expose new students to the wide range of issues that would face them as students of this institution including safety and health matters. Orientation sessions are to again provide students the opportunity to meet one another and develop new relationships, from which could emerge new friends who may turn out to be peer counselors and who can share their experiences thereby serving as an important source of support and information. Finally, orientations are organized to purposively introduce new students to the variety of student services available on and off campus so that they are able to navigate the university and its environment on their own (University of Cape Coast, 2012). In conclusion, it can be said with absolute certainty that the above objectives largely inform the selection of topics which are dealt with during orientation programmes. At the end of the day, it is expected that new students feel, and indeed, be adequately prepared to face the challenges of their stay in the university right from the commencement of their programmes of study. METHODOLOGY Research design The researchers used the descriptive survey design to enable them examine the current characteristics of the issue under study. The rationale for the use of this design was to afford them the opportunity to determine the nature of orientation programmes as it pertained in the university.
Population The target population for the study comprised Level 200 students in all the public universities in Ghana. The accessible population consisted of second year (Level 200) students in the University of Cape Coast. These students were chosen since they were deemed still fresh students who can vividly recall memories of some of the activities that they were taken through as part of orientation, their inauguration and integration into the university system.
Sample and sampling procedure Two-hundred (250) second year students were sampled from the
136
Int. J. Educ. Admin. Pol. Stud.
University of Cape Coast. This sample size was obtained after using multi-stage sampling techniques. In the first place, a purposive sampling procedure was employed to sample students from eight faculties/schools which run undergraduate programmes. These were; School of Business, School of Medical Sciences, School of Biological Sciences, School of Physical Sciences, School of Agriculture, Faculty of Arts, Faculty of Social Sciences and Faculty of Education. Schools and faculties that run only postgraduate programmes such as; the Faculty of Law and the School of Graduate Studies and Research were excluded from the study. Second, disproportionate quotas were given to each school/faculty to get the student number. Finally, purposive sampling was used to get 250 students from the eight faculties/ schools. Instruments Basically, a questionnaire was used as the major tool for data collection. The items of the questionnaire were carefully carved to encapsulate the variables of interest to the researchers to obtain the needed quantitative data from respondents. The survey instrument was appropriate for the study because it provided researchers the opportunity to conceal the identities of the respondents thereby revealing realities on the ground as far as organization of orientation for fresh students was concerned. Regarding the source of the secondary data (CGPAs), students were required to provide their registration numbers on the questionnaire which enabled the researchers to check their actual CGPAs from the students’ Records and Management Information System (SRMIS) of the University with the help of the system’s analyst at the section. The instrument was purposively pilot-tested at the University of Education, Winneba, a sister university in the central region on 100 second year students as a measure to improve its content validity and reliability. A Cronbach’s alpha test which was run yielded a reliability coefficient of 0.76, a figure that was indicative that the individual items of the survey instrument were internally consistent in measuring the constructs they are supposed to measure. Data collection procedure The quantitative data were collected by the researchers in the University of Cape Coast with the help of three research assistants in the University of Cape Coast. These research assistants, having been trained on the rudiments and the rationale for the study, were engaged to collect reliable data for the study. The researchers organised the data, edited and analysed them. Data analysis To assess the impact of the programme on academic performance, both descriptive and inferential statistics were used. Inferential tools such as the Pearson Product-Moment Correlation and a t-test were calculated using SPSS version 20. The former was used to find the relationship between participation in orientation and students’ academic performance and the latter was also employed to compare the mean CGPAs of second year students who participated in the study and those who did not.
RESULTS AND DISCUSSION Biographic description of respondents Profile of student respondents in respect of their sex,
age, schools/faculties/departments and their CGPA ranges was provided in the descriptive analysis as presented in Table 1. Out of the 250 students selected, 85(34%) were from the Faculty of education, 42(16.8%) from Faculty of Social Sciences, 37(14.8%) from School of Agriculture, 31(12.4%) from School of Biological Sciences, 25(10%) from School of Physical Sciences, 24(9.6%) from Faculty of Arts and 6(2.4%) from the School of Medical Sciences. The participants in terms of gender were made up of 149(59.6%) males and 101(40.4%) females. With reference to age, 206(82.4%) were below 30 years whereas the 44(17.6%) were 30 years and above. In terms of their participation in the 2012 orientation programme, 167(66.8%) intimated that they participated in the said programme even though 83(33.2%) did not participate for various reasons. Their CGPAs were determined based on the interpretation provided by the Division of Academic Affairs of the University. Here, 14(5.6%) had their CGPAs between 3.6 – 4.0 (first class), and 53(21.2%) of them had theirs ranging between 3.0 – 3.5 (second class upper division). Then 149(59.6%) of them had their CGPAs ranging between 2.5 – 2.9 (second class lower division). Of the total, 31(12.4%) had their CGPAs ranging between 2.0 - 2.4 (third class), and three (1.2%) between 1.0 – 1.9 (pass). The picture this paints is that at least the students had acquired the necessary experiences to be able to contribute meaningfully to the study. This is so because at least for the purposes of academic categorisation, it can be said that 216(86.4%) of the students the researchers dealt with were above average and good students who could easily state whether the orientation impacted their academic work in any way.
Research question 1 In soliciting students’ responses on the significance of orientation programmes, the views were dissenting. For instance, a majority of them 199(79.6%) strongly agreed with the assertion that orientation provided fresh students good academic information regarding academic programmes, policies and regulation that enhance student learning. The same number again agreed that orientation gave new students opportunity to fraternise and develop personal relationships in the university and that it gave students insight into ways of succeeding in the world of learning. Again, 215(86%) agreed that indeed orientation provided students the opportunity to ask questions that bordered them and so it helped fresh students get accurate information on all matters including that of security on campus. However, 79(31.6%) also opined that orientation programmes afforded them the opportunity to gather information on activities of student leaders and on religious activities on campus though on that same
Owusu et al.
Table 1. Bio-graphic description of respondents for the study.
Bio-data Faculty/School Faculty of education Faculty of Social Sciences School of Agriculture School of Biological Sciences School of Physical Sciences Faculty of Arts School of Medical Sciences Total
Frequency
%
85 32 37 31 25 24 6 250
34 16.8 14.8 12.4 10 9.6 2.4 100
Age Below 30 Years 30 Years and Above Total
206 44 250
82.4 17.6 100
Gender Male Female Total
149 101 250
59.6 40.4 100
CGPA Scores 3.6 – 4.0 (1st Class) 3.0 – 3.5 (2nd Class Upper) 2.5 – 2.9 (2nd Class Lower) rd 2.0 – 2.4 (3 Class) 1.0 – 1.9 (Pass) Total
14 53 149 31 3 250
5.6 21.2 59.6 12.4 1.2 100
subject, 171(68.4%) disagreed with the statement. Then 242(96.8%) of them agreed that orientation helped them to be abreast of the university anthem in their quest to become proud members of the new institution (university). Finally, 193(77.2%) of the students agreed with the statement that orientation programmes went a long way to improve the academic work of students who became committed to them even though 47(18.8%) disagreed with that view with 10(4.0%) of them being neutral on the matter. Clearly the finding showed the extreme importance students viewed orientation programmes. This outcome dovetails into the broader objective of the university for instituting orientation for fresh students which say among other things that orientation in the University of Cape Coast is organised to purposively introduce new students to the variety of student services available on and off-campus so that they are able to navigate the university and its environment on their own (University of Cape Coast, 2012)
137
Hypothesis 1 Table 2 portrays the correlation findings from the students. The hypothesis for this part of the study sought to find out whether there was a relationship between participation in orientation and academic performance denoted by students’ CGPA scores. Testing was done at .05 significance level (2-tailed, non-directional hypothesis). From Table 1, the outcome shows there is a significant variation in the academic performance of students who participated in orientation programmes and those who did not. Mathematically, r(250) = .74, p < .05; suggesting that there was a strong positive significant correlation between participation in orientation and CGPA score of students (r = .74, p = .002). By implication, students who participate highly in the orientation programme are likely to have high CGPA scores and those who do not participate in orientation programmes are also likely not no to have high CGPAs. This means that a relationship existed between participation and performance in terms of CGPA score. Thus, students who participated fully in the 2012 orientation programme were likely to record high CGPA scores than their counterparts who did not. On the other hand, because of the strong positive relationship between participation and performance, students who do not take part in orientation may likely not do well academically. Contrary to the findings of study by Sidle and McReynolds (1999) which attributed higher CGPAs of students to chance, the finding of this research has shown that the relationship is not and cannot be by chance. In contrast to this finding, Prola et al. (1977) and Wright et al. (1982) in their study some decades ago, found non-participants to have earned higher GPAs. In this case, the relationship between participation in orientation and GPA level was negative. Hypothesis 2 This hypothesis was analyzed by comparing average CGPA scores of second year students to ascertain whether those who participated in the 2012 orientation programme had similar CGPA scores with those who did not take part in the orientation for that year. The emphasis was on the statistical significance in variations or other wise of their average CGPAs and Table 3 was used for this purpose. The t-test was used and the statistical testing was done at .05 alpha level. It can be seen from the table that, the mean CGPA score of participating students in the first category (M = 2.86) was greater than the mean CGPA score of the nonparticipating students (M = 2.14). This difference was significant at the .05 level (t(246) = 12.148, p = .033); suggesting that the impact of the orientation on the participating students has been positive and it is translating in
138
Int. J. Educ. Admin. Pol. Stud.
Table 2. Correlation between student participation in orientation and CGPA scores after a year.
Variables Students’ Participation CGPA Scores
N 250 250
Mean 3.62 2.93
SD 1.94
R .74
Sig. .002*
* p