Available online at www.sciencedirect.com
Procedia ProcediaEnvironmental EnvironmentalSciences Sciences7 (2011) 7 (2011)116–121 1–11
1st Conference on Spatial Statistics 2011
Origin Distribution Visualization of Floating Population and Determinants Analysis: a Case study of Yiwu City Hongsheng Lia*, Yingjie Wang a, Jiafu Hana, Zhuoyuan Yua a
LREIS, Institute of Geographical Sciences and Natural Resources Research, Chinese Academy of Sciences China
Abstract Based on registered individual floating population data from 2005 to 2008 of Yiwu, the phenomena that population floating to Yiwu City from 34 province and 91 counties in Jiangxi provinces is analyzed. The study aims at analyzing the “pull” forces of Yiwu City and developing migration models for understanding determinants factors of population migration/floating into Yiwu City from other areas in China. The spatial layout of Yiwu’s pull forces is proved as a V-shaped pattern consisting of the two axes by using explorative spatial data analysis and map visualization method. The migration models with (model 3) or without (model 2) migration stock are presented and estimated using standard linear regression model, spatial error model as well as spatial lag model at the county scale in Jiangxi province. Based on the likelihood statistics, the AIC and the Moran’s I statistics of residuals, the model with migration stock provides an improved fit over the model without migration stock. The correlation between migration ratio and man land ratio is significant at the 0.5 level according to estimates of model 3 and spatial version of model 2. All the three estimates of model 2 and the OLS results of model 3 confirm the distance-decay effect while results from the spatial version of model 3 failed to support the distance rule in population floating. Contrary to the previous studies at the provincial level, the correlation between per capital net income of rural labor forces and migration ratio is not significant according to the three versions of the two models due to the small disparities of income within the counties in Jiangxi. Examination of specification tests in spatial version of model 3 indicates that there is less significant spatial error dependence in the spatial lag models than spatial lag dependence in the error models, further suggesting a preference for the lag model. Model 2 does not suggest any preference for choosing spatial error model and spatial lag model.
© peer-review underunder responsibility of Spatial Statistics 2011 © 2011 2010 Published Publishedby byElsevier ElsevierLtd. Ltd.Selection Selectionand and/or peer-review responsibility of [name organizer] Keywords: Floating population; Origin distribution visualization; Spatial regression model; Yiwu City; GIS
* Corresponding author. Tel.: +86-10-64888041; fax: +86-10-64889630. E-mail address:
[email protected].
1878-0296 © 2011 Published by Elsevier Ltd. Selection and peer-review under responsibility of Spatial Statistics 2011 doi:10.1016/j.proenv.2011.07.021
Hongsheng Li et al. / Procedia Environmental Sciences 7 (2011) 116–121
1. Introduction Population migration and floating is a complex social-economical phenomenon. Ravenstain [1] discussed the rules of migration for the first time. Bague [2] proposed the “push and pull theory” which indicated that people move to other places only when their living conditions can be improved. Lee [3] conceptualized migration as involving origins, destinations and the links between them. Spatial interaction model based on gravity theory [4] is the most common types of migration models and examples of the application include [5]. Multinomial logit model to migration based on discrete choice theory [6] has been applied in micro level [7, 8]. In these models, the determinants have been categorized as follows: demographic factors, social and cultural factors, economic factors, housing factors, spatial and environmental factors [9]. Todaro [10] and Richard’s [11] analysis led to a better understanding of the factors in developing countries. In the last few decades, spatial statistics and spatial econometrics [12] has drawn demographers’ attention recently [13]. Few of existing migration modeling researches integrate spatial dimension into migration model for unconsciousness of importance of spatial effect. Differences of income between urban and rural areas are recognized as the main forces of floating of Chinese population at the provincial scale [13, 14]. Few empirical determinants studies of population floating are conducted on smaller scale for non-availability of data. Due to the rapid growth of market economy, China is witnessing great population movements which have never been seen in recent years. Currently there are more than 2 hundred million floating population such as migrant workers all over the country. This study aims at analyzing the distribution pattern of origins of population floating into Yiwu City and at developing migration models for understanding migration determinants. 2. Study area and data sources The study areas include two different types, origins and destinations. In this paper, Yiwu is the destination area; counties in Jiangxi province are the origin areas. Yiwu City is located in the central area of Zhejiang province, China. The whole city has a population of 723.9 thousands registered as household and more than 1114 thousands as temporary residents at the end of 2007. Jiangxi lies between Zhejiang, Fujian, Guangdong, Hunan, Hubei and Anhui. The proportion of population engaged in agricultural production in Jiangxi is 44 % in 2007. The per capita net income of farmers is 4098 yuan, only half of the farmer income in Yiwu City. The floating population data come from Yiwu Municipal Public Security Bureau. The spatial data include the administration division polygons at the province-level and the county-level in China. Other data like total population, man land ratio and the annual per capita net income of rural households etc. has been obtained from the Statistical Yearbook of Jiangxi Province (2008). 3. Methodology Floating population data preprocessing involves four steps to set up the analysis datasets. To begin with, aggregate the individual data with geographic region code in identification card number, at different levels. The process is more difficult at the county level and the following steps will describe this level. Then, join the aggregated floating population data with the administrative division polygon data by county name. Furthermore, check the record which does not match and match them according to region name, geographic code and relative records on the adjustment of administrative divisions as much as possible. Finally, if there are still some unmatched regions left, distribute the floating population numbers to each county in average for each province. ArcGIS software (ESRI) has been used to build the datasets.
117
118
Hongsheng Li et al. / Procedia Environmental Sciences 7 (2011) 116–121
After acquiring the spatially enabled floating population dataset, the explorative spatial data analysis and map visualization method have been used for distribution pattern analysis of floating population, so far two types of analysis have been made, the first is floating population from different provinces in China, the other is counties in Jiangxi province which has a large population flock into Yiwu City. Generally speaking, an ESDA is composed of visualizing spatial patterns exhibited in the data, identifying spatial clusters and spatial outliers, and diagnosing possible misspecification of spatial aspects of the statistical models, all of which can help better specify regression models [5, 6]. The Moran’s I statistic [7] of floating population has been calculated by using Geoda software. Choropleth map of migration ratio and multi-ring buffer from Yiwu City in Jiangxi have been overlaid to expose the floating pattern. The determinant analysis tries to reveal what is behind the floating phenomena that people from different origins to Yiwu City. According to Todaro[10], the migration model is specified as
Mij / Pi = f (Dij , X i , X j )
(1)
where M ij / Pi refers to migrant ratio and most of the time is used as the dependent variable in the mode. Many empirical results implied that selection of appropriate variables are crucial in migration modeling, because variable selection must be based on the specific county or areal contexts on the one hand, and is also dependent upon the data availability on the other hand [20]. According to previous study and current conditions, several variables like man-land ratio, per capital net income of rural labor forces, distance to Yiwu City, and migration stock have been chosen for modeling [14, 15]. These lead to the following two migration models with and without migration stock in double-log form:
ln MR = α1 ln MLR + β1 ln PCNIR + λ1 ln DYW + θ1
(2)
ln MR = α2 ln MLR + β2 ln PCNIR + λ2 ln DYW + ε 2 ln MS + θ2 )
(3)
where lnMLR is man-land ratio, lnPCNIR refers to per capital net income of rural labor forces, lnDYW represents distance to Yiwu City in Euclidean space, lnMS refers to migration stock in previous year. lnMR refers to migration ratio from different areas to Yiwu City and is used as dependent variable in modeling. Standard linear regression and two popular spatial regression models including the spatial error model and the spatial lag model [14, 15] have been used. Spatial weight matrix is the foundation of all the spatial analysis and need to be specified. There are no practical guidelines for the selection of neighborhood structure except the theoretical analysis in [16]. Spatial weight matrix with high coefficient of spatial autocorrelation along with a high level statistical significance of specified variable has been used as in [13]. Data-driven approach to model assessment and comparison has been used in this study to determine which model is the better one accounting for the spatial autocorrelation. Models having a smaller Akaike’s Information Criterion (AIC) are considered to be better models. 4. Results and discussion 4.1. Origin distribution pattern at the province-level As a regional economic center, the “pull” forces of Yiwu City result in different effect on different people in different places. Jiangxi province ranks first in all of 34 province-level administrative divisions in average from 2005 to 2008. Followings are Anhui province, Henan province and Guizhou province which adjacent to Jiangxi province. Although Yiwu is located in Zhejiang province, the floating population to Yiwu city ranks fifth. Hunan province is located near to Yiwu city, but the floating
Hongsheng Li et al. / Procedia Environmental Sciences 7 (2011) 116–121
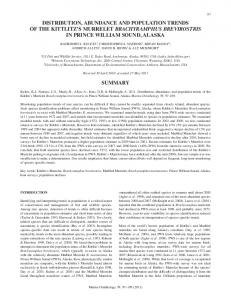
population there is smaller than that from Guizhou province. In Sichuan province, there are over eight million workers are employed outside the province and rank first each year. But when it goes to the floating population to Yiwu city, Sichuan province is only the seventh largest province. They are abstracted towards other economic center. Explorative spatial data analysis can be of great help to us in understanding the origin distribution pattern. Box map at a hinge level of 3.0 indicate the outliers are Jiangxi, Henan, Anhui, Guizhou, Zhejiang province. In addition, the hinge level of 1.5 indicated more outliers like Hunan, Sichuan province. The global Moran’s I statistic of floating population to Yiwu City from different provinces in 2007 is 0.2379 with a p value which is smaller than 0.01. This proved the existence of positive spatial autocorrelation. The spatial variation of origin distribution of floating population is illustrated clearly on the dot density map in Fig. 1. Anhui and Zhejiang province are the most densely-populated areas in China. The most significant character is the two axes on Fig.1. One axis extends from Henan to Yiwu city via Anhui and Zhejiang. The other axis wind its way from Sichuan to Yiwu city via Guizhou, Hunan, Jiangxi, and Zhejiang. These two axes connect the above detected seven outliers and contribute more than 80 percent of floating populations to Yiwu City. The sum of seven upper outliers in all the 34 provinces reaches up to 83 percent. The distribution follows the 80/20 principle or the Pareto Principle: about 80 percent floating population to Yiwu City come from the 20 percent of the provinces, while 20 percent (17.05%) floating population come from other 80 percent of the provinces. The overall spatial layout is U-shaped. Taking into account the specificity of the Sichuan province with the biggest population and the biggest floating population in China, the spatial layout of Yiwu’s pull will be a V-shaped pattern without Sichuan.
Figure 1 distribution pattern map of floating population to Yiwu City by province
4.2. Determinant analysis The results from multiple regression analysis of migration ratio in Jiangxi province are shown in Table 1. The Moran’s I test on the residuals after fitting the standard linear regression (OLS) suggests that there
119
120
Hongsheng Li et al. / Procedia Environmental Sciences 7 (2011) 116–121
is strong evidence of spatial autocorrelation among the residuals. Thus the independence assumption of the error term appears to be violated. In order to explain the spatial autocorrelation, the spatial linear regression models were applied. The 3-nearest neighbor weight matrix is selected because of high coefficient (Moran’s I = 0.67; p-value < 0.01) for spatial regression analysis. The migration ratio had correlation with the distance to Yiwu city in all the three estimates of model 2. The standard linear regression indicates the correlation between migration ratio and man land ratio and rural labor income is not significant, while the correlation between migration ratio and man land ratio is significant at the 0.5 level according to spatial version of model 2. The spatial error model (SEM) has higher goodness of fit than spatial lag model (SLM) in model 2 on the basis of the results come from AIC even though the Moran’s I value of residuals in SEM is larger than the one in SLM. The correlation between migration ratio and migration stock is notable with high significance level (pvalue < 0.0001) in three versions of model 3. The OLS results of model 3 also confirm the distance-decay effect while results from the spatial version of model 3 failed to support the distance rule in population floating. The SLM estimates have higher goodness of fit than SEM estimates in model 3 no matter from the AIC values or from the Moran’s I value of residuals. The correlation between rural labour income and migration ratio is not significant according to the three versions of the two models. These results indicate obvious difference with previous studies at the provincial scale [12-14]. This is due to the small disparities of per capital net income of rural labor forces within the counties in Jiangxi. The range of the income in log-form is as small as 1.13. Based on the likelihood statistics, the AIC and the Moran’s I statistics of residuals, the model 2 provide an improved fit over the model 3. Model 2 is used to explain the decision to migrate when the migration stock is low at the initial stage or there is little knowledge for floating population about their friends, relatives or hometown fellows in Yiwu City. Model 3 introduces migration stock variables and will explain much more than model 2. But one problem of model 3 is the migration ratio maybe closely related to the migration stock. The migration stock variables may appear to exert a strongly positive effect on floating and migration even if in fact there is no such relationship. Table 1 Regression results of models for floating population to Yiwu City from counties in Jiangxi province Independent variables
Model 2
Model 3
OLS
SLM
SEM
OLS
SLM
lnMLR07
-0.078
-0.136*
-0.148*
-0.096*
-0.134*
SEM -0.084*
lnPCNIR07
-0.072
0.025
0.058
0.026
0.084
0.019
lnDYW_E
-3.003*****
-1.772*****
-2.860*****
-0.485* *
0.147
-0.628
lnMS06
-
-
-
0.805*****
0.737*****
0.751*****
Constants
22.226*****
13.158 **
20.740*****
0.849
-3.575*
2.052*
Spatial lag effects
-
0.404*****
-
-
0.277*****
-
Spatial error effects
-
-
0.403*****
-
-
0.311***
Log Likelihood
-132.3
-124.167
-124.398
-76.475
-69.248
-72.651
AIC
272.6
258.334
256.797
162.95
150.497
155.302
Moran’s I for residuals
0.352***
0.040*
0.043*
0.226***
-0.002
0.039*
Notes: * Significant at p ≤ 0.5 ; ** Significant at p ≤ 0.1 ; *** Significant at p ≤ 0.01 ; ***** Significant at p ≤ 0.0001.
Hongsheng Li et al. / Procedia Environmental Sciences 7 (2011) 116–121
5. Conclusion The study have investigated the “pull” forces of Yiwu City which can be viewed as a V-shaped pattern consisting of the two axes connecting the main origin provinces floating into Yiwu City in series. Based on the likelihood statistics, the AIC and the Moran’s I statistics of residuals, the model with migration stock provides an improved fit over the model without migration stock according to the empirical regression results at the county scale in Jiangxi province. If the migration stock in origin areas is large enough, the distance-decay effect fail to explain the floating population size to the same destination areas. The correlation between labor income and migration ratio will be not significant if the disparities of income is very small in the study areas. The estimates results in spatial models further suggest a preference for the spatial lag model rather than the spatial error model. Acknowledgements The research is partially supported by the National Natural Science Foundation of China (No. 41001314) and the national science & technology pillar program (No. 2009BAH50B01-05). References [1] Ravenstein E G. The laws of migration. Journal of Statistical Society of London 1885; 48(2):167-235. [2] Bagne, D.J. Principles of Demography. New York: Johnson Wiley and Sons; 1969. [3] Lee E. A theory of migration. Demography, 1966; 3: 47-57. [4] Haynes K.E. and Fotheringham A.S. Gravity and Spatial Interaction Models. Beverly Hills, CA: Sage; 1984. [5] Fotheringham A.S. and O’Kelly M.E. Spatial Interaction Models: Formulations and Applications. Dordrecht: Kluwer;1989. [6] Manski C. The structure of random utility models. Theory and Decision 1977; 8: 229-254. [7] Liaw K.L. Joint effects of personal factors and ecological variables on the interprovincial migration pattern of young adults in Canada. Geographical Analysis 1990; 22: 189-208. [8] Liaw K.L. and Ledent L. Nested logit models and maximum quasi-likelihood method. Regional Science and Urban Economics 1987; 17: 67-88. [9] Champion, A., Fotheringham, S., Rees, P., Boyle, P. and Stillwell, J. The Determinants of Migration Flows in England: A Review of Existing Data and Evidence, Report prepared for the Department of the Environment, Transport and the Regions, Newcastle: Department of Geography, University of Newcastle; 1998. [10]Todaro, M.P.1969, A model of labour migration and urban unemployment in less developed countries. American Economic Review; 1969; 59(1):486-489. [11] Richard A., James C.K. Population Growth, Employment and Economic-Demographic Interactions in Kenya: BachueKenya. New York: St. Martin’s Press; 1983. [12]Anselin, L. Spatial econometrics: Methods and models. Boston: Kluwer Academic; 1988. [13] Guangqing Chi, Jun Zhu. Spatial Regression Models for Demographic Analysis. Population Research Policy Review 2008; 27:17-42. [14] Li Qiang. An Analysis of Push and Pull Factors in the Migration of Rural Workers in China. Social Sciences In China 2003; 1:125-136. [15] Jiaosheng He, Multivariate spatial interaction models as applied to China's inter-provincial migration 1982-1990. 1999; phd thesis. Saskatoon: University of Saskatchewan. [16] Arthur Getis, Spatial Autocorrelation, In: Manfred M. Fischer, Arthur Getis, editors. Handbook of Applied Spatial Analysis, Berlin Heidelberg: Springer-Verlag; 2010, p. 255-278.
121