Original article Image fusion analysis of 99mTc-HYNIC-Tyr3-octreotide SPECT and diagnostic CT using an immobilisation device with external markers in patients with endocrine tumours Michael Gabriel1, Florian Hausler1, Reto Bale2, Roy Moncayo1, Clemens Decristoforo1, Peter Kovacs2, Irene Virgolini1 1 2
Clinical Department of Nuclear Medicine, Innsbruck Medical University, Anichstrasse 35, 6020 Innsbruck, Austria Clinical Department of Diagnostic Radiology, Clinical Division of Diagnostic Radiology I, Innsbruck Medical University, Innsbruck, Austria
Received: 24 March 2005 / Accepted: 30 May 2005 / Published online: 26 August 2005 © Springer-Verlag 2005
Abstract. Purpose: The aim of this study was to assess the value of multimodality imaging using a novel repositioning device with external markers for fusion of single photon emission computed tomography (SPECT) and computed tomography (CT) images. The additional benefit derived from this methodological approach was analysed in comparison with SPECT and diagnostic CT alone in terms of detection rate, reliability and anatomical assignment of abnormal findings with SPECT. Methods: Fifty-three patients (30 males, 23 females) with known or suspected endocrine tumours were studied. Clinical indications for somatostatin receptor (SSTR) scintigraphy (SPECT/CT image fusion) included staging of newly diagnosed tumours (n=14) and detection of unknown primary tumour in the presence of clinical and/or biochemical suspicion of neuroendocrine malignancy (n=20). Follow-up studies after therapy were performed in 19 patients. A mean activity of 400 MBq of 99mTc-EDDA/HYNIC-Tyr3-octreotide was given intravenously. SPECT using a dual-detector scintillation camera and diagnostic multi-detector CT were sequentially performed. To ensure reproducible positioning, patients were fixed in an individualised vacuum mattress with modality-specific external markers for co-registration. SPECT and CT data were initially interpreted separately and the fused images were interpreted jointly in consensus by nuclear medicine and diagnostic radiology physicians. Results: SPECT was true-positive (TP) in 18 patients, truenegative (TN) in 16, false-negative (FN) in ten and falsepositive (FP) in nine; CT was TP in 18 patients, TN in 21, FP in ten and FN in four. With image fusion (SPECT and CT), the scan result was TP in 27 patients (50.9%), TN in 25 patients (47.2%) and FN in one patient, this FN result being caused by multiple small liver metastases; sensitivity was
.
Michael Gabriel (*) Clinical Department of Nuclear Medicine, Innsbruck Medical University, Anichstrasse 35, 6020 Innsbruck, Austria e-mail:
[email protected] Tel.: +43-512-50422665, Fax: +43-512-50422659
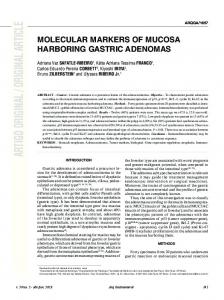
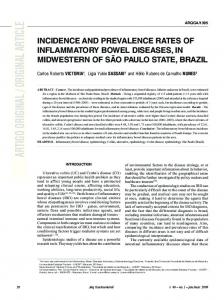
95% and specificity, 100%. The difference between SPECT and SPECT/CT was statistically as significant as the difference between CT and SPECT/CT image fusion (P95% [12, 13]. Each patient received a mean tracer activity of 400 MBq i.v. Based on the results of previous investigations [1, 2], whole-body imaging was performed at 2 and 4 h p.i. using a dualdetector scintillation camera (ADAC, VertexPlus; Philips Medical Systems, Milpitas, California), followed by SPECT. The scan speed for whole-body imaging was 10 cm/min. The camera was equipped with a low-energy all-purpose parallel-hole collimator. Acquisition parameters were as follows: window setting 140 keV, width 10%, 180° rotation detector head; 64 projections; 128×128 matrix. The SPECT image data were reconstructed by standard filtered backprojection using a Butterworth filter. Abdominal SPECT was performed in all patients. In addition, SPECT of the chest was obtained in 43 patients and SPECT of the head and neck in 17 patients, according to the clinical situation. For image fusion the SPECT and CT scans were sequentially performed. An image fusion procedure presupposes an exactly corresponding anatomical situation. Thus, great attention had to be paid to precise and reproducible positioning of the patient, which was achieved by fixation of the patient in an individualised vacuum mattress with external markers attached to it. For every image acquisition (SPECT and CT), the patient was repositioned in the vacuum mattress and modality-specific external reference markers (Medical Intelligence, Schwabmünchen, Germany) were attached to the mattress at identical positions, as shown in Fig. 1. Five markers per region (thorax, head/neck or abdomen) were used; for CT, the markers were spherical glass beads 5.8 mm in diameter, and for SPECT, 241Am markers. During the SPECT acquisition the patient had to breathe normally whereas for the CT scan the patient had to expire slightly and hold his or her breath. Helical CT scans of the thorax and the abdomen with a slice thickness of 2.5 mm were obtained with the General Electrics HiSpeed CT/i Advantage (GE
European Journal of Nuclear Medicine and Molecular Imaging Vol. 32, No. 12, December 2005
1442
Fig. 1. The patient is fixed in the individually moulded vacuum mattress for SPECT acquisition of the abdomen. The 241Am markers are attached at both sides of the mattress (arrows) and are used for superimposition with corresponding CT markers Medical Systems, Milwaukee, USA). Typically ∼150 ml (twice the weight of the patient in kg) Ultravist 370 contrast media (Schering, Germany) was administered at 5 ml/s, with scan delays of approximately 30 s for the late arterial phase and 70 s for the portal phase.
Image fusion procedure The CT and SPECT studies were transferred to the Treon workstation (Medtronic Inc., Louisville, Colorado, USA) via the hospital PACS. The Cranial 4 multimodality software allows the user to correlate up to ten different image sets of one patient and to display and review the correlated images. The registration procedure is a one-to-one mapping between the reference and the working image set, ensuring the same anatomical point in both images. The CT data set is set as a reference, and the following data sets of fused SPECT/CT images as working image sets. A minimum of four clearly defined corresponding fiducials or anatomical landmarks on both the reference and the working data set are always used as control for registration. The landmarks are selected by pointing and clicking the mouse cursor within the image at the highest possible magnification. When manually registering two data sets, registration accuracy is calculated by the software as the root square mean error (RSME) which is the mean distance of the respective frame reference points in the two data sets.
Interpretation of the images SPECT studies were interpreted using a computer workstation (HERMES, Nuclear Diagnostics, UK). All SPECT study findings were interpreted in consensus by two experienced nuclear medicine physicians. They were aware of the patient’s clinical history, which was provided by the referring physician, but were unaware of the results of any other imaging modalities. Tracer accumulation in structures that do not take up the tracer physiologically and foci of higher uptake than background activity were considered to be pathological. Each lesion was evaluated regarding certainty of characterisation (1=benign, 2=probably positive for malignancy, 3=definitely positive for malignancy, 0=no finding). Linear, non-
focal, limited intestinal uptake of moderate intensity was rated as benign. Clearly demarcated findings with higher tracer uptake as compared with the liver uptake were classified as definitely positive for malignancy. All remaining abnormal findings were classified as probably positive for malignancy on SPECT. Location was assessed for each identified abnormal finding classified as positive for malignancy after SPECT evaluation with regard to alignment to affected organs/body region. Since CT studies were interpreted by two experienced physicians trained in diagnostic radiology prior to the separate image fusion session, all abnormal CT findings were also taken into consideration when interpreting the fused images. Fused SPECT/CT studies were interpreted jointly and in consensus by nuclear medicine and diagnostic radiology physicians. Using interactive linked cursors, pixel to pixel correspondence was evaluated in such a way that CT provided excellent anatomical information allowing the exact localisation of SPECT findings. A lesion-by-lesion analysis was performed. Concordant findings on SPECT and CT meant that both SPECT and CT were consistent with malignancy. In the event of discrepancies in SPECT and CT findings, further assessment of abnormal foci was mandatory, i.e. by histological analysis or follow-up control studies with CT or MRI. Malignant evolution at follow-up or progression on therapy was considered indicative of malignancy in the final decision.
Statistical analysis For the accuracy analysis, abnormal SPECT findings (score 2 and 3) were considered positive for malignancy, whereas score 1 findings were considered negative for malignancy (benign), as were studies with negative findings. SPECT and fused SPECT/CT images were classified as true-positive (TP), true-negative (TN), false-positive (FP) or false-negative (FN) according to the gold standard (histopathology or other imaging procedures during follow-up after scan), as described above. Sensitivity and specificity were expressed along with an estimate of the 95% confidence interval. Differences in accuracy between SPECT and SPECT/CT for the per-lesion and perpatient analyses were tested with the McNemar test. P