One-third of a hypertensive population sur- graphy and chest x-ray are, however, ..... apex cardiogram and an abnormal atrial sound were and heart rates were ...
British Heart 7ournal, 1976, 38, 779-789.
Orthogonal electrocardiogram, apex cardiogram, and atrial sound in normotensive and hypertensive 50-year-old men John Wikstrand, Goran Berglund, Lars Wilhelmsen, and Ingemar Wallentin From the Department of Clinical Physiology I and the Section of Preventive Cardiology, Department of Medicine I, University of Goteborg, Sweden
The prevalence of signs of heart involvement was studied non-invasively in a group of untreated hypertensives (n =35) and a reference group (n== 73), all derived from a random population sample of 50-year-old men. Signs of left ventricular hypertrophy were studied by means of orthogonal electrocardiography and conventional electrocardiography. Signs of decreased distensibility of the left ventricle were studied by apex cardiography and registration of atrial sounds. Left ventricular hypertrophy among hypertensives was significantly more common according to orthogonal electrocardiography (33%) than according to conventional electrocardiography (9%), indicating that the former may be a better method for detection of left ventricular hypertrophy than the latter. In the hypertension group the amplitude of the R wave in lead X on orthogonal electrocardiography was positively correlated to casual diastolic blood pressure (r=0-40) and to diastolic blood pressure after one hour's rest (r= 0 65). The degree of pressure load leading to left ventricular hypertrophy seems to be better reflected by resting than by casual blood pressure. There was no hypertensive subject with both signs of left ventricular hypertrophy on orthogonal electrocardiography and either an a/H ratio over 15 per cent or an abnormal atrial sound, indicating two different forms of cardiac involvement as the result of hypertension. Casual blood pressures became normal during rest in hypertensives with a/H ratio over 15 per cent on apex cardiography or abnormal atrial sound, but not in hypertensives with signs of left ventricular hypertrophy on orthogonal electrocardiography. The natural history of hypertension is extremely varied. One-third of a hypertensive population survived to old age without signs of organic damage while in others the prognosis was poor (Fry, 1974). Hypertensives with signs of left ventricular hypertrophy on electrocardiography have a poorer prognosis than hypertensives with a normal electrocardiogram (Bechgaard, 1967; Sokolow and Perloff, 1961; Kannel et al., 1970). In mild to moderate hypertension, antihypertensive treatment had a beneficial effect in hypertensives with signs of cardiac abnormality on electrocardiography or x-ray, while no benefit could be shown in hypertensives without such abnormality (Veterans Administration Cooperative Study Group on Antihypertensive Agents, 1972). Thus, it seems important for prognostic and therapeutic purposes to diagnose cardiac abnorReceived 18 December 1975.
mality in hypertensives. Conventional electrocardiography and chest x-ray are, however, normal in many hypertensives, partly because of low sensitivity, and are less suitable for quantification of left ventricular hypertrophy (Sokolow and Lyon, 1949; Gamboa, Hugenholtz, and Nadas, 1965; The National Center for Health Statistics, 1966; Tibblin, 1967, Romhilt and Estes, 1968; Sannerstedt, Bjure, and Varnauskas, 1970; McCaughan, Littman, and Pipberger, 1973). Vectorcardiography and orthogonal electrocardiography have been shown to be superior to conventional electrocardiography in the diagnosis of left ventricular hypertrophy (Gamboa et al., 1965; McCaughan et al., 1973). Apex cardiography, especially the a wave in the apex cardiogram, and the analogous acoustical event, the atrial sound, provide non-invasive ways of assessing changes in
780 Wikstrand, Berglund, Wilhelmsen, and Wallentin ALL 50-YEAR OLD MEN
IN
-REFERENCE| 73
_
3372
|OHYPERTEN
-
same trial by drawing a 10 per cent subsample at random. The non-participation rate in the subansample was 18 per cent (20/110). Five subjects in >IISssL DIAST22IC the reference group fulfilled the criteria for hyperPANTS tension and joined the hypertension group. Twelve subjects in the reference group were excluded, 1
1/3
35
1/3
[10 per cent
175
SYSTOFLIC
-
NON-PATICI-NON-PATICEPANTS20 20 31? EXCLUDED EXCLUDED -1
-12
IST/orLC
>115 DIASTOLIC-5
(Fig. 1). For the hypertension group, 18 subjects classified as belonging to WHO stage 1, 13 to stage 2, and 4 to stage 3. A reference group (n = 73) was obtained from the
were
GOTEBORG
+5
Ponthe S
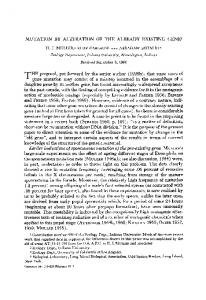
TWICE 1r FIG. 1 Schematic representation of the random selection of the hypertension group and the reference group from the population of men born in 1921 and living in Gbteborg, Sweden.
left ventricular distensibility (Bethell and Nixon, 1973; Gibson et al., 1974; Tavel, 1974). In the present investigation signs of left ventricular hypertrophy were studied by conventional and orthogonal electrocardiography (Frank), and signs of decreased left ventricular distensibility by apex cardiography and registration of atrial sounds phonocardiographically. The aim of the present study was to determine the thes prevaln ofOf heart ivolvement, prevalence non-invasive methods, in groups of untreated hypertensive and normotensive men, homogeneous with respect to age, and to relate the findings to casual blood pressure and resting blood pressure.
with mitral stenosis, 1 with aortic regurgitation,
5 who were on antihypertensive treatment, and 5 with casual blood pressure above 175 mmHg (23-3 kPa) systolic and/or 115 mmHg (15-3 kPa) diastolic at screening but not at the subsequent blood pressure control two weeks later. No subject in the hypertension group had a history of valvular heart disease. In addition to the above-mentioned groups, 3 untreated, male hypertensives (aged 45, 50, and 50 years) with casual blood pressures above 240 mmHg (31-9 kPa) systolic and 160 mmHg (21.3 kPa) diastolic, recruited from the same screening examination, were examined in order to obtain data from subjects with extremely high blood pressures. These 3 subjects all belonged to WHO stage 3. Orthogonal electrocardiograms and conventional electrocardiograms were recorded in all subjects (n= 111). Registration of apex cardiogram, atrial sounds, and resting blood pressure were performed in a randomly selected half of both the reference ou n= 19) and yp grou (n (= ) and the hpertension m the 3 hypertensives with extremely high blood pressure. Analysis of each variable was performed without of the results thesubec other knowledge examinatins or toewhich lgroup of the exarminations or to which group the subject belonged. Resting blood pressure values were, for technical reasons, lacking for 4 subjects selected for apex cardiography; all 4 belonged to the reference group. At analysis of signs of left ventricular hypertrophy on electrocardiography, 2 subjects in the hypertension group and 1 in the reference group with left or right bundle-branch block or left anterior hemiblock, were excluded, since changes in left ventricular activation have an influence on the amplitudes (Fernandez, Scabat, and Lenegre, 1970). In 4 subjects in the reference group (11 %) and 1 hypertensive subject (5%), an acceptable apex cardiogram could not be recorded.
assesedmby theartinolemnts assessedn=36
Subjects From a screening examination, which was part of a multifactorial, primary preventive trial (Wilhelmsen, Tibblin, and Werko, 1972) in a randomly selected third (n= 1122) of the 50-year-old male population in Goteborg, Sweden, all subjects with untreated, essential hypertension were allocated to a hypertension group (n=35) (see Fig. 1). The diagnosis of essential hypertension was based on a casual blood pressure above 175 mmHg (23-3 kPa) systolic and/or 115 mmHg (15-3 kPa) diastolic on two separate occasions two weeks apart (the casual blood pressure values given in the tables refer to the first measurement), and a negative standard diagnostic examination for secondary hypertension (Wilhelmsen, Berglund, and Werko, 1973). Thus, one subject with chronic glomerulonephritis was excluded
Methods Conventional electrocardiograms, apex cardiograms, phonocardiograms, and resting blood pressures were all registered on a direct writing ink-jet 7-channel
Heart involvement in hypertension 781
mingograph (EM 81, Siemens-Elema, Sweden) with and linear frequency response from 0 to 500 Hz 30 per cent amplitude reduction at 650 Hz. The mingograph was supplied with a phonopreamplifier (EMT 22) with electrical filters that together with a piezoelectric microphone (EMT 25 C) give five frequency ranges with the following nominal frequencies: 25, 50, 100, 200, 400 Hz and one aural frequency range. A crystal transducer (EMT 510 C) with low frequency time constant between 1 9 and 4x6 s (depending on a capacitance-resistance product, decided by the individual amplification used for each curve) connected by a 35 to 40 cm long rubber tube to a specially designed capillary damped funnel pick-up, 2-5 cm in diameter, giving a frequency response of 0-08 (at time constant 1 9 s) to 65 Hz (-3db), was used. Paper speed was 50 mm/s for electrocardiogram and for the other tracings 100 mm/s. Blood pressure was measured with a 12 cm broad and 26 cm long rubber cuff. Cuff inflation was rapid, cuff deflation approximately 3 beats per 10 mmHg (1-3 kPa). Diastolic pressure was registered as phase 5, i.e. when the sounds disappeared. Casual blood pressure was measured in the seated position with a mercury manometer and stethoscope at the screening examination. Resting blood pressure was measured after one hour's rest in the supine position in a sound-protected room with an automatic device for cuff inflation and deflation (BouckeBrecht), with a microphone (EMT 25 C) placed over the right brachial artery and with simultaneous registration of cuff pressure, Korotkoff sounds, and electrocardiogram. The largest circumference of the relaxed right overarm was measured in those subjects in whom resting blood pressure was measured. Casual heart rate was measured as the mean of five consecutive beats from an electrocardiogram taken at the screening examination. Resting heart rate was measured from the resting blood pressure recordings. The resting blood pressure was measured twice with an interval of one minute. The following correlations between these resting blood pressures were found: reference group systolic r=0*95, diastolic r=0 94; hypertension group systolic r=0*94, diastolic r=0-96. No significant correlation for the relation between the circumference of the right upper arm and resting blood pressure was found (reference group r=0 11 systolic, r=0 17 diastolic; hypertension group r=0'09 systolic, r=0-31 diastolic). There was no significant difference in the mean of the right upper arm circumference between the hypertension group (:R 31'8, sx 2.5, range 27-0 to 35-5 cm) and the reference group (x 30 8, sx 2'1, range 26'0 to 35-5 cm).
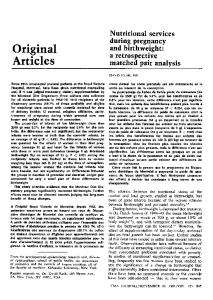
The three scalar electrocardiographic leads X, Y, and Z were simultaneously recorded on magnetic tape (Hellige) using the Frank's corrected orthogonal lead system (Frank, 1956). Computer analysis was performed according to Arvedson (1968, 1973) with a sampling frequency of 200 per second. The following criteria for left ventricular hypertrophy were used: the amplitude of the R wave in lead X (R.) above 1 8 mV, the R wave in lead X and the S wave in lead Y (Rx+Sy) above 1'9 mV or the R wave in lead Z (Rz) above 1-3mV. Since most electrocardiographic measurements are not normally distributed the amplitude limits were drawn at the upper 97-5th centile in the reference group in analogy with a previous study (McCaughan et al., 1973). The upper 97-5th centile in the reference group was also studied for R.+Rz (2'8 mV), the spatial maximal amplitude (2-2 mV), ventricular activation time (0.06 s for both R. and the spatial maximal amplitude), the duration of the P wave (0-13 s) and the following amplitudes of the P wave in the orthogonal electrocardiogram: sum of positive P amplitudes in lead X and lead Z (0- 17 mV), positive P amplitude in lead Z (0.07 mV) (Ishikawa, Kini, and Pipberger, 1973). Convenfional electrocardiograms were recorded as standard 12 lead electrocardiograms using the right arm as the indifferent electrode for the praecordial leads. Electrocardiograms were coded in accordance with the Minnesota code (Blackburn et al., 1960). Amplitude measurements in praecordial leads were done in accordance with the revision for CR leads (Astrand et al., 1967). As signs of left ventricular hypertrophy, a combination of amplitude criteria, 3:1 or 3:3, and ST or T criteria, 4:1-3 or 5:1-3, were used (Sokolow and Lyon, 1949). Apex cardiograms and phonocardiograms were recorded during the resting period preceding the measurement of resting blood pressure. The apex cardiogram was recorded simultaneously with electrocardiogram lead II and a phonocardiogram from the third left intercostal space parasternally with the subject in the left lateral position during relaxed expiratory apnoea. The pick-up was held by hand at the point of maximal impulse of the apex beat. The a wave percentage amplitude of the total deflection of the apex cardiogram (H), was calculated as the mean of five consecutive beat(Fig. 2). An a/H ratio above 15 per cent was cons sidered abnormal (Tavel et al., 1965; Epstein et al., 1968; Voigt and Friesinger, 1970). Registration of the apex cardiogram by two different examiners with one hour's interval, the second examiner not being allowed to see the recording made by the first examiner, gave a correlation coefficient of 0-88 (n=81) between the two calculated a/H
782 Wikstrand, Berglund, Wilhelmsen, and Wallentin
=~~~~~
0lFL 7--i 0 E4Lt:X4;0 z0f
I 44-
ziiil
Ii
H
0'--01'
11 ! i1t +'Ktt-
lb
' -fjlt 15 per cent = 7/18
Hypertension Reference group No.
Orthogonal electrocardiogram Rx >18 or Rz>1 3 or Rx+Sy>1l9mV 11/33 Conventional electrocardiogram 3:1 or 3:3 plus 4:1-3 or 5:1-3 3/33 6/33 3:1 or 3:3 alone
group
% No.
139
% 5
33 2/72
3
9 2/72 18 5/72
3 7
NUMBER
15 20 10 a/H-ratio PER CENT
25
30
35
Reference group
n:32
10~ X9.9 ~~~~~~~~~~ 10~~~~~~~~~~~~~~
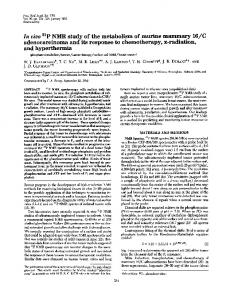
Orthogonal electrocardiogram and standard 12-lead electrocardiogram The proportion of hypertensives with signs of left ventricular hypertrophy on orthogonal electrocardiogram (11/33, 33%) was significantly higher (P < 0O001) than that in the reference group (2/72, 3%), see Table 2. The proportion of hypertensives with signs of left ventricular hypertrophy with conventional electrocardiogram was 9 per cent (3/33), compared with 3 per cent (2/72) in the reference group. Minnesota code 3:1 or 3:3 alone was seen in 18 per cent (6/33) of the hypertensives and in 7 per cent (5/72) of the reference group. The proportion of hypertensives with signs of left ventricular hypertrophy by orthogonal electrocardiogram was significantly higher (McNemar, P < 0025) than by conventional electrocardiogram. In the reference group there was no overlapping between the two methods, i.e. two subjects showed signs of left ventricular hypertrophy by orthogonal electrocardiogram, and another two by conventional electrocardiogram. Of the hypertensives, one fulfilled the criteria for left ventricular hypertrophy with conventional electrocardiogram only, two with both methods, and nine with orthogonal electrocardiogram only. Of these nine subjects, none had a Minnesota code 4:1-3 or 5:1-3, i.e. ST or T changes on conventional electrocardiogram, and thus the only sign of left ventricular hypertrophy in these nine hypertensives was high QRS amplitude on orthogonal electrocardiogram. Other measurements, such as Rx + R ., the spatial maximal amplitude, ventricular activation time, or the duration or amplitude of the P wave did not improve the discrimination between the hypertension and reference group. The proportion of hypertensives with a/H ratio above 15 per cent (7/18, 39%) was significantly
> 15 per cent
s: i 0
XT,J1rHr25 20 10 15 5 a/H1-ratio
2/32 30
35
PER CENT
FIG. 3 Distribution of the a/H ratio from the apex cardiogram and the proportion of subjects with /H ratio above 15 per cent, the mean (x) and the standard error of the mean (sR) in the hypertension and reference group. For practical reasons, one subject in the reference group with a/H ratio= 0 per cent was placed in the interval 1 to 3 per cent in the figure.
higher (P < O-O5) than found in the reference group (2/32, 6%), see Fig 3.3. The mean a/H ratio in the range 6 to sh=1a3, g hypertenseegroup = range 6 to hypertension (xn13h9, sg1P3,
28) was significantly higher (P 1-3 or Rx+Sy>19mV) and signs of lowered left ventricular distensibility (a/H ratio >15% or atrial sound of intensity 4 or 5) Type of left ventricular involvement Lowered distensibility* Hypertrophy No. = 8/19 No.=5/19 Range R R Range SR sk
Casual Resting
Systolic Diastolic Heart rate Systolic Diastolic Heart rate
(mmHg) (beats/min) mmHg
(beats/min)
206 125 79 171 107 59
(216-198) (132-118) (114-61) (192-146) (120-98) (74-50)
3 2 9 7 4 4
193 116 87 137 86 60
(220-164) (122-104) (108-61) (172-111) (107-64) (73-43)
7 2 6 8 5 3
*One subject with left bundle-branch block was excluded since left ventricular hyp-rtrophy on orthogonal electrocardiography could not be analysed. Conversion from Traditional to SI Units: 1 mmHg 0-133 kPa.
786 Wikstrand, Berglund, Wilhelmsen, and Wallentin Rx
mV
Rx
Reference group
n=31
Hypertension group
mV
2.0
n=17
2.0
10 1.5
1.5 00
0 0~~~~~~~~~~~~~
0.5
r 0.01 n.s.
50
100
RESTING DIASTOLIC BLOOD PRESSURE mm
Hg
0.5 --r =0.65 y= 0.0153x+0.05 50
100
RESTING DIASTOLIC BLOOD PRESSURE mm Hg
FIG. 5 Relation between resting diastolic blood pressure and the amplitude of the R wave in lead X on orthogonal electrocardiogram. (Conversion from Traditional to SI Units: lmmHg 0133 kPa.)
Two had abnormal atrial sounds as well. These three hypertensives with extremely high blood pressures thus showed signs of both left ventricular hypertrophy and decreased left ventricular distensibility.
Relations between signs of left ventricular hypertrophy on orthogonal electrocardiogram, a/H ratio, and blood pressure Linear correlation analysis for the relation between Rx on orthogonal electrocardiogram and resting diastolic blood pressure in the hypertension group (see Fig. 5) gave r=065 (n=17, P