Dec 30, 2016 - Keywords OSeMOSYS, Energy Modelling, Greenhouse. Gases Emissions ..... https://www.neb-one.gc.ca/nrg/tl/cnvrsntbl/cnvrsntbl- eng.html.
Universal Journal of Educational Research 5(1): 162-169, 2017 DOI: 10.13189/ujer.2017.050120
http://www.hrpub.org
OSeMOSYS Energy Modeling Using an Extended UTOPIA Model Denis Lavigne Royal Military College St-Jean, St-Jean-sur-Richelieu, Quebec, Canada
c Copyright 2017 by authors, all rights reserved. Authors agree that this article remains permanently open access under the terms of the Creative Commons Attribution License 4.0 International License
Abstract The OSeMOSYS project offers open-access energy modeling to a wide audience. Its relative simplicity makes it appealing for academic research and governmental organizations to study the impacts of policy decisions on an energy system in the context of possibly severe greenhouse gases emissions limitations. OSeMOSYS is a tool that enhances the potential for the training of highly qualified professionals. Basic training is possible via the UTOPIA model. This paper proposes an extended version of this model to help non-expert individuals fully grasp its powerful yet easy-to-use capabilities. The step-by-step presentation shall be of great use for professors to embed this material in class and for energy professionals new to the field of energy modeling to learn how to use a techno-economic approach.
Keywords OSeMOSYS, Energy Modelling, Greenhouse Gases Emissions, Mathematical Modeling, Climate Change
1
Introduction
Energy models have been around for decades. Some models use a bottom-up techno-economic approach. This means that the energy system of a particular region (or group of regions) is represented by a list of end-use demands which must be met using a typically extensive list of technologies. These technologies and related energy fuels are highly detailed using technical and economic data. The original MARKAL (MARKet ALlocation) linear programming model is one type of such tools. Its first implementation was written in OMNI [1, 2] and the resulting linear program representing the problem of satisfying all end-use demands at minimal cost was solved using a commercial solver. This work was a result of the oil crisis of the ’70s. The ETSAP (Energy Technology Systems Analysis Programme) of the IEA (International Energy Agency) has been established in 1976 in order to “establish, maintain, and expand a consistent multi-country energy/economy/environment/engineering (4E) analytical capability” (see [3]).
Eventually, MARKAL has been rewritten using GAMS [4] and has become an important tool to analyse the impacts of policy decisions on technologies and fuels choices in the context of severe greenhouse gases emissions limitations. Its successor, the TIMES model (The Integrated MARKAL EFOM System), has been used extensively in many parts of the world to perform such studies. Its link with state-of-theart decision support systems (VEDA or ANSWER) makes it a very powerful complex tool (see [5] for the impressive TIMES documentation). Another model using a similar approach is the OSeMOSYS (Open-Source energy MOdelling SYStem) optimization model [6]. As mentioned on OSeMOSYS’ homepage, it “potentially requires a less significant learning curve and time commitment to build and operate. Additionally, by not using proprietary software or commercial programming languages and solvers, OSeMOSYS requires no upfront financial investment. These two advantages extend the availability of energy modeling to the communities of students, business analysts, government specialists, and developing country energy researchers”. This paper proposes an overview of OSeMOSYS and the existing UTOPIA model as a basic example on how to use OSeMOSYS. Minor discrepancies in UTOPIA’s data file will be mentioned. An extended UTOPIA version will be presented. It will include a step-by-step description on how to create a particular end-use demand and competing technologies to satisfy such a demand. Pareto-optimality will be proposed to show how such a model can be used by decision makers to develop coherent policies on meeting greenhouse gases targets. The goal of the paper is to help potential users to grasp the powerful yet simplicity of the approach. It hopes to fill in a gap between experts and non-experts to facilitate discussion and gain insight on the climate change energy related issues. In particular, university professors may decide to include OSeMOSYS in graduate class on the subject and help develop highly trained professionals. This has been done with great success at Polytechnique Montreal in its course entitled ENE8230: Techno-Economic Energy Modeling. The
Universal Journal of Educational Research 5(1): 162-169, 2017
paper shall result in professionals being ready to use more complex models such as TIMES or develop real-life energy models using OSeMOSYS.
2
Overview of OSeMOSYS
2.1 Generalities
2.2 Technical Issues 2.2.1
Divisions of the Year
A production capacity of 1 GW can generate 31.536 PJ (a year at full capacity). This corresponds to a parameter called CapacityToActivityUnit; it links capacity units (GW) with production units (PJ). If the yearly electricity used in a system (say 31.536 PJ) is broken down into two equal parts of six months (15.768 PJ), then a 1 GW capacity is sufficient to produce this quantity of electricity. But if the year is divided into two equal parts for which the needed electricity is not distributed similarly, the production capacity will have to be adjusted accordingly. For example, a (1/4, 3/4) need for electricity in a (1/2, 1/2) division of the year will induce a necessary production capacity of 1,5 GW (which is the Max(1/4 ÷ 1/2, 3/4 ÷ 1/2) = Max(1/2, 3/2)). 2.2.2
Demands
Demands are given AccumulatedAnnualDemand
SpecifiedAnnualDemand parameters. The former one is used when a user lets the solver choose as it pleases the way to satisfy the demand through the year (without any specified a priori time of the year demand profile). The latter one is for demands that must be met in line with a precise SpecifiedDemandProfile throughout the year. 2.2.3
OSeMOSYS is a linear programming optimization energy model. It is argued that OSeMOSYS avoids the costs and complexity of TIMES while describing the energy system of a particular region with sufficient details to be used for real-world applications. Its full description is available in [7] and has been presented officially for the first time at the 2010 International Energy Workshop in Stockholm. It has been created using GLPK (GNU Linear Programming Toolkit [8]) which includes the mathematical programming language GNU Mathprog and the glpsol solver to find the optimal solution of linear programming problems. The GLPK version of the model is available at [9] (file OSEMOSYS 2016 08 01.TXT or the equivalent more compact version OSEMOSYS 2016 08 201 SHORT.TXT). Note that OSeMOSYS is the generic mathematical representation of all the parameters, decision variables and constraints imposed on any energy system whose objective is to minimize the total discounted cost of satisfying all such constraints. It contains no specific data of a particular region, all of which are included in a separate datafile. OSeMOSYS is thus accepted in the scientific community as a standardized model which can be modified if needed (it is open-access) but does not have to be modified in order to work properly. OSeMOSYS regional models usually only differ because of user-defined data files. The UTOPIA data file illustrative example described in [9] is available at [9] (file UTOPIA 2016 08 01.TXT).
by
either or
the the
163
Inputs and Outputs
The InputActivityRatio and OutputActivityRatio parameters specify the level of fuel input that is needed to produce some level of output (which is typically equal to one). 2.2.4
Costs
OSeMOSYS is a techno-economic energy model. It includes the following economic parameters: FixedCost, CapitalCost and VariableCost. The objective is to minimize the total discounted cost of the sum of all these costs for all technologies and fuels (with a typical DiscountRate equal to 5%). 2.2.5
Capacities
Solving the optimization problem will induce investments decisions in competitive technologies under some scenario. But some capacity currently exists and will continue to be available until its end-of-life. This fact is represented using the ResidualCapacity parameter. Life duration of new investment capacity is given via the OperationalLife parameter. 2.2.6
Other parameters
Many other parameters exist to appropriately describe a technolology. For example, AvailabilityFactor and CapacityFactor are used to represent the fact that some technology might not be available or used to full capacity throughout the year. ReserveMargin may be used for risk management. Emissions related to the consumption of fuels are accounted via the EmissionActivityRatio parameter.
3
Overview of UTOPIA
UTOPIA is an illustrative example of an energy model. All the data related to this specific occurrence of the OSeMOSYS generic model must be included in a data file distinct from the model file. Some data used in UTOPIA are now presented.
3.1
Divisions of the Year
Divisions of the year are specified via the TimeSlice set which is made of six divisions of the year: summer day (SD), summer night (SN), winter day (WD), winter night (WN), intermediate day (ID) and intermediate night (IN); intermediate refers to parts of the Spring and Fall seasons and are often
164
OSeMOSYS Energy Modeling Using an Extended UTOPIA Model
• InputActivityRatio
supposed to have similar time-of-the-year demands. This being said, this description of the year may not be coherent with the real durations of the seasons. The YearSplit parameter specifies the fraction of the year represented by a particular TimeSlice. First, a 24-hour period can be broken down in two parts of unequal lenghts. For example, the “day” part can represent 16 hours (from 06:00 to 22:00) and the “night” part only 8 hours (from 22:00 to 06:00). Second, one can define a 6-month “winter”, 3month summer and 3-month “intermediate” seasons. This separation of the year leads to a YearSplit of 1/3 for WD, 1/6 for WN, 1/6 for SD and ID and finally 1/12 for SN and IN. Such vales, like all other data, are under complete control of the user.
Note that the EMISSION set is made of only two pollutants, namely CO2 and NOx .
3.2
3.4
Demands, Technologies and Fuels
The UTOPIA region contains 3 end-use demands: residential lighting (RL), residential heating (RH) and passengers transportation (TX). Each individual demand can be met by a set of competing technologies using similar or different fuels as inputs. For example, gasoline cars (TXG), diesel cars (TXD) and electric cars (TXE) competes to satisfy the passengers transportation demand (TX). The optimal solution will select one, two or even all three technologies; the model is dynamic in the sense that a decision taken in a particular year influences decisions to be taken for subsequent years. A long-term policy on future severe limitations of greenhouse gases emissions will also influence the mix of optimal technologies to be automatically selected by the solver. Note that the time horizon of the UTOPIA model spans 21 years (from 1990 to 2010; see the YEAR parameter). Note that all demand technologies (those who meet specific end-use demand such as RL, RH and TX) use some sort of fuel as an input that makes the technology perform its duty (for example gasoline (GSL) is used by TXG). These fuels are in turn produced by competing production technologies. For example, GSL can be produced by a refinery (SRE) that uses crude oil as an input (IMPOIL1). GSL could also be simply imported from an external source (IMPGSL1). All the demands, demand technologies, production technologies and fuels importations are well-defined in UTOPIA. The model is “demand-driven”, meaning that the whole energy system is pulled by demands that must be met. Since the complete “food chain” from primary energy to end-use demands is represented, OSeMOSYS (and TIMES) is a fully integrated energy model.
3.3
Minor Discrepancies
All parameters of the UTOPIA model are presented in [9] (see Table 1, page 5858). Some discrepancies have been identified between these data and the ones contained in the UTOPIA 2015 08 27.TXT data file, some of which are presented below. • YearSplit in the text sums up to 0.75 (the data file is valid and sums up to 1);
– TXD shall be 4.33 instead of 1 – TXE shall be 1.21 instead of 1 – TXG shall be 4.33 instead of 1 – E21 shall be 2.50 instead of 1 • RL1’s CapitalCost shall be 100 instead of 0 • TXG’s ResidualCapacity shall be 4.6 and then decline to 0 instead of 0
The “??u” Technologies
Each end-use demand has a corresponding “??u” technology associated with it (RLu, RHu and TXu). These are dummy technologies with extreme high-cost investment values. If the optimal solution proposes to use one or more of these technologies, this means that its corresponding demand can not be satisfied with “real” technologies and the problem is then said to be infeasible. Infeasibility can be caused by an impossibility to meet a set of well-defined constraints. An example of a well-defined set of constraints can be a set of demands that can not be satisfied under too severe emissions limitations scenario. In such a case, infeasibility gives you an insight on how severe your environmental policy can afford to be for your energy system to keep on being coherent (although heavily impacted). Infeasibility can also highlight a simple minor error in the data file (we suppose the OSeMOSYS file to be valid and thus not be the cause of the problem). Such modeling errors may be difficult and time-consuming to deal with and an experience user may be of great help to discover and solve the issue.
3.5
Solving the UTOPIA Model
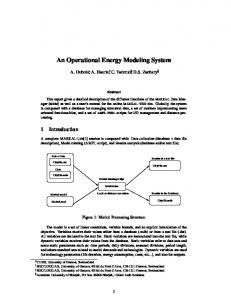
Solving the UTOPIA model to optimality gives a resulting minimal total discounted cost of about 32,113 millions of dollars. Emissions of CO2 (excluding NOx ) amounts to 206.2 tonnes. The optimal activities for the set of technologies that satisfy the passengers transportation demand is presented in Figure 1. According to the optimal solution under a reference scenario involving no limitations on CO2 emissions, results show that diesel cars shall gradually replace the gasoline cars to meet the passengers transportation demand.
4
Extended UTOPIA Model
To enhance the knowledge of how a data file such as UTOPIA is created, we will extend it by introducing a new end-use demand and two competing technologies to satisfy this demand. The TX passengers transportation demand is
Universal Journal of Educational Research 5(1): 162-169, 2017
Figure 1. Optimal Technologies for Passengers Tranportation
already part of UTOPIA. We will create a completely distinct new passengers transportation demand (as if TX would not exist). This new demand, called TZ, will simply be added to the current UTOPIA data file. The following step-by-step process will help the reader to eventually build his/her own particular model.
4.1
The TZ1 ResidualCapacity in the first year is equal to 0.12 Mcars. The end-of-life of these gasoline cars is represented by a linearly declining residual capacity. TZ1’s CapacityToActivityUnit parameter linking a unit of capacity with a unit of activity is computed as follows: 20 Gkm/Mcars × 1.25 passengers = 25 Gpkm/Mcars. The effiency of gasoline cars (TZ1) is supposed equal to 10 km per litre of the gasoline fuel (GSL). According to [10], a litre of motor gasoline is equivalent to 34.66 MJ so 12.5 pkm is equivalent to 34.66 MJ which means that TZ1’s efficiency is equal to 1 Gpkm per 2.7728 PJ. Thus for 1 unit of OutputActivityRatio we have an InputActivityRatio of 2.7728. The CapitalCost of a car is set to $20,000. With the units being as mentioned above, this parameter is 20,000 million dollars for 1 million cars so the value 20,000 is used as TZ1’s CapitalCost. The FixedCost of a car is set to $250 per car. This amount is spent independently of the number of kilometres driven using this car. Using the proper units, TZ1’s FixedCost value is set to 250. The VariableCost value is dependent of the activity of the car (which is measured in Gpkm). If a value of $1,000/year per car, the variable cost is computed as follows: $0.04 $40M $1, 000 = = 25, 000 pkm pkm Gpkm
New Demand and Technology
The new TZ demand is for passengers transportation by cars. Units used for passengers transportation in an energy model such as OSeMOSYS (or TIMES) are PassengersKilometers (pkm). We suppose that the number of cars in the first year of the reference scenario, namely 1990, is known to be 120,000 which are all gasoline cars called TZ1 cars. We also suppose that the average yearly distance travelled by such gasoline cars in the UTOPIA region is 20,000 km with an average of 1.25 passengers per car. A capacity of one gasoline car thus corresponds to a total of an annual activity of 20,000 km/car × 1.25 passengers = 25,000 pkm/car. The total annual demand for all the passengers transportation by cars amounts to 120,000 cars × 25,000 pkm/car = 3,000,000,000 pkm = 3 ×10⁹ pkm = 3 Gpkm. Due to the size of the data, we propose to use the following units: • capacity is in millions of cars (Mcars); • activity is in Giga passengers-kilometers (Gpkm); • demand is in Giga passengers-kilometers (Gpkm; demand and activity always share the same units); • monetary units are in millions of dollars ($M); • energy units are in PJ. Using these units, the demand in the first year is 3 Gpkm. We suppose that it will grow at an annual rate of 1% (because of an increase in the number of cars). We will specify this annual demand via the AccumulatedAnnualDemand parameter, thus letting the optimal solution decide how it chooses to meet this demand throughout the year.
165
TZ1’s last parameter is its life duration. If set to 12 years, the extended UTOPIA date file will have OperationalLife equal to 12. Table 1 is a summary of all TZ1’s technoeconomic parameters for the first year of the horizon (which is 1990 in UTOPIA). Note that TZ’s demand parameter AccumulatedAnnualDemand is not in the table. Table 1. TZ1’s Techno-Economic Parameters
Name ResidualCapacity CapacityToActivityUnit InputActivityRatio OutputActivityRatio CapitalCost FixedCost VariableCost OperationalLife
4.2
Units Mcars Gpkm/Mcars PJ Gpkm $M/Mcars $M/Mcars $M/Gpkm Years
New Competing Technology: Cars
Value 0.120 25 2.7728 1 20,000 250 40 12
Electric
Without any competition, TZ’s demand must be met using TZ1 gasoline cars. We introduce a competing demand technology: electric cars (TZ2). Suppose that they have the following characteristics: • they are not available before year 2000; • they travel 10,000 km per year;
166
OSeMOSYS Energy Modeling Using an Extended UTOPIA Model
• there is an average of 1.5 persons per car (suppose people buying such cars are also more inclined to share transportation with others); • energy efficiency is 10 km per 20 MJ of electricity; • capital cost is $25,000 per car; • annual fixed cost is $400 per car; • variable cost is $1,000 per 15,000 pkm; • residual capacity is obviously zero; • life duration is 12 years. Using these values, we find the corresponding values presented in Table 2. Parameter TotalAnnualMaxCapacity must also be set equal to zero from 1990 to 1999. Table 2. TZ2’s Techno-Economic Parameters
Name ResidualCapacity CapacityToActivityUnit InputActivityRatio OutputActivityRatio CapitalCost FixedCost VariableCost OperationalLife
4.3
Units Mcars Gpkm/Mcars PJ Gpkm $M/Mcars $M/Mcars $M/Gpkm Years
Value 0 15 1.3333 1 25,000 400 66.667 12
Solving the Extended UTOPIA Model
Since a new demand has to be satisfied, the optimal objective value grew from $32,113M for the original UTOPIA model to $38,397M for the Extended UTOPIA model, increasing the total CO2 emissions from 206.2 tonnes to 220.7 tonnes. Demand TZ is uniquely met with TZ1. This is due to the fact that the combination TZ2/ELC (where ELC represents electricity) is not economically competitive with the TZ1/GSL duo. Analyses using techno-economic energy models frequently involves the study of the impact of some greenhouse gas emissions limitation on technological choices that must be made to meet the policy’s target at minimal cost. Suppose that it is decided that the total CO2 emissions over the horizon (i.e. the sum of all emissions over the 1990-2010 21year horizon) must be smaller or equal to 200 tonnes. This can be specified by the ModelPeriodEmissionLimit parameter. In order to respect this target, less polluting more costly choices will have to be made and optimality shows an objective value of $38,527M.
4.4
Pareto Optimality
Pareto optimality is a way to analyse a problem involving two conflictive objectives. In energy modeling, minimizing the total cost to satisfy all end-use demands conflicts with
minimizing CO2 emissions. Solving the model for various CO2 emissions limitations allows one to gain insight on a region’s capability to meet such targets. Optimal technological and fuels choices have to be made according to the severity of the CO2 emission constraint and induce a particular marginal cost which is related to a particular emissions limit. A Pareto curve typically have two end-points: one who only takes into account one of the two objectives without worrying about the other conflicting objective, which is followed by the other one doing the same thing the other way around. In the current situation, we know from the previous section that the minimal cost of $38,397M has a related 220.7 tonnes of CO2 emissions. This is the first end-point of the Pareto curve. To find the other end-point, one must not minimize the total cost but rather minimize CO2 emissions. It is done by modifying the OSEMOSYS 2015 08 27.txt model file. The original objective function must be modified to be recognized as a simple comment (using the # symbol) as shown below: #minimize cost: sum{r in REGION, y in YEAR} TotalDiscountedCost[r,y]; it must then be temporarily replaced by the following objective function: minimize CO2Emissions: sum{r in REGION} ModelPeriodEmissions[r,"CO2"]; Prior to launch the optimization process, the ”??u” fictive technologies have to be temporarily seen as comments in the data file. If not, even at extreme costs, these fictive technologies would be selected and the results would be incoherent. Once these modificatins are in place, the optimal objective value is 64.25 tonnes of CO2 emissions with a corresponding total cost of $60,191M, which is a huge increase in cost (as is typically the case) compared to the other Pareto end-point. Once both end-points are identified, the original total cost objective function is put back in place and the model is solved for various values of CO2 emissions limitations. In this Extended UTOPIA example, we vary this limit from 220.7 tonnes to 64.25 tonnes using steps of 25 tonnes between 200 tonnes and 75 tonnes, resulting in the finding of 6 points. Adding these 6 points to both end-points gives us the 8-point Pareto curve shown in Figure 2. Pareto optimality visually presents the marginal cost of CO2 emissions limitations. In Figure 2, we notice that this marginal value remains low for quite an aggressive reduction on CO2 emissions. More reductions induce much higher marginal values with the steepest slope obviously occurring in the last line segment of the curve (from right to left). All the points under the Pareto curve are infeasible. It means that they can not be achieved. For example, for a fixed target of 150 tonnes of CO2 emissions, the lowest possible total cost is $40,144M. All points above the curve are feasible but non-optimal situations where, for example, one would pay more than $40,144M to reach a 150 tonnes level of emis-
Universal Journal of Educational Research 5(1): 162-169, 2017
Figure 4. Optimal Mix: 64.25 tonnes of CO2
Figure 2. Pareto Optimality
sions. Decision-makers must decide where they want to be on the Pareto curve. The identification of such a desired point on the curve is a problem faced by negotiating governmental organizations from diverse regions of the world. Energy modeling tools such as OSeMOSYS can help leaders make coherent and well-thought techno-economic decisions. Moreover, sharing a common energy modeling framework can enhance the transparent process involved in such intense moments as the preparations of the Conference Of Parties (COP) annual meetings. As an example of the impacts of the chosen point on the Pareto curve, Figures 3 and 4 show the optimal mixes of technologies to meet the TZ demand (TZ1: gasoline cars; TZ2: electric cars). It is of no surprise that more intense emissions reductions induce an increase in TZ2 activity (note that electric cars are not supposed to be available before 2000).
167
4.5
Extension for Freight Transport
Similar work can be accomplished for freight transport by trucks using the million tonnes-kilometers units (Mtkm). The new demand for freight transport is called TF. Suppose the only technology currently used to meet this demand is TFD which represents the diesel trucks. Here is the technoeconomic description of TF and TFD: • the number of diesel trucks in the first year of the time horizon (1990) is 1,000; • each truck travels an average of 50,000 km per year; • there is an average load of 20 tonnes per truck; • energy efficiency is 100 km per 20 litres of diesel (note from [10]: 1 litre of diesel corresponds to 38,68 MJ); • capital cost is $100,000 per truck; • annual fixed cost is $1,000 per truck; • variable cost is $5,000 per 1,000,000 tkm; • residual capacity is declining linearly to 0 in line with the life duration of the technology; • life duration is 7 years. Units used are the following: • capacity is in thousands of cars (Ttrucks); • activity is in Giga tons-kilometers (Gtkm);
Figure 3. Optimal Mix: 75 tonnes of CO2
Many detailed results are obtained using techno-economic energy modeling and are indeed frequently published. An example for Canada is given in [11].
• demand is in Giga tons-kilometers (Gtkm; demand and activity always share the same units); • monetary units are in millions of dollars ($M); • energy units are in PJ.
168
OSeMOSYS Energy Modeling Using an Extended UTOPIA Model
Table 3. TFD’s Techno-Economic Parameters
Name ResidualCapacity CapacityToActivityUnit InputActivityRatio OutputActivityRatio CapitalCost FixedCost VariableCost OperationalLife
Units Ttrucks Gtkm/Ttrucks PJ Gtkm $M/Ttrucks $M/Ttrucks $M/Gtkm Years
Value 1 1 0.3868 1 100 1 40 12
The base-year (1990) demand is 1 Gtkm (1,000 trucks × 50,000 km/truck × 20 tonnes). All other information previously listed can be summarized in the Table 3. Computation of the values shown in Table 3 is similar to what has been presented in section 4.1. Details for the CapacityToActivityUnit and InputActivityRatio parameters are given below. 4.5.1
CapacityToActivityUnit Parameter
Remember that the CapacityToActivityUnit parameter establishes the relationship between the capacity and the activity of a technology, and that units of activity is in line with with the units of its related end-use demand which is Gtkm for freight transport (TF). For the TFD technology, a capacity of 1 truck travels a distance of 50,000 km per year, which is equivalent to 50 Mkm for 1,000 trucks. Since it is supposed that the average load per truck is 20 tonnes, the activity amounts to 50 Mkm × 20 tonnes = 1 Gtkm/Ttrucks. 4.5.2
InputActivityRatio Parameter
The InputActivityRatio determines the quantity of fuel, which is diesel (DSL) for TFD, needed by the technology to produce some level of output specified by the OutputActivityRatio parameter (which is 1 unit in Table 3, i.e. 1 Gtkm). It is supposed that the technology’s efficiency is 100 km per 20 litres of diesel. This means that 5 km are travelled per litre of fuel. According to [10], this is equivalent to 100 tkm per 38.68 MJ, or 1 tkm / 0.3868 MJ, i.e. 1 Gtkm / 0.3868 PJ. These two additional examples of data computations shall be sufficient for professionals, professors and students to create their own data representing their particular reference energy system.
5
Energy Toolbox and Community
The development of an open-access energy modeling tool such as OSeMOSYS was welcomed with great success at Stockholm’s International Energy Workshop in 2010. OSeMOSYS’ original team members stated that it was designed “to fill a gap in the analytical toolbox available to the energy research community and energy planners in developing countries. At present there exists a useful, but limited
set of accessible energy system models. These tools often require significant investment in terms of human resources, training and software purchases in order to apply or further develop them. In addition, their structure is often such that integration with other tools, when possible, can be difficult.” It turned out that “less than 10% of participants were from developing countries” (both citations are from [6]). Many researchers are interested in a transparent, powerful yet easy-to-use energy modeling toolbox. Growing interest for OSeMOSYS has arisen since 2010: publications, international conferences, applications and user interface developments, the future of OSeMOSYS is quite compelling. Professionals, professors and graduate students interested in energy shall take a moment to learn about it. It is argued that this paper is a useful introduction for talented and passionate individuals from the energy sector with an engineering, economic, managerial, social, and/or environmental point of view. Moreover, there is a link between the Long range Energy Alternatives Planning system (LEAP) (see [12]) simulation software and the OSeMOSYS optimization framework. This duo offers interesting possibilities for powerful analyses of energy systems.
6
Conclusion
This paper provides a hands-on example on how to use energy modeling in order to develop coherent and insightful policies in a context of greenhouse gases emissions limitations. It presents the OSeMOSYS open-source energy modeling system which is similar in nature to the well-known MARMAK-family techno-economic energy models (TIMES being the current version used worldwide). The UTOPIA example is presented to provide a good understanding of such material. An extended version of the original UTOPIA model is proposed. The technical step-by-step approach of creating this extension involves many topics which are part of the everyday life of an energy modeller. The reader gains by learning the full process on how to build a brand new end-use demand and the competing technologies to satisfy such demand. Pareto optimality is proposed as an example of powerful results which are of great value to decision makers. Leaders understand that negotiations on policies limiting greenhouse gases emissions have profound impacts on optimal and necessary energy fuels and technologies to reach severe targets and shall be interested in such models. OSeMOSYS has a growing audience and this paper offers a good introduction for professionals, professors and students involved in such complex issues. Moreover, the public now asks for government representatives to use a transparent and scientific approach on climate change. Open-access technoeconomic energy modeling is a tool that will help current and future leaders accomplish this task.
Universal Journal of Educational Research 5(1): 162-169, 2017
Acknowledgements This work was supported in part by the Canadian Defense Academy Research Program (CDARP) funding of the Royal Military College of Canada.
REFERENCES [1] OMNI Model Management System available from https://www.haverly.com/main-products/13-products/15omni
169
Bazillian, OSeMOSYS: the open source energy modeling system: an introduction to its ethos, structure and development, Energy Policy, Vol. 39, No. 10, 5850-5870 [8] GLPK, Online available from https://www.gnu.org/software/glpk/ [9] OSeMOSYS Model and Data, Online available from http://www.osemosys.org/getting-started.html [10] Units Conversion, Online available from https://www.neb-one.gc.ca/nrg/tl/cnvrsntbl/cnvrsntbleng.html
[2] Fishbone, L.G. and Abilock, H., Markal, a linear programming model for energy systems analysis: Technical description of the bnl version, International Journal of Energy Research, Volume 5, Issue 4, 353-375, 1981
[11] Trottier Energy Futures Project, Canada’s Challenge & Opportunity, Transformations for major reductions in GHG emissions, Full Technical Report and Modelling Results, April 2016
[3] ETSAP, Online available from http://www.iea-etsap.org/web/index.asp
[12] An Introduction to LEAP, Online available from http://www.energycommunity.org/ default.asp?action=47
[4] GAMS, Online available from https://www.gams.com/ [5] TIMES, Online available from http://www.iea-etsap.org/web/Times.asp [6] OSeMOSYS, Online available from http://www.osemosys.org/ [7] M. Howells, H. Rogner, N. Strachan, C. Heaps, H. Huntington, S. Kypreos, A. Hughes, S. Silveira, J. DeCarolis, and M.
[13] Heaps, C.G., 2012. Long-range Energy Alternatives Planning (LEAP) system. [Software version 2015.0.19] Stockholm Environment Institute. Somerville, MA, USA. www.energycommunity.org [14] Stockholm Environment Institute, LEAP, Long-range Energy Alternatives Planning System, Training Exercices, February 2016, Updated for LEAP 2015.