Under consideration for publication in Knowledge and Information Systems
Outcome Aware Ranking in Value Creation Networks 1 S Kameshwaran2 , Vinayaka Pandit2 , Sameep Mehta2 , Ambika Agarwal3 and Kashyap Dixit3,4 2 3 4
IBM Research - India This work was done while the author was at IBM Research - India. Pennsylvania State University.
Abstract. In this paper, we consider a natural ranking problem that arises in settings in which a community of people (or agents) are engaged in regular interactions with an end goal of creating value. Examples of such scenarios are academic collaboration networks, creative collaborations, and interactions between agents of a service delivery organization. For instance, consider a service delivery organization which essentially resolves a sequence of service requests from its customers by deploying its agents to resolve the requests. Typically, resolving a request requires interaction between multiple agents and results in an outcome (or value). The outcome could be success or failure of problem resolution or an index of customer satisfaction. For this scenario, the ranking of the agents of the network should take into account two aspects: importance of the agents in the network structure that arises as a result of interactions and the value generated by the interactions involving the respective agents. Such a ranking can be used for several purposes such as identifying influential agents of the interaction network, effective and efficient spreading of messages in the network, etc. In this paper, we formally model the above ranking problem and develop a novel algorithm for computing the ranking. The key aspect of our approach is creating special nodes in the interaction network corresponding to the outcomes and endowing them independent, external status. The algorithm then iteratively spreads the external status of the outcomes to the agents based on their interactions and the outcome of those interactions. This results in an eigen-vector like formulation, which results in a method requiring computing the inverse of a matrix rather than the eigen-vector. We present several theoretical characterizations of our algorithmic approach. We present experimental results on the public
1
Preliminary version of this paper appeared in the ACM Conference on Information and Knowledge Management (CIKM), 2010 (Kameshwaran, Pandit, Mehta, Viswanadham and Dixit, 2010). Received Feb 24, 2011 Revised Apr 19, 2012 Accepted Jul 21, 2012
2
Kameshwaran et al
domain real-life datasets from the Internet Movie Database and a dataset constructed by retrieving impact and citation ratings for papers listed in the DBLP database.
1. Introduction There are many diverse domains like academic collaboration, service industry, and movies, where a group of agents are involved in a set of activities through interactions or collaborations to create value. The end result of the value creation process is two pronged: firstly, there is a cumulative value created due to the interactions and secondly, a network that captures the pattern of historical interactions between the agents. The ranking of agents should take into account 1) influence of an agent in the network and 2) contribution of the agent in the value creation process. We begin with two motivating applications. First one is an application in software services setting which directly motivated our research work. A distinguishing feature of the Services industry is that it involves people interacting with each other to solve a client’s specific problem rather than transforming goods (or raw materials) to produce a product. Consider maintenance and support services, which is a predominant component of the software services industry. Essentially, the service organization takes the responsibility for maintenance and support of a software product resolving requests for problem resolution. The requests may come either from the users or from a testing team of the software product. A service delivery manager’s view of the operations is as follows: (i) a series of requests arrive, (ii) for each request, the manager puts together a team of agents to resolve the request, and (iii) an outcome indicating the effectiveness with which the request is resolved is recorded. After a sufficiently long duration of delivering such a service with a stable set of agents, the delivery manager may wish to rank the agents. One might be tempted to believe that the manager would like to rank the agents based on their average effectiveness. But, our interviews with domain experts revealed that the importance of an agent is not just based on average effectiveness. Domain experts would like to take into account an agent’s connection pattern in the delivery network as well due to the following reasons. A typical request requires modifications to one or more submodules of the product and also it needs agents with different roles such as developer, reviewer, and tester. Since each request requires handoffs between the agents responsible for them, an agent’s connections indirectly capture the agent’s influence: familiarity with the subdomains of the connected agents due to the handoffs and ability (or inability) to work with the other agents (depending on the outcomes). When a new service request arrives, estimates of the agents’ influence (or rank) and their role/expertise can be utilized to make a decision on the composition of the team to resolve the request. As a second example, we consider the problem of ranking authors based on academic publications. The goal of academic publication is to disseminate new knowledge and novel insights obtained from the research. The outcome of every academic publication can be measured based on parameters such as the reputation of the conference or journal of publication, number of citations over a period of time, and the awards won. At the same time, the influence of an academic researcher is not determined merely by the outcomes of the papers. The connections an author develops and the influence of coauthors play a major
Outcome Aware Ranking in Value Creation Networks
3
3
role in the overall influence of an academic researcher. Thus, the ranking of academic researchers needs to take into account the structure of their interactions (obtained from a database like DBLP) and the impact of their papers (obtained from citations, impact ratings of conferences etc). Some of the works in this direction can be seen in (Newman, 2001a; Newman, 2001b; Liu, Bollen, Nelson and de Sompel, 2005). There are several considerations for computing rankings in academic collaboration networks that reflect both the importance in the network structure and the ability to create value. For instance, consider a governmental funding agency which has a priority of promoting research on an important topic in an existing community of academic researchers. Typically, this is done by judiciously allocating a limited amount of funding to the most appropriate group of investigators. Naturally, the goal is to allocate the funding in such a way that the importance of the topic spreads quickly and reliably in the network. One way to achieve such a goal would be to identify a small set of researchers who have a proven record of authoring papers which are popularly embraced by the community (reflected in citations) and who are well connected in the community to foster faster and effective collaborations. The ranking problem considered in this paper is aimed at identifying such candidates (they will be ranked higher in the list). We observe that the application described here is essentially the so-called viral marketing (Domingos, 2005; Subramani and Rajagopalachari, 2003). The literature of social network analysis (SNA) is rich on ranking nodes; good starting points for this literature are (Wei, 1952; Kendall, 1955; Page, Brin, Motwani and Winograd, 1998; Kleinberg, 1999). However, the dominant focus in most of this literature is on capturing the structural properties of the networks. To the best of our knowledge, the task of ranking nodes while simultaneously taking into account the structure of the interactions and the value created by the interactions has not received much attention. In Section 2 we summarize the SNA literature from the ranking perspective and highlight the limitations of the traditional ranking techniques. The notion of value creation networks (referred as interaction networks in our earlier works) is used to essentially capture and analyze the phenomena of agents interacting for a shared goal of value creation (Kameshwaran, Mehta, Pandit, Parija, Singh and Viswanadham, 2009; Kameshwaran et al., 2010; Kameshwaran, Mehta and Pandit, 2011). In this paper, we develop a novel technique for ranking nodes that takes both the structure and outcomes into account. We first build an augmented network that varies from standard social networks by introducing special nodes corresponding to outcomes and creating appropriate directed edges (as opposed to undirected networks that are common in social network analysis). In the augmented network, the special status of the outcomes is captured by associating certain explicit values (or utilities) with the outcome nodes. The core idea of the algorithmic technique is to iteratively transfer the status of the outcome nodes to the other nodes (corresponding to the agents) in the network based on their interactions and the outcomes of the interactions. This results in a eigen-vector like formulation, but results in a different computational task: that of computing the inverse of the matrix corresponding to the augmented network. We explore interesting mathematical and semantic properties of our technique. We present experiments that show the progress our method makes in the direction of outcome aware ranking. We compare it against a baseline algorithm derived from traditional eigenvector ranking approach. We conduct experiments on the following real-life, public-domain datasets: (i) Value creation network con-
4
Kameshwaran et al
structed based on the data from the Internet Movie Database (IMDB)2 in which each movie is treated as an interaction involving its lead actors (ii) Value creation network constructed based on papers listed in DBLP in the database/data mining area published between 1999-2004, and treating the citations from the Google Scholar as the value generated by the papers. The largest network we consider has close to 2900 nodes and 2500 papers. The rest of the paper is organized as follows. In Section 2.1, we discuss related literature on node ranking in graphs. In Section 2.2, we illustrate the inadequacies of traditional SNA techniques to carry out outcome aware ranking with help of an example instance. In Section 2.3, we formally define the problem. In Section 3, we present our outcome augmented ranking algorithm (OARA) and analyze its theoretical characterizations. In sections 4 - 6 we present our experimental setups and results. We conclude with discussion of directions for future work in Section 7.
2. Node Ranking in Networks Ranking nodes of a network with respect to some importance or influence measure is an active research topic in the fields of social network analysis, network data mining, and complex networks in general. A node refers to an entity that could be an individual, role, group, or an organization. Throughout the paper, we use the terms agents, actors, and nodes interchangeably. Edges encode relationships between nodes, which are of two kinds: Persistent (weblinks, friendship, membership, affiliations) and discrete interactions (e-mails, collaboration, authorship, team work). In the following, we briefly review some of the works in node ranking related to our problem.
2.1. Related Literature Various methods exist for ranking nodes in a network. Degree centrality is a measure in which the nodes in the network are ranked based on the number of nodes to which they are connected. This translates to ranking nodes purely based on their experience or number of interactions. Eigenvector centrality (Kleinberg, 1999; Page et al., 1998) is a popular measure for ranking nodes in a network. It measures the centrality of a node as a linear combination of the centralities of the nodes to which it is connected. Unlike degree, which weighs every adjacent node equally, the eigenvector weighs adjacent nodes according to their centralities. Let A = [aij ]N ×N be the (weighted) adjacency matrix of a network with N nodes. The measureP xi for node i depends on the status measures of the interacting nodes; xi ∝ j aij xj . This can be expressed in matrix notation as λx = Ax. Here, λ is the largest eigenvalue and x is the corresponding eigenvector. The agents can then be ranked based on the component wise value of the eigenvector x. The idea of using the eigenvector to do ranking dates back to the 1950’s (Wei, 1952; Kendall, 1955). However, in recent times, this concept has been applied on a massive scale in ranking the web-pages in the HITS (Kleinberg, 1999) and the PageRank (Page et al., 1998) algorithms. A small representative sample of 2
http://www.imdb.com/interfaces
Outcome Aware Ranking in Value Creation Networks
4
5
relevant work on node ranking with relevance to the problem considered in this paper, are presented below. Co-authorship networks have been used extensively to determine the status of individual researchers and the structure of scientific collaboration (Newman, 2001a; Newman, 2001b). To rank the authors in a co-authorship network, AuthorRank algorithm was proposed in (Liu et al., 2005). It is a modification of PageRank (Page et al., 1998) algorithm for a weighted, directed network. PageRank is originally designed to rank retrieval results based on the hyperlink structure (persistent relationship) of the web, which is a directed, binary graph. The ranking is similar to eigenvector ranking where a page has high rank if the sum of the ranks of its backlinks is high. In AuthorRank, the construction of the weights on the links between the authors is different from that of the PageRank. The coauthorship frequency and the number of authors per publication are taken into account in the network construction. Topic-sensitive PageRanks was developed in (Haveliwala, 2002) by computing several eigenvectors biased by specific topics. The ranking for a query is obtained by appropriate combination of precomputed eigenvectors. The relative importance of nodes in a network with respect to a set of root nodes was considered in (White and Smyth, 2003). The proposed ranking algorithm is based on the notion of weighted paths, where a node is considered to be important to a root node if they share many short paths. A flow based algorithm to rank webpages based on the relevance to the user query was proposed in (Chitrapura and Kashyap, 2004). A conceptual encoding of the links of the webgraph by extracting keywords and repeating phrases from anchor data of the web-pages was developed in (DeLong, Mane and Srivastava, 2006). The augmented webgraph is exploited to present improved concept-aware page ranking. Algorithms to find important nodes in dynamic networks by studying the node evolution and interactions were studied in (Asur, Parthasarathy and Ucar, 2007). We observe that none of the above works explicitly consider the value created from agent interactions. There has been considerable work in identifying influential nodes from the perspective of diffusion in social networks. In (Kempe, Kleinberg and Tardos, 2003), the ranking problem is modeled as the following combinatorial optimization problem: Given a social network and a diffusion model across the edges of the network and an input parameter K, pick a set of K nodes such that total influence is maximized. The susceptible, infected, susceptible (popularly known as SIS) model from epidemiology is used in (Saito, Kimura, Ohara and Motoda, 2012) to model diffusion as a stochastic process similar to the spread of diseases. This line of work differs from our problem in the sense that there is no explicit value creation activity in the network and the influence is modeled as a diffusion process.
2.2. Limitations of traditional SNA techniques In this section, we present some of the limitations of the previous approaches to measuring the influence or importance of the nodes of a network. Consider the example shown in Figure 1, which models agent interactions in three different applications: service delivery, academic collaboration, and movie industry. There are five agents A, B, C, D, and E and four interactions involving subsets of them. The outcomes used to capture the value generated are: customer satisfaction index for service delivery, citation index for academic collaboration, and IMDB
6
Kameshwaran et al Individual Interactions
D
A B
C
C E
B
C Illustrative Outcomes Service Interactions Satisfaction Index
30
32
15
24
Co-authorship Citation Index
32
12
15
47
Movie co-stars User Rating > 8
Y
N
N
Y
Fig. 1. Individual interactions with illustrative outcomes from different communities
D
A
B
C E
Fig. 2. Interaction network of interactions from Figure 1 rating with a threshold of 8/10 (binary outcome) for movies. The structure of their interactions is captured in Figure 2. For the sake of exposition, we consider the case of service delivery outcomes (first row of Figure 1). We begin with the ideal or expected ranking that takes into account both the structural importance of the nodes and the outcomes.
2.2.1. Expected Ranking based on Structure and Outcomes of Interactions Considering both structural importance and contribution to outcomes, it is imperative that C should be ranked first and B should be ranked second. In terms of structural importance, E and D have the advantage of being connected to the most important node. However, the node A has the distinction of having the highest outcome score. But, outcome score of A is only marginally higher than that of D. Outcome score of E is much lower than that of A. Hence, we consider D, A, E to be the expected ordering between them that takes both the aspects into account; thus, giving the final ordering of C, B, D, A, E. The results of known ranking methods is tabulated in Table1. Note that agents with the same rank are shown within the braces {. . . }. Next, we explain different rankings in some detail.
2.2.2. Degree Ranking Degree ranking merely counts the number of interactions and hence quantifies only the experience. The ranking due to degree is: C, B, {A, D, E}.
Outcome Aware Ranking in Value Creation Networks Methodology Degree Eigenvector Outcome Expected (Structure + Outcomes)
5
7 Ranking C, B, {A, D, E} C, B, {D, E}, A A, D, E, B, C C, B, D, A, E
Table 1. Rankings based on different methodologies
2.2.3. Eigenvector Ranking Eigenvector ranking reflects the structural importance quite well by modeling the inherited or transferred status and implicitly takes into account the degree ranking. The largest eigenvector for the adjacency matrix of the network is 1.8477 and the corresponding eigenvector is 0.271 (A), 0.5(B), 0.653 (C), 0.354 (D), and 0.354 (E). The ranking is: C, B, {D, E}, A. With respect to this example, its limitation is exposed by the fact that it fails to distinguish between D and E which have a clear separation in terms of outcomes.
2.2.4. Outcome based Ranking The ranking obtained by just considering the average satisfaction indices for each of the nodes is, A, D, E, B, C. This ranking completely ignores the structural importance of nodes B and C. From the above discussion, we observe that the intended ranking mechanism should be similar in spirit to eigenvector ranking. However, it should be able to take into account value creation aspects of nodes to distinguish between nodes, which have similar or equal structural importance.
2.3. Problem Definition Let V = {1, 2, . . . , N } be the set of agents and {1, 2, . . . , T } be the set of interactions that have taken place in the system. Each interaction results in one of the possible outcomes R = {1, . . . , M }. Following indices are used: i and j for agents, t for interactions, and m for the outcomes. An interaction t ∈ {1, 2, . . . , T } involves a subset of agents Vt ⊆ {1, 2, . . . , N }. The pattern of the interaction is given by the edge set Et with a non-negative t weight δij on the edge (i, j) ∈ Et . The weight for non-existent edges is zero: t δij = 0, (i, j) 6∈ Et . As t is an interaction among the Vt agents, the graph (Vt , Et ) is connected. The specific structure of the graph is given by the nature of the interaction. If the interaction is that of a collaboration or group work with one interaction involving all, then the graph is complete. For hierarchical interactions, the graph will have a tree structure. Let Rt ∈ {1, 2, . . . , M } be the observed outcome of the interaction. The interaction t is characterized by the t tuples (Vt , Et , {δij }, Rt ). The interactions are collaborative in nature for the three applications (service delivery, academic collaboration, and movies) considered in this paper. Let ρm ∈ R denote the utility or value of an outcome m ∈ R. The set {ρm : m ∈ R} can be cardinally ordered and if ρm0 > ρm00 , then the outcome m0 is preferable to m00 . Typically, the utility of the outcomes is ascertained based on domain knowledge and also varies over time. Even more importantly, the user of a ranking scheme may want to experiment with different options of outcomes.
8
Kameshwaran et al
So, the representation of the data and the technique should ideally allow the user to change just the outcome values and observe the corresponding changes in ranking. t Given the past t interactions {(Vt , Et , {δij }, Rt )} and the outcome utilities {ρm : m ∈ R}, the goal is to rank the agents in a manner that captures both their structural importance as well as their contribution to the value creation process.
3. Outcome Aware Ranking In this section, we present our algorithmic approach for computing the outcome aware ranking. At a high-level, the main ingredients of our approach are: – augmenting the interaction network by creating special nodes that have independent external status (or utility) and correspond to the different possible outcomes, and – a mechanism to spread the status of the special nodes to the nodes corresponding to the agents. The mechanism of spreading the status of the special nodes is similar to what happens in the eigen-vector based ranking approach, but results in a different computation. Our approach requires the computation of the inverse of a matrix obtained from the augmented network.
3.1. Network Construction The first step of the approach to build the appropriate network that is amenable for analyzing the pattern of interactions and their outcomes in a unified manner.
3.1.1. Interaction Network Firstly, the individual interactions are aggregated to obtain the agent interaction network, which, with a slight abuse of notation, is given by the graph (V, E, {δij }): V = ∪t Vt E = ∪t Et X t δij = µt δij ∀i, j
(1) (2) (3)
t
The overall strength of interaction between any two agents is the linear combination of the individual strength of interactions. If the interactions are chronologically ordered, then µt can be used as the past influence factor to model the relative importance of the interactions with respect to time. By judiciously choosing {µt }, one can model various kinds of past influences: Uniform, sliding window, etc. We call the edge weight matrix A = [δij ] of order N as the agent interaction matrix. This matrix is symmetric and aggregates the past interactions, but does not capture any information on the outcomes of the interactions. We now present a method that augments this matrix in a way that appropriately aggregates the contribution of the nodes to the value creation process.
Outcome Aware Ranking in Value Creation Networks
A 1 1/2 O2
O1
1/2
1/2
1
6
9
D
1/2
1 1/2
B
O4 C 1/2
1/2
1
1/2 E
O3
Fig. 3. Interaction network with outcomes augmented as nodes
3.1.2. Augmenting the Outcomes as Nodes The main reason the eigenvector based approach captures the structural aspects so well is the manner in which a node transfers part of its status to its neighbors and derives its own status as a linear combination of the status of its neighbors. Consider an interaction which involves Vt nodes and have Rt as outcome. We need a mechanism by which the utility of Rt can be transferred in parts to the nodes in Vt . At the same time, the utility of the outcome Rt itself is a prior and should not be affected by the status of the nodes in Vt . This suggests the following natural directed construction. Let the outcome of interaction t be m. t The graph (Vt , Et , {δij }) is updated as follows:
X
Vt ← Vt ∪ {m} Et ← Et ∪ {(m, i)}, ∀i ∈ Vt t δmi ≥ 0, ∀i ∈ Vt
(4) (5) (6)
t δmi =1
(7)
i∈Vt
The outcome m is added as a node, refered as outcome-node. A directed edge is added from m to each of the other agents that participated in the interaction. The weights on the newly added edges, given by (6) and (7), capture the relative contribution of agents in realizing the outcome m. The weights on the nont t existent edges are zero: δim = 0, ∀i and δmi = 0, ∀i 6∈ Vt . The status or the influence of the outcome node is later used in the algorithm to transfer it to the participating nodes via the directed edges. Without loss of generality, we can assume that each of the outcomes is realized in at least one of the interactions. The aggregation of the graphs augmented with outcomes is given by: V ← V ∪ {1, 2, . . . , M } E ← E ∪ {(m, i) : ∃t, Rt = m ∧ i ∈ Vt } X t δmi = ω t δmi , ∀i, m
(8) (9) (10)
t
δim = 0
(11)
The outcomes {1, 2, . . . , M } are added as nodes to the interaction network and an edge from outcome m to a node i exists if i had been a part of at least one interaction with outcome m. The weights on the outcome-agent edges are taken
10
Kameshwaran et al
as linear combination of the corresponding weights in the individual interactions. We call the above network as the agent-outcome interaction network and the corresponding edge weight matrix as the agent-outcome interaction matrix ∆ of order (N + M ). For the network in Figure 2 with outcome II of Figure 1, the agent-outcome interaction network is shown in Figure 3. The four outcomes O1, O2, O3, O4 correspond to the outcomes of the four interactions. Assuming equal contribution from each agent, weight on the directed edge from an outcome to an agent is 1/2. The matrix ∆ that captures both the inter-agent interactions and agentoutcome interactions is asymmetric. The overall intended effect of the directed construction is to let the outcome-nodes transfer their utilities to the agents and the utilities of the outcome-nodes are not altered. At this point, we observe that, while the matrix ∆ captures agent-agent and agent-outcome interactions, it still does not capture the independent, external status (or utility) of the outcomes. In the next section, we present our algorithm which brings ∆ and the external status of the outcomes to arrive at outcome aware ranking. The above methodology is motivated by a ranking technique called as alpha-centrality (Bonacich and Lloyd, 2001).
3.2. Outcome Augmented Ranking Algorithm (OARA) The traditional eigenvector ranking has a limitation that it can only be applied to non-negative, symmetric matrices. Thus, if the underlying graph is asymmetric, especially with unchosen nodes (nodes with zero in-degree), the ranking provided by eigenvector centrality is inconsistent. The unchosen nodes receive no status from the other nodes and hence contribute nothing to the nodes to which they are connected. But, in our construction the zero in-degree nodes play a critical role of transferring the status of outcomes to the nodes. Let e be the vector that captures the external status of all the nodes. Precisely, e[i] for an agent i is the status endogenous to the interactions and e[m] for outcome node m is a function of its value. Let x be the vector that an iterative technique computes as the final influence of the nodes. In other words, the difference vector (x − e) should be expressible in an eigenvector-like form with respect to a scaling parameter α and the incident matrix ∆ of the augmented network. (x − e) = α∆T x
(12)
In other words, we are looking for an x such that, x = α∆T x + e
(13)
Observe that the Equation (13) captures the effect of interactions and the values associated with the outcomes nodes. Our measure of influence of the nodes is similar to a centrality measure used by Bonacich and Lloyd (Bonacich and Lloyd, 2001) in finding influence of nodes in unweighted, directed graphs in very small social networks coming from marriage data among elite families. In what follows we establish some important properties of the approach. Firstly, it is easy to see that, it reduces to the eigenvector ranking when the relationships are symmetric and the value of all the outcomes are identical (say
Outcome Aware Ranking in Value Creation Networks
7
11
zero). In the general setting as above, the value of x is given by x = (I − α∆T )−1 e
(14)
The vectors e and x, and identity matrix I are of order (N + M ).PIt is easy to ∞ show that the term ((I − α∆T )−1 ) is the convergence of the sum i=0 αi (∆T )i T as long as α ≤ 1/λ where λ is the largest eigenvalue of ∆ (when it exists). Moreover, the term αi (∆T )i is the term which gives lesser and lesser importance for longer paths between two agents in the interaction network. The suggested range for the parameter α is therefore (0, 1/α) (Bonacich and Lloyd, 2001). We now present the effect of both the free parameters of the above approach: α and the vector of outcome values, e.
3.2.1. Vector of Outcome Values: e In this section, we first show that our usage of the vector e is semantically sound. In particular, we show that the value of outcome nodes themselves do not undergo any change during the algorithm. We then show how to set e rigorously. Let us assume for now that we have chosen α ∈ (0, 1/λ). The vector e for our problem is (e1 , e2 , . . . , eN , eN +1 , . . . , eN +M ), where the first N components correspond to the exogenous status of the nodes and the last M correspond to the exogenous status of different outcomes. The component ei quantifies the external status of agent i that is independent of ∆ and similarly em quantifies the external status of outcome m. Setting e = 1 gives equal external status to all the agents and the outcomes. Algorithmically, equal status setting will overcome the anomalies due to asymmetric connections (from outcome nodes to agents) and the unchosen status of outcome nodes (with no incoming edges). However, the outcomes are differentiated by the value generated. For example, a popular measure of journal publication is the impact factor. Impact factors differentiate the journals and a publication in a high impact journal earns more credits than that of a lower impact one. Consider the following assignment of e. ei = 1, ∀i eN +m = θρm , ∀m, θ > 0
(15) (16)
The assignments in Equation (15) reflect the fact that the exogenous status of all the agent nodes are uniform. The outcomes on the other hand have their utilities as the external status. The utilities are unique up to a linear transformation and hence the external status of an outcome is defined as proportional to its utility by a non-zero scalar θ. In other words, {θρm } still preserves the cardinal structure and the relative magnitude of the utilities are unchanged. The justification for associating non-uniform exogenous status with the outcome nodes is: the utilities of the different outcomes are independent of the way they are achieved. For example, the utility of a research article is not determined by the authors of the paper, rather it is decided by its impact, say the number of citations it gets. Therefore, while the exogenous status of the outcome-nodes should influence the status of the other nodes, the solution x of Equation (14) should not alter the status of the outcome nodes. The following derivations show this property to be indeed true. Define matrix Y of order (N + M ): Y = (I − α∆T )−1
(17)
12
Kameshwaran et al
Ranking: A, B, C Ranking: B, A, C
xA xB Ranking quotient
Ranking: B, C, A
xC
Ranking: C, B, A xC xB xA
! max" !"
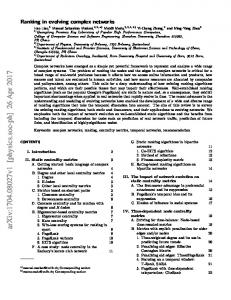
Fig. 4. Rank quotients of vertices as a function of θ
From the way ∆ is constructed, it is easy to show that, yN +m,N +m = 1 ∀m yN +m,N +m0 = 0 ∀m, m 6= m0 Rephrasing x vector in terms of Y , X X xi = yij ej + yi,N +m eN +m , ∀i j
(21)
Substituting for the e, as defined in (15) and (16), ! X X xi = yij + θ yi,N +m ρm , ∀i xN +m = θρm , ∀m
(20)
m
xN +m = eN +m , ∀m
j
(18) (19)
(22)
m
(23)
The components of x corresponding to outcome nodes have the same value as their respective external status. On the other hand, the ranking quotients {xi } for the other nodes are dependent on θ and rankings could possibly change with respect to the choice of θ. As the other terms in (22) are constants, we have N lines given by (22) as a function of θ. If all these lines are parallel, then ranking is independent of θ. Otherwise, the rankings will depend on θ as shown in Figure 4. The θ > 0 is a convenient measure of trade-off that balances the external status of agents versus the external status of the outcomes. As θ → ∞, external status of outcomes are treated with increasing influence over that of the agents. It is worth noting that external status among the agents is unchanged (see (15)) and the relative utility of the outcomes is still preserved (see (16)). The θ thus denotes the trade-off of agents’ status versus the outcomes’ status. To obtain rankings with θ → ∞, one can choose a θ > θmax (greater than all the intersecting points, as shown in Figure 4), so that the ranking will remain unchanged with further increase in θ value. As each line will possibly intersect
Outcome Aware Ranking in Value Creation Networks α 0.054, 0.102, 0.15, 0.198 0.247, 0.295, 0.343 0.391, 0.439, 0.487
8
13
Ranking C, B, A, D, E C, B, D, A, E C, B, D, E, A
Table 2. Ranking for different α values
at N − 1 points with N − 1 lines, the total number of possible intersecting points are (N − 1)(N − 2)/2. Hence, the maximum of the intersection points, θmax can be estimated in O(N 2 ) time. The assignments (15) and (16) are one way of assigning external vectors, which is used predominantly in the experiments presented in this paper. However, one can set any real numbers that captures the relative status of the agents and the outcomes, for the application domain that is being modeled. Later we illustrate the use of setting negative status values to differentiate preferable versus non-preferable outcomes.
3.2.2. The α Value Another free parameter that affects the ranking is α ∈ (0, 1/λ). The parameter α reflects the relative importance of the structure versus outcomes in determining the rank of the agents. For the network in Figure 3, the largest eigenvalue of the ∆ matrix is 1.8477 and hence α was chosen in the range (0, 1/1.8477). The table 2 shows the rankings obtained for ten different equally spaced α values in the above range. The ranking given by mid-range α values is that of the expected ranking, whereas the low range is same as that of outcome rank and the higher range is more similar to eigenvalue and degree rank (also see table 1). It is worth noting here the difference between α and θ: α reflects relative importance of structure of the interactions over the outcome of the interactions, whereas θ reflects the relative importance of external status of the agents over the external status of the outcomes. The previous section showed the influence of θ in the ranking. In the following, we propose a novel way of choosing α by analyzing the influence of outcomes and interactions over the ranking. Let an α ∈ (0, 1/λ) be chosen. Let R be the ranking for assignments (15) and (16) for the utility {ρm }. Construct a new set of utility {µm } with the opposite order of preference. Thus, the outcome with the highest utility in {ρm }, has the lowest in {µm }. Similarly, the outcome with second highest in {ρm } is one but last in {µm }. Let R be the ranking with utility {µm } and α. For a given value of α ∈ (0, 1/λ), we would like to estimate the influence of structure and outcomes in the final rankings. We do this by exploiting the concept of Kendall correlation (Kendall, 1955). Given two complete rankings, Kendall correlation computes a score in the range of [−1, 1]. If the score is close to 1, it means the two rankings are identical and if it is close to -1, it means the two rankings are near opposite orders. If the Kendall correlation, τ (R, R) is close to 1, then the outcomes have negligible influence, as the rankings are not modified with the reversed utilities. Similarly, if the correlation coefficient is close to -1, one can infer otherwise. An equal influence of outcomes and interactions is achieved for an α with which zero correlation is achieved. Such an α may not exist for a given interaction network, as shown in the following example. Consider the star interaction network of Figure 5. The agents A1, A2, . . . , A20 had interacted with agent A0. The strength of interactions with A0 are 1, 2, . . . , 20
14
Kameshwaran et al
O1
O5
A1
A20
A2
A19 A18 A17
A3 1
20
2
A4
3
19
4
18 17 A0
12
11
10
9 A9
A12
A10
A11 O3
Fig. 5. A star interaction network with 21 agents and 5 outcomes
Fig. 6. Three different utilities for agents A1, A2, . . . , A20, respectively. Five outcomes O1, O2, . . . , O5 were observed. As shown in the figure, all the individual interactions of A0 with A20, A19, A18, and A17 had resulted in O1. Similarly, interactions with the next four agents in decreasing sequence resulted in O4 and so on. Each interaction has equal contribution from A0 and the interacting agent for the resulting outcome. Hence, the weight of the edge from outcome node O1 to A20 is 10 (half of 20 interactions) and that of to A0 is 37 (half of 20 + 19 + 18 + 17). For brevity, the network augmented with outcome nodes and edges are not shown in the figure. Figure 6 shows three different utility functions U1, U2, and U3 for the outcomes. The utilities are scaled to range (0, 1] as they are unique up to a multiplication by a positive scalar (θmax ensures the uniqueness). All the three functions are increasing over O1, O2, O3, O4, and O5. The rate of increase, however, is
Outcome Aware Ranking in Value Creation Networks
9
15
'
()*+,--./011)-,230*
!"&
!"%
43*),1 5,1".6*7"
!"$
5,1".8)7
!"#
!
α
Fig. 7. Trade-off of interactions and outcomes for utilities U1, U2, and U3
different: linear for U1, marginally increasing for U2, and marginally decreasing for U3. Thus, one can expect the difference in rate of increase to be reflected in the rankings. Let the utilities U1, U2, and U3 be reversed. For example, reversed utilities of U1 for O1, O2, O3, O4, and O5 are 1, 0.762, 0.525, 0.287, and 0.05. It is easy to verify that the ranking for the reversed utilities of U1, U2, and U3, for all α ∈ (0, 1/λ) will be A0, A20, A19, . . . , A1. Incidentally for this network, this ranking is also the same as that of degree based ranking and eigen ranking. Figure 7 shows the variations in Kendall correlation coefficient for the rankings with opposite utilities, with respect to α ∈ (0, 0.018) (the maximum eigen value λ = 53.572). As expected, the correlation is increasing towards 1. For all the three utility functions, the minimum possible correlation coefficient is positive and hence influence of the structure of agent interactions is considerably more than that of outcomes. For U2, Kendall correlation coefficient of zero is obtained for α = 0.02 and a ranking obtained for this α takes into account both the interactions and the outcomes in equal strengths. Note that the above discussions are for illustrative purposes and the inferences (with respect to U1, U2, and U3) are limited to the given star network. However, the proposed methodology of reversing the utilities and computing the correlation of the rankings for all α ∈ (0, 1/λ) enables one to analyze the trade-off of influence of outcomes and interactions. As it needs reversal of utilities and the rankings are derived from the same network, there are no anomalies in the trade-off analysis and requires no additional routines for the algorithm. Based on our analysis of the impact of α for the star network and for the network shown in Figure 3, we follow a heuristic of picking α in the lower half of the range of (0, 1/λ) to give a slight bias towards outcomes.
3.2.3. Negative utilities Figure 7 shows that the influence of outcomes in ranking cannot be completely controlled by α, as the Kendall correlation is non-negative for all the three utilities and for all α. If the utilities ρm are allowed to take both positive and negative values, the influence of outcomes can be significant. This can easily inferred as the interaction matrix is positive and the negativity in outcomes can change the ranking significantly. The three utilities U1, U2, and U3 in Figure 6 are altered to
16
Kameshwaran et al
Kendall Correlation
α
Fig. 8. Trade-off of interactions and outcomes with inclusion of negative utilities
include negative values without changing the nature of slope (linear, marginally increasing, and marginally decreasing, respectively) as follows: – Linear: −0.221, 0.017, 0.254, 0.492, 0.729 (U1 altered) – Marginally increasing: −0.06, −0.004, 0.114, 0.363, 0.89 (U2 altered) – Marginally decreasing: −0.418, 0.109, 0.359, 0.476, 0.532 (U3 altered) Figure 8 shows the Kendall correlation variations with respect to α ∈ (0, 1/λ). Comparing with Figure 7, one can notice the negative correlations for low α values. Thus negative utilities allows to chose a ranking with higher influence of outcomes than that of the structure of interactions.
3.3. Computational Experiments In sections 4 - 6, we present experimental results that show the efficacy of our approach. We conduct our experiments on real-life, public-domain datasets. We use datasets from the Internet Movie Database (IMDB) for ranking movie actors in Section 4. In Section 5, we use datasets from the Digital Bibliography and Library Project (DBLP) 10 and citation data from Google Scholar 11 to construct a value creation network of academic collaborations and rank the authors. The usage of the above datasets with respect to the value creation networks is summarized in Table 3. The results of rankings shown in the sections 4 and 5 are not absolute. As noted above, the rankings are all subject to several free parameters like α, e, and θ. Further, the datasets are created from a limited set of interactions. The reference to real movie actors, academic authors and their ranks are for illustrations of applicability of OARA over other techniques and should not be treated or referred as absolute rankings. Finally in Section 6, we conduct experiments on data generated from a custom simulator that we have built to simulate a service delivery organization that takes into account real-life teaming aspects. 10 11
http://www.informatik.uni-trier.de/ ley/db/index.html http://google.scholar.com
Outcome Aware Ranking in Value Creation Networks Application Movie Industry Academic Collaboration
12
17
Dataset Interaction Network IMDB Co-actors network
Agents
Interaction
Outcome
Lead actors
Movie
IMDB user rating
DBLP
Authors
Publication
1) Venue impact rating (Citeseer)
Coauthorship network
2) Citation index (Google Scholar)
Table 3. Datasets used in computational experiments
4. Experiments on ranking movie actors We view the movie making as a collaborative process in which the main actors of the movie collaborate to produce an outcome. This outcome is reflected in terms of external observations such as ratings of movie critics, ratings of large number of movie viewers, box office collections, awards etc. The typical SNA approach would consider the co-actor network and rank the actors based on their structural importance. Whereas ranking schemes focused on the outcomes would, for each actor, consider the average of the outcomes of the movies involving the actor and would then rank the actors based on these averages. In this section, we take a more comprehensive view and rank the actors based on the outcomes as well as their importance in the co-actor network. We use the IMDB dataset as a proxy for recording the outcomes of the movies.
4.1. Baseline Algorithm for Comparison As shown during the problem formulation naive application of known ranking techniques to our problem gives unsatisfactory results as they were not designed keeping these requirements in mind. However, as observed earlier, several characteristics of the eigenvector ranking are essential in our setting too. So, a natural question is: can a slight modification to the eigenvector ranking give meaningful rankings in our context?. Consider the matrix ∆ obtained from the special construction described in Section 3.1.2. This matrix is an asymmetric matrix. This is inevitable as the outcomes play a special role. So, we cannot directly use eigenvector computation which is meant for symmetric matrices. So, a natural heuristic is to consider the ranking according to the left singular vector corresponding to the largest singular value of ∆. In this case, ∆ is modified as follows: if there is an edge of weight w from an agent node i to an outcome node of value v, the corresponding ∆ entry is set to be w · v. Intuitively, this heuristic does not address the subtle technical point we covered in depth: that of ensuring that the outcomes are used to influence the ranking of agents and not vice versa. Our experiments show that this approach produces results which are inferior to the ones obtained by our technique.
18
Kameshwaran et al
4.2. IMDB Dataset IMDB allows us to programmatically extract the following data: list of all movies, list of movies according to genre and time period, within a genre top user rating movies, within a genre a random mix of movies, etc. We also get the user ratings corresponding to the movies in the lists that we work with. Also, for each movie, it lists the list of actors in the movie. Arguably, the outcome of a movie is impacted quite a lot by participants such as the director and rest of the technical team. However, in a mass rating medium like IMDB where a single movie gets thousands of votes, it is the performance of the main actors which influences its rating to a great extent. So, for a movie, we consider its overall user rating in the IMDB as its outcome. To ensure that our assumptions hold, we consider only those movies that have a certain minimum number of votes. One of the advantages with the IMDB dataset is, we can use familiar, identifiable names in small experiments and conduct controlled acts like changing the outcomes of their movies or including/excluding specific movies (or time periods) to show the conceptual strength of our formulation. For a given set of movies (which satisfy the property of a certain minimum number of votes), we construct the interaction network as follows: each actor who appears in any of the movies is an agent, each movie represents an interaction that is incident on all its main actors (we choose first 6 listed names) and the outcome associated with the interaction is the average user ratings for the movie. Corresponding to the above value creation interaction network, we construct the ∆ matrix as described in Section 3.1.2. Our experimentation explores the effects of the different constructions for the vector outcome values. As explained in last section, we choose α in the lower range of (0, 1/λ). We use these experiments to establish that our approach takes into account both structure and outcome, and the computed rankings are sensitive to any changes in both the aspects. Some of the important trends that we establish from our experiments are: – The baseline algorithm described in Section 4.1 is not very sensitive to the changes in the outcomes. – When the outcomes associated with a certain subset of movies is changed, the rankings of the actors obtained by OARA also undergoes corresponding change, thus indicating the sensitivity of our technique for changes in outcomes. – When we increase/decrease the importance of a subset of actors, then, in the ranking obtained by OARA, the ranking of the actors who are well connected to those actors also see a corresponding change. This indicates that our approach takes the structure into account while ranking the agents. – The choice of e is important to obtain good results. We demonstrate some effective and some not so effective constructions for e. The IMDB dataset, due to the presence of large number of widely recognizable actors makes it easy to verify intuitive correctness of the experiments on small datasets. We have extracted two special instances (List 1 and List 2) each having 28 and 30 actors respectively (small enough to be easily interpreted and large enough to need computation) which can be used to highlight conceptual strengths. List 1 and List 2 are enumerated in Table 4. The first instance consists of 28 actors from contemporary times. The second instance consists of 30 actors
Outcome Aware Ranking in Value Creation Networks Actor Index 1 2 3 4 5 6 7 8 9 10 11 12 13 14 15 16 17 18 19 20 21 22 23 24 25 26 27 28 29 30
13
19
List 1
List 2
Marlon Brando Al Pacino Robert De Nero Sean Bean Jean Reno Don Cheadle John Travolta Hugh Jackman George Clooney Casey Affleck Brad Pitt Matt Damon Dan Fredenburgh Bill Nighy Johnny Depp Orlando Bloom Jack Davenport Lee Arenberg Tom Hollander Jude Law Anthony Hopkins Sean Penn Samuel L. Jackson Kevin Bacon Tom Hanks Steve Buscemi Clive Owen Nicolas Cage
Marlon Brando James Mason (I) Louis Calhern Glenn Ford (I) Karl Malden Ben Johnson (I) Timothy Carey Richard Harris (I) Montgomery Clift Dean Martin (I) Frank Overton Malcolm Atterbury Robert Ryan (I) Burt Lancaster Frank Sinatra Ernest Borgnine Lee Marvin Rhys Williams (I) DeForest Kelley John Wayne (I) Walter Brennan Ed Wynn Stephen Boyd (I) Milton Berle Tony Bennett (I) Al Pacino Robert De Niro Broderick Crawford Ricky Nelson (I) Buddy Ebsen
Table 4. List of actors used in experiments
whose prime era was before 1970s. Since these two sets have fairly well known actors, we make our conceptual points using these instances. Results of ranking algorithms are generally meaningful only for connected interaction networks. When the graph is disconnected, the rankings across different components are not comparable. Therefore, we limit our instances to only connected interaction networks. We employ simple traversal techniques over the movie and actor lists to construct instances which are connected. To demonstrate the stability of the computational approach we construct interaction networks with 200, and 400 actors. To automatically assess the sensitivity of our technique for changes in outcomes, we use the Kendall tau distance (τ from now) between the following two rankings: before and after changes in the outcomes. As for the feasibility of our approach for very large graphs, it should be noted that the computation of an inverse is the most time consuming part; O(n3 ). Therefore, for most interaction networks like the completely cleaned, connected IMDB or DBLP, our approach can be used without any problem. For truly massive graphs like the web graph, exact computation is not feasible. Developing a technique that can be used even on massive graphs is an important challenge for future work.
20
Kameshwaran et al R1 = OARA(∆, e) R2 = SVD(∆) R3 = OARA(∆0 , e) R4 = SVD(∆0 )
23 9 25 12 10 7 21 15 3 6 20 8 24 16 28 2 22 26 27 11 1 4 14 18 5 17 19 13 9 23 25 12 7 10 21 15 3 20 8 6 24 28 16 2 22 26 27 11 4 1 14 5 17 18 19 13 25 28 23 9 12 10 7 21 15 3 16 20 6 8 24 2 22 26 27 11 14 1 4 18 17 5 19 13 9 23 25 12 7 10 21 15 3 20 8 6 24 28 16 2 22 26 27 11 1 4 14 5 17 18 19 13
Table 5. Rankings of actors in List1 under different conditions
4.3. Experiments when outcomes are changed The goal of these experiments is to evaluate the ability of our OARA approach and SVD to take into account outcomes while ranking the actors. We conduct our experiment as follows. Let ∆ be the matrix constructed according to the method in Section 3.1.2. Let e be the vector of outcome values. We generate the OARA and SVD rankings under four different conditions as defined below: – R1 is the ranking by OARA(∆, e). Table 5 and Table 8 show the R1 ranking for both the list of actors. – R2 is the ranking by SVD(∆). – R3 is generated after making the following modifications to the original data. We pick two highly ranked actors in both the rankings, say A1 and A2 . For each of the movies in which either of them appears, we artificially reduce the averaging rating by 2. We then pick the two middle-ranked actors, A3 and A4 . We increase the ratings of those movies in which either of them appears by 2. Let ∆0 be the corresponding matrix. Note that e does not change. Let R3 be the ranking by OARA(∆0 , e). – R4 is the ranking obtained by SVD(∆0 ). For the rest of the experiments we use R1 , R2 , R3 , R4 to denote the rankings obtained by OARA and SVD by this process for the different lists and different es considered in the experiments. The different rankings obtained for List 1 are as in Table 5 (With A1 = 9, A2 = 23, A3 = 28, A4 = 16). The rankings are given in the ascending order of ranks; the actor with the first rank appears first and so on. We can check how the two methods dealt with changes in outcomes (refer Table 5). One would expect the rankings of A1 and A2 to go down and those A3 and A4 to go up. Notice (by comparing R1 and R3 ) that OARA rankings of the both top actors (number 23 and 9) have gone down while those of the two chosen mid-ranked actors A3 and A4 (number 28 and 16) have gone up. Notice (by comparing R2 and R4 ) that there is hardly a noticeable change in the SVD rankings before and after modification. This shows that our formulation is more sensitive to changes in outcomes.
4.4. Experiments for relative importance across time periods We conducted experiments to check if our approach can indicate relative influence of actors across time periods (Refer to Table 6). Since the List 2 involves mainly old actors, only movies up to 1980 are contained in their interaction networks. We consider two actors, Robert De Nero and Al Pacino who are present in both the lists. Since their interaction with the old actors is limited, they are ranked towards the end in List 2 whereas they are ranked high in List 1.
Outcome Aware Ranking in Value Creation Networks OARA(∆list1 , e) OARA(∆list , e) 2
14
21
23 9 25 12 10 7 21 15 3♣ 6 20 8 24 16 28 2♦ 22 26 27 11 1 4 14 18 5 17 19 13 17 12 24 30 19 28 16 20 15 18 22 10 11 25 2 21 6 13 4 29 23 14 8 7 9 5 1 3 27♣ 26♦
Table 6. Rankings of Al Pacino♦ and Robert de Niro R1 = OARA(∆, e) R3 = OARA(∆0 , e)
17 24 12 30 20 28 16 19 15 6 13 4 23 29 14 8 7 9 5 1 3 17 24 12 30 20 28 16 19 15 6 13 4 23 29 14 8 7 5 9 1 3
10 27 10 27
♣
in both the lists
22 18 25 11 2 21 26 18 22 21 25 2 11 26
Table 7. Rankings of actors in List2 generated for Case 1
4.5. Experimentation with e The vector of outcome values plays a crucial role in the ranking obtained by OARA. The use of negative utilities to increase the influence of outcomes in ranking was illustrated in Section 3.2.3. As an example of a setting with negative outcomes is IMDB where a user rating of 7 or below is treated as an indication of its failure and a rating above 7 is treated as an indication of its success. In such a case, it is meaningful to associate positive and negative weights with different outcomes. Below, we show how different ways of setting the vector e influences the rankings in the IMDB dataset. Case 1. When all outcomes are positive. In this case, every movie is treated as having a non-zero positive outcome. The value of a movie with rating R the outcome was set to be 2R . Refer to Table 7. Here, ranking R1 is the ranking on original data. Ranking R3 is obtained by reducing the outcomes of a subset of the movies of actors 17 and 24. In this case, although OARA shows changes in some of the connected actors like 21 and 11, it does not change the ranking of 17 and 24 themselves as they had other movies with high positive value and since the values of movies with reduced rating was still positive, they did not suffer in ranking (contrary to expectation). Case 2. When the outcomes are mixed. This is the most general case where the outcomes are treated as positive and negative. For example, a movie whose average rating is 5 is deemed a failure and thus having a negative outcome, and a movie with a rating of 8 is considered to be a positive outcome. Specifically, we set the weights for different outcomes as follows. If a movie has the corresponding rating R greater than 7 then the associated was 2R , else the outcome is −28−R . We repeated the experiment for Case 1 with this setting (Refer to Table 8). Observe that R1 and R3 were noticeably different. Note that relative ranks of 17 (A1 ) has dropped while that of 21 (A4 ) has improved. The reason for the stability of 24 in the ranking is his close collaboration with actors 2 and 11 with whom he has acted in 14 movies. Table 8 shows the ratings from experiment on List 2. Case 3. Vector e can be used to take into account any known special status of the agents themselves. In this case, the status of an actor may be enhanced due to an award or a rise in popularity. In this case, non-uniform setting of e[i] for nodes corresponding to agents to take this into account. Observe original ranking for List 2. Actors with indices 27 (Robert De Nero) and 26 (Al Pacino) are appearing towards end in R1 . If we now increase the importance of these two R1 = OARA(∆, e) R3 = OARA(∆0 , e)
17 11 15 18
24 12 30 28 19 16 20 15 10 22 18 25 2 21 6 13 4 23 29 14 8 7 9 5 1 3 27 26 24 30 20 21 10 16 17 25 12 28 19 22 2 11 6 13 4 14 29 5 23 8 1 27 9 7 26 3
Table 8. Rankings generated of actors in List2 for Case 2
22
Kameshwaran et al R1 = OARA(∆, e) R5 = OARA(∆, e0 )
17 11 27 19
24 12 30 28 19 16 20 15 10 22 18 25 2 21 6 13 4 23 29 14 8 7 9 5 1 3 27 26 26 24 25 20 17 28 30 16 15 10 12 22 2 14 29 18 6 4 11 21 13 1 8 23 7 9 5 3
Table 9. Rankings generated of actors in List2 for Case 3 actors (because of award winning performances) and keep the importance of rest of the actors uniform, then, we notice that not only these two actors, but, also those who interacted with them (like Marlon Brando) benefit in the ranking. The new ranking after changing importance of the two actors is denoted by R5 . Rankings are shown in Table 9.
4.6. Experiments on larger networks We extracted larger, connected networks consisting of 200 and 400 actors respectively. The fact that we used only the first few of the listed actors for each movie limited the size of the connected networks that we could detect. We use Kendall correlation to see how rankings are correlated (Refer to Section 3.2.2 for interpreting this measure) across different experiments. As before, we decrease the value of outcomes of two top actors and increase the outcome of two middle ranked actors. This process affects a large fraction of the nodes in the network because of the cascading effect of the co-actor network structure. As a result, the rankings of most actors are likely to see major shifts, and hence, the two rankings are likely to look almost unrelated. We notice that, for the OARA rankings, the Kendall correlation measure is close to zero and for the SVD rankings it is in the range of 0.6. These experiments provide important empirical evidence that our method accounts both the structure and the outcomes in its rankings; and, the SVD based approach is not as effective. Case 1. Network of 200 actors. τ (R1 , R3 ) = 0.007352 and τ (R2 , R4 ) = 0.68160 Case 2. Network of 400 actors. τ (R1 , R3 ) = 0.087 and τ (R2 , R4 ) = 0.6345 In the IMDB experiments, the outcome for each movie was measured by just one parameter: average user rating. Other possible parameters of the outcome, like awards (very few movies get awards) and earnings (details are not always available), are hard to determine. In the next section, we consider value creation networks in which more than one parameter of the outcome can be measured. Thus, rankings according to different parameters can be compared for consistency and reliability.
5. Experiments on Academic Collaboration Network In this section, we consider the problem of ranking authors in academic collaborations. Authors are the agents who collaborate to publish an article. The outcome of the interaction is the publication, while the value generated can be measured based on the prestige of the publication venue (impact factor of conference or journal) or on the impact of the publication itself (citation count). The relevant data for experiments are collected from DBLP, Citeseer, and Google Scholar. An article listed in the DBLP is treated as an interaction and the relevant information like authors (agents), year of publication, and the venue of publication (title of the conference/journal) are obtained. Two values associated with the publication are considered: venue impact factor and the citation count.
Outcome Aware Ranking in Value Creation Networks Venues VLDB CIKM SIGMOD Conference ICDE KDD SDM PODS EDBT EDBT Workshops
15
Impact Factor 0.1 0.05 0.12 0.06 0.06 0.02 0.12 0.06 0.07
23 Papers 550 293 481 468 314 78 152 128 45
Table 10. Venues considered in the academic collaboration dataset Venue impact factors of the relevant venues are obtained from Citeseer and the Google Scholar is used for citation count of the articles. We compute two different outcome aware rankings to further illustrate the applicability of OARA for ranking in value creation networks.
5.1. Experimental Setup The venue impact of the article can be ascertained at the time of publication based on the significance of the venue as established in the community. But, it takes significant time for the citation impact to be observed reliably. Often, some articles on seasonal hot topics may see an initial upsurge of citations compared to genuinely influential articles. However, the genuinely influential articles stand the test of time and emerge with significant citation impact over many years. The citation impact we get from the Google Scholar is as of current date. So, we do not consider papers that were published in recent years as their citation impact may undergo significant change in next few years. Hence articles that were published between 1999 and 2004 were only considered. As highlighted in the previous section, considering disconnected interaction networks does not give rise to meaningful results. Therefore, one needs to consider a well-connected community. To achieve this, we choose authors from articles appearing in long running conferences and journals in the area of databases and data mining, and selected the largest set of authors who form a connected component in the co-authorship network. The co-authorship network was constructed with 2509 articles (interactions) from 9 venues comprising of 2914 authors. Edge weight between any two authors denotes the number of papers they have co-authored.
5.2. Two Value Creation Networks From the above co-authorship network, two value creation networks are created: venue impact augmented network (VIAN) and and the citation impact augmented network (CIAN). A venue naturally corresponds to an outcome node with the impact factor as the utility. Table 10 lists the 9 venues, corresponding impact factors, and the number of papers from each of the venues in the dataset. VIAN is obtained by augmenting the M = 9 venues as outcome nodes with the coauthorship network consisting of N = 2509 authors. The citations are natural numbers and hence finite outcome nodes are obtained by creating intervals over the range of citation counts. Based on the frequency distribution of the papers with respect to the citation counts in the
24
Kameshwaran et al
+
1
0.8
+
0.6
+
Utility
+ 0.4
+ +
0.2
0+ 0
+ 1
+
+
+
+
+
+
+
+
2
3
4
5 6 7 8 9 10 25 50 75 100 > Citations (Hundreds)
Fig. 9. Utility for citations in 16 intervals (only the upper limit for each interval shown) dataset, 16 non-uniform intervals of citations are used as outcome nodes. To emphasize the relative contribution, marginally increasing utilities are assigned as shown in Figure 9. For brevity, only the closed upper limit for each interval is shown, while the open lower limit is naturally the upper limit of the previous interval. CIAN is created by augmenting M = 16 outcomes nodes to the co-authorship network consisting of N = 2509 authors. For both VIAN and CIAN, the edges from outcomes are augmented as follows: for every paper, add edges from the relevant outcome node to the authors of the paper with equally distributed edge weights. With the notation of Section 3.1.2, the weights of augmented edges for interaction Vt are: t δmi =
1 , ∀i ∈ Vt |Vt |
(24)
The total weight of an augmented edge is then the sum of the individual interaction weights: X t δmi = δmi (25) t
5.3. The α value The venue impact factor and the citation utilities are {ρ} for VIAN and CIAN, respectively. The external status vector e is constructed with the assignments (15) and (16). For VIAN, we used θ = 100 and for CIAN, θ = 10. Recall the {ρ}, e, and θ are free parameters and the ranking depends on the specific values
Outcome Aware Ranking in Value Creation Networks
16
25
0.82 0.8 ×
0.76 0.74
×
×
VIAN CIAN
+
×
0.78
τ
+ ×
×
+
× +
0.72 +
0.7 0.68
+
0.66 0.64
+ 0
0.002 0.004 0.006 0.008 0.01 0.012 0.014 0.016 0.018 α Fig. 10. Choice of α for VIAN and CIAN
0.75 ×
×
×
0.7
×
× ×
0.65 0.6
∗
0.55 τ
∗
∗
∗
∗ ∗ +
0.5 0.45 +
0.4 +
0.35
+
0.3 0.25
+ 0
+ 0.002 0.004 0.006 0.008 0.01 0.012 0.014 0.016 0.018 α
Fig. 11. VIAN ranking versus degree, eigen, V-outcome
+ × ∗
Eigen Degree V
26
Kameshwaran et al
1 ×
×
0.9
×
×
+ × ∗
×
0.8
Eigen Degree C
×
0.7 τ
0.6 0.5 +
0.4 0.3 ∗ + 0.2 0
+ ∗
+ ∗
+ ∗
+ ∗
∗
0.002 0.004 0.006 0.008 0.01 0.012 0.014 0.016 0.018 α Fig. 12. CIAN ranking versus degree, eigen, C-outcome
assigned. Hence the ranking results are to be interpreted with reference to the values the free parameters are assigned. To evaluate the another free parameter α, we use the heuristic outlined in Section 3.2.2. The parameter α reflects the relative importance of outcomes over structure: α− → 0 emphasizes outcomes and α+ → λ1 emphasizes structure of interactions. The largest eigen value for the co-authorship network is λ = 48.73, which is the same for the VIAN and CIAN (as outcome nodes have no incoming edges). The allowable range is thus α ∈ (0, 0.0205). The heuristic in Section 3.2.2 estimates the relative importance of α using Kendall correlation coefficient of rankings obtained with {ρ} and the reversed utilities {µ}. Figure 10 shows the Kendall τ values for both VIAN and CIAN. The τ steadily increase towards 1 (strong positive correlation) as α+ → λ1 . However, as α− → 0, both VIAN and CIAN exhibit a high positive correlation of 0.74 and 0.64, respectively. Thus the constructed networks and the e inherently favor structure over the outcomes.
5.4. VIAN and CIAN versus other ranking techniques Section 2 outlined the limitations of SNA ranking techniques for value creation networks. We show here the correlation between rankings obtained by VIAN and CIAN with that of degree, eigen, and outcome based ranking. Recall that degree ranking is based on degree count of authors, which quantifies the number of collaborations (by construction of co-authorship network, an article with 4 authors will increase the number of collaborations by 3 for each of the authors). Eigen based ranking reflects the structural importance. As the co-authorship network is connected with positive undirected edges (the adjacency matrix is positive and symmetric), the eigen ranking is similar to that of PageRank. Both
Outcome Aware Ranking in Value Creation Networks VIAN Rank (1) Divesh Srivastava (2) Surajit Chaudhuri (3) Jiawei Han (4) Philip S. Yu (5) Nick Koudas (6) Christos Faloutsos (7) H. V. Jagadish (8) Rakesh Agrawal (9) Joseph M. Hellerstein (10) Charu C. Aggarwal
CIAN Rank (1) (6) (2) (3) (4) (9) (5) (18) (25) (63)
Degree (Rank) 146 (1) 93 (6) 131 (2) 104 (3) 100 (4) 83 (10) 96 (5) 71 (20) 61 (26) 38 (71)
17
Eigen Rank (1) (54) (21) (50) (2) (58) (3) (150) (758) (87)
27 V -Outcome (Rank) 128.24 (2) 142.26 (1) 100.94 (6) 96.65 (10) 95.49 (11) 104.61 (5) 79.42 (19) 98.61 (8) 106.4 (4) 127.4 (3)
C-Outcome (Rank) 3.88 (13) 3.14 (29) 5.03 (7) 3.42 (23) 3.72 (18) 2.98 (31) 3.05 (30) 5.46 (5) 4.62 (9) 3.63 (20)
Table 11. Top 10 ranks from venue augmented interaction network (VIAN) and the respective ranks from other techniques CIAN Rank (1) Divesh Srivastava (2) Jiawei Han (3) Philip S. Yu (4) Nick Koudas (5) H. V. Jagadish (6) Surajit Chaudhuri (7) Beng Chin Ooi (8) Divyakant Agrawal (9) Christos Faloutsos (10) V. S. Lakshmanan
VIAN Rank (1) (3) (4) (5) (7) (2) (16) (18) (6) (11)
Degree (Rank) 146 (1) 131 (2) 104 (3) 100 (4) 96 (5) 93 (6) 88 (7) 88 (7) 83 (10) 84 (9)
Eigen Rank (1) (21) (50) (2) (3) (54) (13) (919) (58) (4)
V -Outcome (Rank) 128.24 (2) 100.94 (6) 96.65 (10) 95.49 (11) 79.42 (19) 142.26 (1) 64.91 (29) 63.2 (30) 104.61 (5) 79.86 (18)
C-Outcome (Rank) 3.88 (13) 5.03 (7) 3.42 (23) 3.72 (18) 3.05 (30) 3.14 (29) 1.6 (69) 1.24 (97) 2.98 (31) 1.41 (82)
Table 12. Top 10 ranks from citation augmented interaction network (CIAN) and the respective ranks from other techniques
the eigen and degree based ranks are independent of outcomes. The outcome based ranking is purely based on outcomes and the score P is measured as the weighted sum of the outcome values: score for agent i = m δmi θρm . Thus we have two outcome based rankings: V-Outcome for venue impact based ranking and C-Outcome for citation based ranking. Figure 11 and 12 shows the correlations of VIAN and CIAN rankings with that of the degree, eigen, and outcome. As expected, the τ increases for eigen as α+ → λ1 for both VIAN and CIAN. The degree and outcome based rankings show opposite trend indicating the influence of outcome values in the VIAN and CIAN rankings. As shown in Figure 10, the relative influence of outcomes over the structure is limited and hence the positive correlations with other ranks for all α values. Though the results shown in figures 11 and 12 are for specific values of {ρ} and e, one can expect similar trends in τ for other values of {ρ} and e (even though the specific τ values may change). The figures also illustrate the trade-off handled between structure (eigen) and outcome by OARA ranking. To further illustrate the application of OARA, the top 10 authors and their scores and ranks from other techniques are shown in tables 11 and 12. VIAN and CIAN share seven authors among the top 10. The CIAN and VIAN ranks shown in the tables are for α = 0.001. We have chosen a low α value to allow for maximal inclusion of outcomes in the ranking. The scores for eigen, CIAN, and VIAN rankings are not shown as their numeric values cannot be meaningfully interpreted (except that a higher score induces a higher rank). The scores for
28
Kameshwaran et al
degree are shown. Recall that degree score for agent i P and outcome based rankingP is j δij and that for outcome is m δmi θρm . The numbers in tables 11 and 12 show that CIAN and VIAN rankings balances the ranks of eigen and outcomes. One can also infer the irrelevance of popular eigen or PageRank techniques for value creation networks, as many authors shown are low ranked in pure structure based rankings.
6. Experiments on Simulations of Service Delivery This research was conducted for the application of ranking agents in a service delivery setting. Although we are not able to share results on the actual data, we present results on data obtained from a service delivery simulator that we developed. Our simulator captures various real-life, people-centric aspects of service delivery that we observed in practice: a. compatibility and incompatibilities between people within team settings and their effect on the outcomes b. transient slackness in performance of people due to repetitive nature of tasks in service delivery c. performance aspects such as ramp-up curve when people begin their work. Here, we briefly discuss our experiments with the simulator. Our simulator created an environment of 500 agents. Associated with each agent was a list of compatible and incompatible agents, apart from individual level of competency. We generated a time-series of requests tagged by types. We used the types of the recent requests performed by an agent to measure his likelihood of slackening. For a given request, we picked agents so as to balance load (a common practice in service delivery). For each assignment of agents, we computed a likely-outcome that takes into account: their individuals levels of competency, their affinity for slackening, and basic compatibility index between them as a team. We repeated the experiments carried out in Section 4.6 on the simulated data. With the usual meanings of rankings R1 , R2 , R3 , R4 , over multiple runs, we found that τ (R1 , R3 ) ≈ 0.30 and τ (R2 , R4 ) ≈ 0.75. Note that the Kendall measure between R1 and R3 in case of simulation is much higher than those obtained in Section 4.6. This could be because, the outcomes are computed by a method which combines the parameters of the simulation in a predictable manner whereas the outcomes of the movies do not necessarily follow any predictable model.
7. Discussion and Conclusions The main goal of our work is to highlight the importance of outcome aware ranking in value creation networks and develop a ranking technique that indeed takes into account the value created in addition to interactions. The main ingredients of the proposed technique are (i) augmenting the interaction networks with outcomes, (ii) a novel twist to the eigen-vector based methods which tries to transfer the utility of the outcomes to the participants of the interaction, and (iii) an intuitive practical technique to measure the trade-off of influence of outcomes versus that of interactions in final ranking. We demonstrated that our technique is sensitive to changes in both structural and outcome aspects of the value creation networks. There are several directions for future work. Measuring the qualitative performance of the proposed ranking technique is an important problem. We have established through thorough experiments
Outcome Aware Ranking in Value Creation Networks
18
29
that the popular existing techniques do not suffice for value creation networks and the proposed outcome aware ranking is clearly an implementable solution. As there is no other algorithm for value creation networks (to our knowledge), we have conducted experiments on popular domains such as movies and author collaboration networks where the quality can be intuitively verified. Also the judiciously constructed example of star interaction network (Figure 5) served as a verifiable small data to examine the workings of the algorithm. One of the approaches to ascertain the quality of the rankings is to compare the ranking against a ground-truth ranking provided by experts. In (Richardson, Prakash and Brill, 2006), ranking algorithms were compared for a set of 28000 queries, which had expert human judgments. Each query had an average of 18 human ratings, which were used to manually adjudicate the quality of the search results of the different ranking algorithms. Note that our formulation requires human intervention in identifying the outcome values e, utilities {ρ}, and the parameter α. We discussed in detail the influence of choice of the above parameters on the final ranking. This further compounds the problem of using human experts requiring common agreement and understanding on using the same set of parameters. Identifying qualitative measures and creating benchmark datasets for value creation networks is an important research problem in order compare outcome aware ranking algorithms. There are other ways of modifying the interaction networks that take the outcomes into account. (i) Rank aggregation: Create two different rankings based on interactions and outcome, respectively. The two rankings can then be combined using rank aggregation techniques. (ii) Multi-attribute edges: Create a interaction network with the weight on a edge as a multi-attribute utility, which is a function of both past interactions and value generated. Eigenvector techniques can be used to identify the ranks on the resulting weighted graph. Further investigation is required to evaluate the feasibility and usability of the above techniques. From a computational point of view, the need to invert a matrix is the most challenging task of this approach. To make this scale to massive graphs, we need to develop a heuristic which approximates the matrix computation in the same sense as power method does for eigenvector computation. Certain structural properties of the matrices can be exploited to speed up the computation of the inverse, as shown in (Tong, Faloutsos and Pan, 2008). But, this requires that the matrix is such that decomposition technique like Sherman-Morrison Lemma (Sherman and Morrison, 1950) can be applied. To the best of our knowledge, such a technique cannot be applied directly in our setting. Adapting our technique so as to exploit Sherman-Morrison lemma is an interesting future direction of work. Another potential area of future work is to apply the notion of outcome aware ranking to applications highlighted in the introduction such as viral marketing, analyses for understanding teaming tendencies of a workforce, and effective and efficient spreading of messages in a network.
References Asur, S., Parthasarathy, S. and Ucar, D. (2007), An event-based framework for characterizing the evolutionary behavior of interaction graphs, in ‘KDD’, pp. 913–921. Bonacich, P. and Lloyd, P. (2001), ‘Eigenvector-like measures of centrality for asymmetric relations’, Social Networks 23, 191–201. Chitrapura, K. P. and Kashyap, S. R. (2004), Node ranking in labeled directed graphs, in ‘CIKM’, pp. 597–606.
30
Kameshwaran et al
DeLong, C., Mane, S. and Srivastava, J. (2006), Concept-aware ranking: Teaching an old graph new moves, in ‘ICDM Workshops’, pp. 80–88. Domingos, P. (2005), ‘Mining social networks for viral marketing’, IEEE Intelligent Systems 20(1), 80–82. Haveliwala, T. H. (2002), Topic-sensitive page rank, in ‘In the proceedings of the World Wide Web (WWW) Conference’, pp. 517–526. Kameshwaran, S., Mehta, S. and Pandit, V. (2011), Design and analysis of value creation networks., in W. Burgard and D. Roth, eds, ‘AAAI’, AAAI Press. Kameshwaran, S., Mehta, S., Pandit, V., Parija, G., Singh, S. and Viswanadham, N. (2009), Analyses for service interaction networks with applications to service delivery, in ‘the Proceedings of SIAM International Conference on Data Mining (SDM)’. Kameshwaran, S., Pandit, V., Mehta, S., Viswanadham, N. and Dixit, K. (2010), Outcome aware ranking in interaction networks, in ‘Proceedings of the 19th ACM Conference on Information and Knowledge Management, CIKM 2010’, pp. 229–238. Kempe, D., Kleinberg, J. and Tardos, E. (2003), Maximizing the spread of influence through a social network, in ‘Proceedings of the ninth ACM SIGKDD international conference on Knowledge discovery and data mining’, KDD ’03, ACM, New York, NY, USA, pp. 137–146. Kendall, M. G. (1955), ‘Further contributions to the theory of paired comparisons’, Biometrics 11, 43. Kleinberg, J. M. (1999), ‘Authoritative sources in a hyperlinked environment’, J. ACM 46(5), 604–632. Liu, X., Bollen, J., Nelson, M. L. and de Sompel, H. V. (2005), ‘Co-authorship networks in the digital library research community’, Information Processing and Management 41, 1462– 1480. Newman, M. (2001a), ‘Scientific collaboration networks: I. Network construction and fundamental results’, Physical Review 64. Newman, M. (2001b), ‘Scientific collaboration networks: II. Shortest paths, weighted networks, and centrality’, Physical Review 64. Page, L., Brin, S., Motwani, R. and Winograd, T. (1998), ‘The pagerank citation ranking: Bringing order to the web’. Richardson, M., Prakash, A. and Brill, E. (2006), Beyond PageRank: Machine learning for static ranking, in ‘Proceedings of the 15th international conference on World Wide Web’, WWW ’06, ACM, New York, NY, USA, pp. 707–715. Saito, K., Kimura, M., Ohara, K. and Motoda, H. (2012), ‘Efficient discovery of influential nodes for SIS models in social networks’, Knowledge and Information Systems 30(3), 613– 635. Sherman, J. and Morrison, W. J. (1950), ‘Adjustment of an inverse matrix corresponding to a change in one element of a given matrix’, The Annals of Mathematical Statistics 21(1), 124–127. Subramani, M. and Rajagopalachari, B. (2003), ‘Knowledge-sharing and influence in the online social networks via viral marketing’, Communications of the ACM 46(12), 300–308. Tong, H., Faloutsos, C. and Pan, J.-Y. (2008), ‘Random walk with restart: fast solutions and applications’, Knowledge and Information Systems 14(3), 327–346. Wei, T. H. (1952), The algebraic foundations of ranking theory, Cambridge University Press, London. White, S. and Smyth, P. (2003), Algorithms for estimating the relative importance in networks, in ‘Proceedings of the ACM SIGKDD International Conference on Knowledge Discovery and Data Mining’, pp. 266–275.
Outcome Aware Ranking in Value Creation Networks
19
31
Author Biographies Kameshwaran received his PhD in Computer Science from the Indian Institute of Science, Bangalore in 2004. Prior to joining IBM India Research Labs, he had worked at The Logistics Institute - Asia Pacific (Singapore), INRIA Grand Est (France), and the Indian School of Business (India). His research interests include mathematical programming, optimization, and data mining. He can be reached at
[email protected].
Vinayaka Pandit obtained his PhD in Computer Science from IITDelhi. His main area of research is in algorithm design, combinatorial optimisation, and their applications to practical problem solving. He has applied insights from his background to present theoretical understanding of practical problems like construction of decision trees from data and sampling techniques for data mining problems. He is currently a research staff member at IBM India Research Labs. He can be reached at
[email protected].
Dr Sameep Mehta is a researcher in IBM India Research Labs since 2006. He finished his MS and PhD from The Ohio State University in 2005 and 2006 respectively. His current research interest include Data Mining, Text Mining, Social Network Analysis, Workforce Optimization and Service Science. Dr Mehta has published multiple paper in leading conferences. He can be reached at
[email protected].
Ambika Agarwal obtained her Masters in Computer Science from IIT Bombay with specialization in compiler and algorithmic optimizations. Her research interests are in algorithms, data mining, machine learning, and web mining. This work was done when she was working with IBM India Research Lab. Currently she works for an Internetrelated product and services company. Ambika can be reached at
[email protected].
Kashyap Dixit obtained her Masters in Computer Science from IIT Kanpur. This work was done when he was working with IBM India Research Lab. Currently he is a graduate student in the department of Computer Science at the Pennsylvania State University. He can be reached at
[email protected].
32
Kameshwaran et al
Correspondence and offprint requests to: S Kameshwaran, IBM Research - India, Bangalore. Email:
[email protected]