Outflows in ρ Ophiuchi as Seen with the Spitzer Infrared Array Camera
arXiv:0910.0540v2 [astro-ph.SR] 15 Oct 2009
Miaomiao Zhang and Hongchi Wang Purple Mountain Observatory, Chinese Academy of Sciences, Nanjing 210008, PR China
[email protected] ABSTRACT Using the IRAC images from the Spitzer c2d program, we have made a survey of mid-infrared outflows in the ρ Ophiuchi molecular cloud. Extended objects that have prominent emission in IRAC channel 2 (4.5 µm) compared to IRAC channel 1 (3.6 µm) and stand out as green objects in the three-color images (3.6 µm in blue, 4.5 µm in green, 8.0 µm in red) are identified as mid-infrared outflows. As a result, we detected 13 new outflows in the ρ Ophiuchi molecular cloud that have not been previously observed in optical or near-infrared. In addition, at the positions of previously observed HH objects or near-infrared emission, we detected 31 mid-infrared outflows, among which seven correspond to previously observed HH objects and 30 to near-infrared emission. Most of the mid-infrared outflows detected in the ρ Ophiuchi cloud are concentrated in the L1688 dense core region. In combination with the survey results for Young Stellar Objects (YSOs) and millimeter and sub-millimeter sources, the distribution of mid-infrared outflows in the ρ Ophiuchi molecular complex hints a propagation of star formation in the cloud in the direction from the northwest to the southeast as suggested by previous studies of the region. Subject headings: infrared: ISM — infrared: stars — ISM: individual (ρ Ophiuchi) — ISM: jets and outflows — stars: formation
1.
Introduction
Mass outflows play an essential role in the process of star formation and have been found to be ubiquitous in various stages of star formation (Arce et al. 2007; Bally et al. 2007). The specific angular momentum of a star-forming molecular core is about four orders of magnitude times higher than that of a typical T Tauri star (Bodenheimer 1995). One way to transfer the
–2– excessive angular momentum from the star-forming cores so that the circumstellar material can be accreted onto the central stars is through mass outflows (Shang et al. 2007). Mass outflows from YSOs have been observed at different wavelengths. In the visual, high velocity jets and HH objects with a typical velocity of 100 - 300 km s−1 trace material ejected by the star or shocked surrounding medium (Reipurth & Bally 2001). Near-infrared molecular hydrogen emission features, which usually have velocities of several tens km s−1 , trace H2 gas in the jets or in the entrained surrounding medium (Eisl¨offel et al. 2000). In the millimeter wavelength, high velocity CO gas with velocity in the range from a few to ten km s−1 have been observed (Wu et al. 2004). The high velocity CO gas probes the swept or entrained medium. The different velocity ranges and excitation conditions for HH objects, near-infrared molecular hydrogen emission, and CO outflows indicate the transfer of energy and momentum from the high velocity material to the surrounding medium. Shocked gas in outflows has abundant atomic and molecular hydrogen line emission in the mid-infrared. Hydrodynamic simulations of outflows from YSOs by Smith & Rosen (2005) have shown that outflows have strong H2 line emission in all the IRAC four bands. In fact, mid-infrared observations with IRAC aboard of Spitzer have discovered a lot of new outflows (Mer´ın et al. 2008) and plenty new features of previously known outflows (Noriega-Crespo et al. 2004; Smith et al. 2006; Teixeira et al. 2008), showing that Spitzer IRAC imaging is a powerful tool in the survey of outflows, particular for those that are deeply embedded in clouds due to the much less extinction in the mid-infrared compared to the optical and near-infrared wavelengths. The Spitzer legacy program c2d performed a complete imaging of five nearby star-forming regions with the IRAC and MIPS instruments (Evans et al. 2003, 2009), which provides a valuable data set to search for mid-infrared outflows in these regions. In this paper we present the results of a mid-infrared outflow survey of the ρ Ophiuchi molecular cloud based on the c2d archive images. The ρ Ophiuchi molecular cloud is one of the closest star-forming regions at a distance of about 130 pc (Wilking et al. 2008). It is intermediate in star formation activity compared to the isolated star formation in the Taurus cloud and the rich clusters in the Orion cloud. The large scale structure of the ρ Ophiuchi cloud has been revealed by extensive molecular 13 CO line mapping (Loren 1989a,b). Millimeter and submillimeter surveys of the central part of the cloud have revealed the clumpy structure of the cloud and have found about 55 starless cores with masses in the range of 0.02 to 6.3 M⊙ (Motte et al. 1998; Johnstone et al. 2000; Young et al. 2006). The cloud has been surveyed for young stars at wavelengths from Xray (Montmerle et al. 1983; Imanishi et al. 2001; Ozawa et al. 2005), visual (Wilking et al. 1987, 2005), near-infrared (Greene & Young 1992; Allen et al. 2002), mid- and far-infrared (Young et al. 1986; Wilking et al. 2001; Padgett et al. 2008), to millimeter and submillimeter (Stanke et al. 2006; Andrews & Williams 2007). Based on these surveys, Wilking et al.
–3– (2008) compiled a list of 316 young stars in L1688, the main cloud of the ρ Ophiuchi complex. About 46 HH objects (Wilking et al. 1997; Wu et al. 2002; Phelps & Barsony 2004), 119 H2 emission features (Grosso et al. 2001; G´omez et al. 2003; Khanzadyan et al. 2004), 16 high velocity CO outflows (Bontemps 1996; Bussmann et al. 2007) have been observed in the ρ Ophiuchi complex. For a summary of the ρ Ophiuchi complex we refer to the recent review by Wilking et al. (2008)
2. 2.1.
The Data
The Spitzer Data
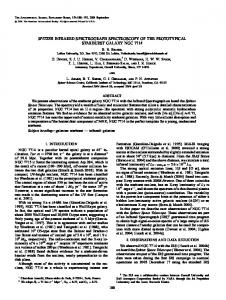
The IRAC observations of ρ Ophiuchi were conducted on 2004 March 28-30 and 2005 September 15 and 18. These observations are part of the Spitzer legacy program c2d (Evans et al. 2003) and the program ID is 177. Fig. 1 shows the three-color image of the area mapped with IRAC which is about 8.0 deg2 . This area is included in the region mapped with MIPS (see Fig.1 of Padgett et al. 2008). Each region in Fig. 1 was individually mapped in two epochs with an exposure time of 12 seconds (24 seconds in total) and one map was made in the high dynamic range (HDR) mode, which added a short exposure time of 0.6 seconds (Evans et al. 2003). Six off-cloud fields were observed in order to sample the background source counts. We used the final mosaic images and source catalogs of the fourth delivery of IRAC and MIPS data. The data were processed with Spitzer Science Center pipeline S13 and calibrated by c2d team (details can be found in the Delivery Document1 ). In the final mosaic images bright source artifacts have been removed. However, some instrumental effects still survive. For example, optical ghosts produced by internal reflections within the filters (labelled with “gh” in the subsequent figures) and stray lights produced by illuminating sources off the edges of the detector arrays (labelled in the subsequent figures with “Stray light”) remain in the final mosaic images (see the IRAC data handbook2 for details). A catalog of young stellar object candidates in the ρ Ophiuchi, YSOc, is also delivered by the c2d team. Evans et al. (2009) improved over this catalog. They removed some suspect sources, added known sources and data obtained at other wavelengths, and calculated additional quantities such as bolometric temperature and bolometric luminosity. Their list 1
http://data.spitzer.caltech.edu/popular/c2d/20071101 enhanced v1/Documents/ c2d del document.pdf 2
http://ssc.spitzer.caltech.edu/irac/dh/iracdatahandbook3.0.pdf
–4– makes a relatively pure YSO candidate sample which includes 292 YSOs. We used their list of YSOs in this paper. Two schemes for YSO classification were used in Evans et al. (2009). One is the spectral index that was obtained using a least-squares fit to all photometry between 2 µm and 24 µm, and the criteria for classification are from Greene et al. (1994). The other scheme used the calculation of bolometric temperature (Chen et al. 1995; Dunham et al. 2008). Using the calculated spectral indices or bolometric temperatures, 292 YSOs in the cloud can be classified into 4 classes: 27 in Class I or Class 0, 44 in the flatspectrum Class, 179 in Class II, and 42 in Class III. Note especially that there are three Class 0 sources in Ophiuchus, IRAS 16293-2422, MMS 126, and VLA 1623-243, which were distinguished from Class I sources on the basis of their bolometric temperatures.
2.2.
The FCRAO Data
To analyze the distribution of detected outflows in the ρ Ophiuchi molecular complex, we used the 13 CO 1-0 (110.201GHz) emission data from the FCRAO 14 m telescope at New Salem, MA, U.S.A. The data were obtained during 2002-2005 with the On-the-Fly (OTF) mapping method (Ridge et al. 2006) and are part of the COMPLETE3 survey of star-forming regions. These 13 CO observations cover 10.0 deg2 of the ρ Ophiuchi molecular complex and the FCRAO Half Power Beam Width (HPBW) measures 44′′ . The 13 CO integrated intensity maps that have been re-gridded to 23′′ were used. In our 13 CO emission contour maps, the units of integrated intensity is antenna temperature (T∗A ) in Kelvin.
2.3.
Identification of IRAC Mid-infrared Outflows
IRAC channels cover a relatively broad wavelength range from 3.6 µm to 8.0 µm. In this wavelength range there are many H2 lines and atomic and ionic fine-structure lines. Rosenthal et al. (2000) have shown near- and mid-infrared spectra of the brightest H2 emission peak of the Orion OMC-1 outflow which are taken with ISO-SWS. The spectra revealed a wealth of molecular lines of H2 , CO, and H2 O, and a number of H I recombination lines, atomic and ionic fine-structure lines. The IRAC 4.5 µm band contains strong H2 lines (v = 0 − 0, S(9, 10, 11)) and CO bandheads (v = 1 − 0) (Reach et al. 2006). Like the near-infrared H2 emission at 2.12 µm, the emission of these lines can be excited by the interaction of protostellar outflows with the ambient medium. Smith & Rosen (2005) presented synthetic Spitzer IRAC band maps from hydrodynamic simulations of processing protostellar 3
http://cfa-www.harvard.edu/COMPLETE
–5– jets and they predicted that the integrated H2 line luminosity is greatest in IRAC band 2 (4.5µm), about an order of magnitude higher than those in other IRAC bands (see Table 3 in Smith & Rosen 2005). Observations by Spitzer IRAC have in general confirmed this prediction (Noriega-Crespo et al. 2004; Jørgensen et al. 2006). According to Noriega-Crespo et al. (2004), the remaining emission in the Spitzer IRAC band 2 image after the subtraction of the emission in band 1 is mainly from shocked H2 and CO gas. Using the three-color images constructed from IRAC bands 1, 2, and 4., Cyganowski et al. (2008) compiled a catalog of outflow candidates with the Spitzer Galactic Legacy Infrared Mid-Plane Survey Extraordinaire (GLIMPSE) data. They identified the Extended Green Objects (EGOs) in the three-color images as outflow candidates. In this paper, we use the difference image constructed from IRAC channel 2 (4.5 µm) minus channel 1 (3.6 µm) to search for mid-infrared outflows. We use the three-color (3.6 µm in blue, 4.5 µm in green, 8.0 µm in red) images to confirm that the identified outflows are EGOs. Images covering the common sky area of the ρ Ophiuchi cloud in the four IRAC bands were trimmed from the downloaded c2d archive mosaic images. The trimmed images were then rotated so that the image north direction is top and the east is to the left. For the subtraction of emission in band 1 from that in band 2, we selected 80 bright stars in the images that are roughly evenly distributed over the sky and are not saturated in either band 1 or band 2. The average flux ratio in band 1 to band 2 of these 80 stars is used to adjust the flux level of stars in band 1 to that in band 2. The resultant difference images were visually inspected to search for mid-infrared outflows. We selected extended sources that have significant excess at 4.5µm as mid-infrared outflows. Toward the core of L1688, several surveys for HH objects and H2 emission have been carried out (Wu et al. 2002; G´omez et al. 2003; Khanzadyan et al. 2004) and 46 HH objects, including components of HH objects, and 119 H2 emission features have been reported. We examined whether there are mid-infrared counterparts of these HH objects and H2 emission features at their corresponding positions in the IRAC images.
3.
Results
We discovered 13 IRAC mid-infrared outflows. Their coordinates and figure reference are list in Table 1. The likely exciting sources for these outflows and their Lada classes are given in Table 2. Note that IRAS 16293-2422 is classified as a Class 0 source based on its bolometric temperature (Evans et al. 2009). We also identified 31 mid-infrared counterparts of previously known HH objects and H2 2.12 µm emission features. The coordinates of these mid-infrared counterparts of the previously known outflows, together with the corresponding
–6– HH objects and H2 2.12 µm emission features, are presented in Table 3. In this paper we designate all the detected IRAC mid-infrared outflows as EGOs. The EGOs are numbered by order in right ascension. If the overall morphology of a group of knots suggests physical association among them, the knots are considered as parts of one EGO and the individual knots are distinguished with additional letters to the EGO numbers. On the other hand, if the knots in a region are relatively separated from each other and the relationship among them is not clear, each knot is treated as an individual EGO. Apparent sub-structures in a knot are labelled with additional numerals, such as EGO 21b1. The locations of all the mid-infrared outflows identified in the ρ Ophiuchi cloud are shown in Fig. 2. The grey scale image in Fig. 2 is the IRAC channel 2 (4.5 µm) image. The outflows newly discovered in this work are marked with circles and the counterparts of known flows are labelled with pluses. Two YSO aggregates in the region, L1689- and L1709aggregate (Padgett et al. 2008), are marked with open squares. The identified mid-infrared outflows are located mainly in three regions, i.e., the L1688 core, the IRAS 16293-2422 region, and the L1709 YSO aggregate region. The images of the newly discovered IRAC mid-infrared outflows are shown in Figs. 3-17, and the images of mid-infrared counterparts of HH objects and H2 emission features are presented in Figs. 18-40.
3.1.
New IRAC Mid-infrared Outflows
Thirteen new mid-infrared outflows have been discovered in our survey. For each midinfrared outflow, we present the channel 2 (4.5 µm) minus 1 (3.6 µm) image and the threecolor image. Figures 3-4 show the region of objects EGO 04 and EGO 12. The distance between the two objects is about 3′ . Each object consists of two knots. EGO 04 and EGO 12 are only detected in IRAC channels 1 (3.6 µm) and 2 (4.5 µm). It is brighter in channel 2 (4.5 µm), therefore, appears as an EGO in the three-color image (Fig. 4). There are three YSOs to the southeast of EGO 04 and EGO 12, among which we suggest BKLT J162624-241616 (Class II in Evans et al. 2009) as the exciting source of the EGO 04 and EGO 12 outflow, as this source is also detected in the MIPS 24 µm image. The distance from BKLT J162624-241616 to EGO 04 is 4.′ 7 and the distance to EGO 12 is 1.′ 8. Outflow EGO 33 (Figs. 5 and 6) is a diffuse nebula and is visible in IRAC channels 2 (4.5 µm), 3 (5.8 µm), and 4 (8.0 µm). Mid-infrared counterparts of the known nearinfrared outflow in this region, three H2 emission features in Khanzadyan et al. (2004), are also detected in the IRAC images. We designated these mid-infrared counterparts as EGO
–7– 34a-c (see Table 3). EGO 33 appears green and yellow in the three-color image (Fig. 6), which indicates that EGO 33 may have some emission from dust or PAH. There are two YSOs in this region, MMS126 (Class 0 in Stanke et al. 2006) and BKLT J162816-243657 (Class II in Evans et al. 2009). BKLT J162816-243657 is associated with 1.3 mm and midinfrared emission (Andr´e & Montmerle 1994; Greene et al. 1994). These YSOs are visible in all IRAC four channels and in the MIPS 24 µm image. We suggest BKLT J162816-243657 as the driving source of EGO 33 on the basis that MMS126 has close association with the known outflow detected in near-infrared and in CO (3-2) emission (Stanke et al. 2006). EGO 33 is unlikely to be associated with MMS 126 because EGO 33 is not coincident with the axis of the known CO outflow. The distance from BKLT J162816-243657 to EGO 33 is about 1.′ 9. Both EGO 35 and EGO 36 are complexes of emission filaments ( Figs. 7 and 8). Their components are list in Table 1. EGOs 35 and 36 are visible in IRAC channels 1-3 and are brightest in channel 2 (4.5 µm). The nearby YSOs are shown in Fig. 9. BKLT J162908241549 (Class II in Evans et al. 2009) is the nearest YSO to EGOs 35 and 36. However, the driving source of EGOs 35 and 36 should be located in the direction of the line connecting EGOs 35 and 36 if there is some association between EGOs 35 and 36. Other YSOs in this region are located to the northeast or southwest of EGOs 35 and 36, all roughly aligned with EGOs 35 and 36. The morphology of EGO 35 and EGO 36 is bow-shock-like, with wings extending to the southwest, which suggests that the outflow source should be located to the southwest. HH 677 is about 30′′ to the northeast of SR 10 and it may be driven by this source (G´omez et al. 2003). We can see that EGOs 35 and 36 and HH 677 are roughly located on a line. Therefore, it is possible that they are physically associated. EGOs 37-40 are located in the L1709 YSO aggregate (Padgett et al. 2008) (Figs. 1011). EGO 37 is a faint knot and EGO 38 is a faint bow structure and they may have some connection. They are visible in IRAC channels 1 and 2. GWAYL 4, a low-luminosity class I source in Greene et al. (1994) and classified as a flat spectrum source in Evans et al. (2009), is located in the northeastern prolongation of the EGOs 37-38 outflow. The distance from GWAYL 4 to EGO 37 and EGO 38 is about 3.′ 6 and 2.′ 6, respectively. On the basis of the alignment we suggest GWAYL 4 as the exciting source of EGOs 37 and 38. EGOs 39 and 40 are located to the southeast and east of YSO L1709-3, a flat-spectrum source in Evans et al. (2009). EGO 39 and EGO 40 are visible in all IRAC four channels and EGO 39 is also visible in the MIPS 24 µm image. The L1709 YSO aggregate is a small cluster of six YSOs and it is difficult at present to identify which YSOs in this cluster as the exciting sources of EGO 39 and EGO 40. EGO 41 consists of a series of knots, EGO 41a-i, and EGO 42 is a relatively isolated
–8– patch (Fig. 12). Knots EGO 41a-i constitute a bowlike structure facing to northeast. The bowlike structure is visible in all IRAC four channels while EGO 42 is only visible in IRAC channel 2. The symmetry axis of the bowlike structure suggests that the driving source for EGO 41 is located in the NE-SW direction. SSTc2d J163145.81-243909.0, a Class II source (Evans et al. 2009), is located about 8 ′ to the southwest of EGO 41 (see Fig. 2). This source is a possible driving source of EGO 41. EGO 41 is located about 5.′ 2 to the southwest of the Class 0 object IRAS 162932422 (Evans et al. 2009) which drives two molecular outflows, one in the east-west direction and another one in the NE-SW direction (Wootten & Loren 1987; Castets et al. 2001; Hirano et al. 2001; Lis et al. 2002; Stark et al. 2004). The IRAS 16293-2422 E-W molecular outflow also has its spectacular demonstration in the mid-infrared which is designated as EGO 43 and, together with EGOs 41 and 42, is shown in Fig. 13. The scale of the EGO 43 outflow measures about 11′ . It consists of four main portions, EGO 43 A-D. The details of the inner portions A-B and the outer portions C-D of this outflow are shown in Figs. 14 and 15, respectively. IRAS 16293-2422 is a binary with components A and B (Mundy et al. 1992) and their positions are marked in Fig. 14 with pentagrams. IRAS 16293-2422 is visible in the MIPS 24 µm image and invisible in the IRAC images. In Fig. 14, the position of the submillimeter source IRAS 16293E (Nutter et al. 2006), 90′′ to the southeast of IRAS 16293-2422, is also marked. From Fig. 13 we can see that the symmetry axis of the EGO 41 bowlike structure goes through EGO 42 and IRAS 16293-2422. This axis coincides well with the axis of the IRAS 16293-2422 NE-SW molecular outflow (see Fig. 12 in Lis et al. 2002 ), suggesting that EGOs 41 and 42 may have physical association with this molecular outflow which is attributed to the A component of IRAS 16293-2422 (Stark et al. 2004). We note that the EGO 41 bow shock points to source IRAS 16293-2422. This morphology usually suggests that the driving source is located on the direction opposite to IRAS 16293-2422. However, bow shocks are not always in a configuration of facing away from their driving sources. For example, the HH 311 bow shock (Reipurth et al. 1997) and the southeastern bow shock of the V380 Ori-NE flow (Davis et al. 2000) are in a configuration facing toward their exciting sources. This configuration can be understood if the flow impacts a dense, ambient clump, around which shocked gas is streaming (Davis et al. 2000). So it is also possible that EGO 41 is associated with IRAS 16293-2422. EGO 44 is a bow shock in the IRAC channel 2 minus channel 1 image (Fig. 16). It is visible in all the IRAC channels and Fig. 17 presents the three-color image of the region. EGO 44 is located at the east outskirts of the ρ Ophiuchi cloud (Fig. 2). The nearest known young stellar object to EGO 44 is IRAS 16367-2356 (Class II in Evans et al. 2009) which
–9– is about 15′ to the west of EGO 44. As the EGO 44 bow shock faces to the east, IRAS 16367-2356 is likely the exciting source of EGO 44.
3.2.
IRAC Counterparts of Known Outflows
Extensive surveys of outflows toward the ρ Ophiuchi cloud, including HH objects in the optical and H2 2.12 µm emission in the near-infrared, have been performed. In total, 46 HH objects, including components of HH objects, and 119 H2 emission features have be detected in this region (Grosso et al. 2001; Wu et al. 2002; G´omez et al. 2003; Khanzadyan et al. 2004; Phelps & Barsony 2004). We identified in the IRAC images 31 EGOs that correspond to the known outflows, among which seven EGOs correspond to known HH objects and 30 EGOs to H2 near-infrared emission. Figs. 18 and 19 show the region of EGO 01 which has been identified at 2.12 µm by Lucas et al. (2008). EGO 01 are three diffuse nebulae in the 2.12 µm image while it consists of 3 faint knots in the 3.6 µm and 4.5 µm images. Two YSOs, GSS 23 and SR 4, are located in the nearby of EGO 01. GSS 23 is classified as a weak-line T Tauri star (Bouvier & Appenzeller 1992). Bary et al. (2002) and Bitner et al. (2008) detected narrow H2 emission surrounding GSS 23. SR 4 is an emission-line star (Struve & Rudkjobing 1949) and Phelps & Barsony (2004) detected an HH object, HH 312, to the southeast of SR 4. Lucas et al. (2008) suggested that there are some connection between the H2 emission and the outflow driving by VLA1623-243 (see Figs. 24- 26 and discussions on EGOs in that region) on the basis of their locations and morphology. Figs. 5-6 have shown the region of EGO 34 which are counterparts of the outflow [KGS2004] f05-04 (Khanzadyan et al. 2004). Khanzadyan et al. (2004) and Smith et al. (2005) observed three knots which correspond to EGO 34a-c in their near-infrared observations. However the Spitzer images show much more details of the outflow than the near-infrared images. In Figs. 5 and 6 we can see extended diffuse emission to the northeast of EGO 34c and to the southwest of EGO 34a. The central source of the outflow, MMS126, which is identified as a low-mass Class 0 object in the millimetre continuum observations by Stanke et al. (2006) (Classified as Class 0 in Evans et al. 2009) is visible in all IRAC bands and also in the MIPS 24 µm image. Stanke et al. (2006) has observed a molecular CO outflow from MMS126 which is orientated in the NE-SW direction. Figs. 20 and 21 present the images of EGOs 02, 06, 08, 15, and 16 that corresponds to near-infrared flows [KGS2004] f10-01 and [KGS2004] 10-02 (Khanzadyan et al. 2004). Khanzadyan et al. (2004) detected nine H2 emission components of [KGS2004] f10-01. How-
– 10 – ever, only four knots, EGOs 02, 08, 15, and 16, can be detected in the IRAC images. These four EGOs are located on the two sides of BKLT J162619-242820, a Class II object (Evans et al. 2009). Khanzadyan et al. (2004) proposed BKLT J162619-242820 as the driving source of this flow. EGO 06 has two components, EGO 06a and 06b, corresponding to [KGS2004] f10-02. The driving source of EGO 06 is unclear. The IRAC images of EGOs 03, 05, and 10 are presented in Figs. 22 and 23. EGO 03 is the counterpart of [GSWC2003] 8a and EGO 05 is the counterpart of [GSWC2003] 8d. EGO 10 corresponds to [GSWC2003] 9 (G´omez et al. 2003). G´omez et al. (2003) identified [GSWC2003] 8a as three distinct components. In Figs. 22 and 23 EGO 03 is a diffuse patch. GSS 26, a Class II source (Evans et al. 2009), is the nearest YSO to EGO 03 and EGO 05 and may be the driving source for these EGOs. EGO 10 is a diffuse structure within which we can identify several relatively bright knots. The components of EGO 10 constitute a faint bow-like structure with its symmetry axis pointing to GSS 26, suggesting that EGO 10 is also driven by this source. Fig. 24 shows the locations of EGOs 07, 09, 11, 13-14, and 17-18. Their previous identifications in optical and near-infrared can be found in Table 3. G´omez et al. (2003) observed this region and proposed that most of the emission features in this region are driven by VLA1623-243, a Class 0 source in L1688 (Andr´e et al. 1993) which is marked with a pentagram in Fig. 24. VLA1623-243 has been identified as the driving source of a largescale molecular outflow which lies in the direction of NW-SE (Andr´e et al. 1990). Dent et al. (1995) presented maps of the large-scale 12 CO outflow and H2 near-infrared emission images of this region. Fig. 25 shows the northwest part of the VLA1623-243 region. EGOs 07, 11, and 1314 distribute roughly as a chain in the NW-SE direction. Caratti o Garatti et al. (2006) observed this region in near-infrared and obtained proper motion measurements for the knots in the VLA1623 region. EGO 11 corresponds to HH 313B, which is likely associated with GSS 30, a class I binary system candidate in Chen et al. (2007), as the position angle of proper motion measured for HH 313B is about 243◦ (Caratti o Garatti et al. 2006). EGO 09 is a diffuse nebula on the bottom right of Fig. 25. Khanzadyan et al. (2004) detected this feature in the near-infrared and suggested that it is driven by a source to the north. Fig. 26 shows the VLA1623-243 southeast region. We can see a chain of knots in the EGO 17 and EGO 18 flows. EGO 17 and EGO 18 correspond to near-infrared flows [GSWC2003] 20 and 21, respectively (G´omez et al. 2003). The bright mid-infrared emission knots are visible at the IRAC 3.6 µm, 4.5 µm, and 5.8 µm images while the faint ones are only visible in the 3.6 µm and 4.5 µm images.
– 11 – The IRAC images of EGOs 19, 21, and 25 are shown in Figs. 27 and 28. EGO 19 is a bowlike structure which corresponds to [GSWC2003] 24a in the near-infrared (G´omez et al. 2003) and an HH object candidate in the optical (Phelps & Barsony 2004). G´omez et al. (2003) suggested Elias 2-26 (Class II in Evans et al. 2009) as the driving source of [GSWC2003] 24a. The distance from Elias 2-26 to EGO 19 is about 2.′ 2. EGO 21a is a faint patch and EGOs 21b1 and 21b2 are elongated knots. EGOs 21b1 and 21b2 correspond to HH 79a1 and a2 in the optical image (Phelps & Barsony 2004). The relationship between EGO 21a and EGO 21b is uncertain and they could be excited by different exciting sources (G´omez et al. 2003; Phelps & Barsony 2004). EGO 25 consists of two bright knots on the top left of Figs. 27 and 28. They correspond to [GSWC2003] 25a and 25b in the near-infrared images (G´omez et al. 2003) and HH 711 in the optical (Phelps & Barsony 2004). G´omez et al. (2003) suggested three possible driving sources for this outflow, including BKLT J162658-241836, VSSG 24, and SR 21. In contrast, Phelps & Barsony (2004) proposed that VSSG 3 is the exciting source of HH 711. Figs. 29 and 30 show the region of EGOs 20 and 22-23. EGO 20 is a faint knot on the bottom right of Figs. 29 and 30. EGO 20 corresponds to a known HH object, HH 314 (Phelps & Barsony 2004). EGO 22 is a diffuse knot which corresponds to [KGS2004] f04-01 in the near-infrared and HH 673 (Phelps & Barsony 2004) in the optical. EGO 23 has a bow shock shape and coincides to [KGS2004] f04-01b. There are three YSOs in this region, BKLT J162641-244015 (Class II in Evans et al. 2009), BBRCG10 (Class II in Evans et al. 2009), and BBRCG19 (Class I, Wilking et al. 1989). Phelps & Barsony (2004) proposed BKLT J162641-244015 as the driving source of HH 314. Figs. 31 and 32 show the region of EGO 24, which consists of components EGOs 24a-d. These components correspond to four emission knots in the near-infrared flow [KGS2004] f09-01. In this region Khanzadyan et al. (2004) detected seven H2 emission knots, f09-01ag. EGO 24a has a bow shock shape and EGO 24d is a bright knot while EGO 24b-c are faint diffuse nebulae. EGO 24a and EGO 24c may belong to the same bow shock structure. G´omez et al. (2003) suggested that BBRCG 24 (Class II in Evans et al. 2009) is the driving source of the emission feature corresponding to EGO 24d and that WL 16, a early type embedded star (Padgett et al. 2008) located about 3′ south of EGO 24a, might be responsible for the emission features corresponding to EGO 24a-c. Khanzadyan et al. (2004) suggested another possibility that f09-01a-g belong to the same flow. Figs. 33 and 34 show the images of EGO 26 that coincides to [KGS2004] f03-02 (Khanzadyan et al. 2004) in the near-infrared. EGO 26 also corresponds to an HH object, HH 224S (Phelps & Barsony 2004). BKLT J162722-244807, a Class II source in Evans et al. (2009), is the nearest protostar to this EGO. However, considering the association between [KGS2004] f03-02 and
– 12 – other flows in this region, neither Khanzadyan et al. (2004) nor Phelps & Barsony (2004) suggest this object as the exciting source of the emission feature corresponding to EGO 26. Phelps & Barsony (2004) detected several [SII] emission features named HH 224N, HH 224NW1 and HH 224 NW2 to the northwest of HH 224S. They believed that HH 224S belongs to a large flow driven by an embedded source located to the northwest of EGO 26. Phelps & Barsony (2004) suggested GY 193, a YSO located in the northwest about 7 ′ away from HH 224S, as the likely exciting source. Khanzadyan et al. (2004) detected the H2 emission counterpart of HH 224S, but they did not detect the counterparts of HH 224N and HH 224NW. Therefore, they suggested EM*SR 24, which is about 8 ′ to the northwest of [KGS2004] f03-02, as the exciting source based on the fact that [KGS2004] f03-02, [KGS2004] f03-01, and EM*SR 24 are aligned along the northwest-southeast direction. In the IRAC images, only the counterpart of HH 224S, i.e., EGO 26, is detected. As EGO 26a and EGO 26b form a wide-cavity lobe which faces away from BKLT J162722-244807, we propose BKLT J162722-244807 to be the exciting source of EGO 26. Figs. 35 and 36 show the region of EGOs 27-29, and EGO 31 is shown in Figs. 37 and 38. EGOs 27-29 all are faint knots. Khanzadyan et al. (2004) proposed YLW 15 (Class I, Wilking et al. 1989) to be the likely driving source of the near-infrared emission feature corresponding to EGO 29. There are abundant YSOs in this region and the nearby YSOs are marked in Figs. 35 and 37. Figs. 39 and 40 show the region of EGO 30 and EGO 32. Khanzadyan et al. (2004) detected eight H2 emission knots in this region, f08-01a-h. Some of the non-detected nearinfrared emission knots are located at the position of the stray light marked in Fig. 39 or near the bright star YLW52. The non-detection of these knots may be due to these effects. EGO 30, corresponding to [KGS2004] f08-01a, is a bright arc-like structure. EGO 32a-b are two faint knots that coincide to [KGS2004] f08-01g and h. Grosso et al. (2001) proposed that EGO 30 arises from the interaction of two different jets emanating from two Class I protostars, YLW52 (see Fig. 39) and YLW15, which is about 10′ to the southwest of EGO 30.
3.3.
Discussion and Conclusions
The distribution of mid-infrared outflows in the ρ Ophiuchi molecular cloud, together with that of HH objects (Wu et al. 2002; G´omez et al. 2003; Phelps & Barsony 2004) and molecular CO outflows (Wu et al. 2004), is shown in Fig. 41. The grey scale image in Fig. 41 is the IRAC 4.5 µm emission and the contours give 13 CO 1-0 emission in the region. It can be seen that mid-infrared outflows, HH objects, and molecular CO outflows roughly have the same spatial distribution and they are in general concentrated in regions with high
– 13 – gas density, particularly in the region of the L1688 dense core. However, difference in the distribution of mid-infrared outflows, HH objects, and molecular CO outflows are apparent in Fig. 41. First, a substantial number of HH objects, 17 out of 46 that are detected in the ρ Ophiuchi molecular cloud (G´omez et al. 1998; Wu et al. 2002; Phelps & Barsony 2004), are located in regions of 13 CO 1-0 emission less than 2K, while none of mid-infrared outflows and molecular CO outflows are detected in these regions of relatively low gas density. This result may indicate that the excitation of mid-infrared and CO molecular outflows require more dense surrounding medium than HH objects. Secondly, we can see that in the core of the L1688 cloud mid-infrared outflows are distributed in the northern and southern parts of the core while there are several CO molecular outflows detected in the middle of the core. Using outflows as a tracer of current star formation, we can see from Fig. 41 that the core of the L1688 cloud is much more active in current star formation than the core of the L1689 cloud. The distribution of YSO candidates in the ρ Ophiuchi molecular cloud is shown in Fig. 42. YSOs in this region are mainly concentrated in the L1688 cloud core. We note that abundant YSOs are located in the region to the northwest of the L1688 cloud core though there is little dense gas in this region. In fact this part of the ρ Ophiuchi molecular cloud hosts four Class I and two flat-spectrum sources. However, no mid-infrared outflows are detected in this region (see Fig. 42). The non-detection of mid-infrared outflows in this region may be due to that little dense gas remains in this region. Several extensive surveys have been made toward the ρ Ophiuchi molecular cloud for millimeter sources (MMSs) and sub-millimeter sources (SMMs) (Wootten 1989; Wilson et al. 1999; Visser et al. 2002; Johnstone et al. 2004; Nutter et al. 2006; Stanke et al. 2006; Young et al. 2006). The MMSs and SMMs detected in these surveys are shown in Fig. 43. It can be seen that the detected MMSs and SMMs are exclusively distributed in the L1688 cloud core and the L1689 cloud core. The L1689 cloud core, hosting about 33 MMSs and SMMs, is comparable to the L1688 cloud core, which hosts about 31 MMSs and SMMs. However, we have seen that the L1688 cloud core hosts much more outflows and YSOs than the L1689 cloud core, which may mean that the MMSs and SMMs in the L1689 cloud core are in general in earlier evolutionary stages than those in the L1688 cloud cores and that they are mainly prestellar cores. The distributions of ouflows, YSOs, and MMSs and SMMs suggest a global star formation history in the ρ Ophiuchi molecular cloud which may be that the star formation in this region took place first in the northwestern part of the ρ Ophiuchi molecular cloud and most dense gas in this region has been dispersed. The L1688 cloud core is now undergoing active star formation while most of the dense cores in the L1689 cloud are still at the prestellar stages. This result is consistent with the suggestion that star formation in Ophiuchus is triggered by ionisation fronts and winds from the Upper Scorpius OB associ-
– 14 – ation which is located to the west of the ρ Ophiuchi cloud (Loren & Wootten 1986; Loren 1989a; Nutter et al. 2006). In summary, we detected 13 new mid-infrared outflows in the ρ Ophiuchi molecular cloud that have not been detected previously at other wavelengths. In addition, 31 mid-infrared outflows which correspond to previously detected HH objects or near-infrared emission are detected as well. Seven of these mid-infrared outflow features correspond to previously detected HH objects and 30 to near-infrared emission. Most of the detected mid-infrared outflows are concentrated in the dense core of the L1688 cloud, with only twelve of which locating outside of this core. In combination with the distribution of YSOs and MMSs and SMMs in the ρ Ophiuchi molecular cloud, the distribution of mid-infrared outflows hints a propagation of star formation in the ρ Ophiuchi molecular complex in the direction from northwest to southeast. We wish to thank S. B. Zhang for IDL plotting code which has been uploaded to the web site4 . This work is based on observations made with the Spizer Space Telescope, which is operated by the Jet Propulsion Laboratory, California Institute of Technology under a contract with NASA. This work was based on data taken by the c2d Spizer Space Telescope Legacy Programs. This work has made use of the SIMBAD database operated at CDS, Strasbourg, France. We acknowledge the support by NSFC grants 10733030 and 10621303.
REFERENCES Allen, L. E., Myers, P. C., Di Francesco, J., Mathieu, R., Chen, H., & Young, E. 2002, ApJ, 56, 993 Alves de Oliveira, C., & Casali, M. 2008, A&A, 485, 155 Andr´e, P., Mart´ın-Pintado, J., Despois, D., & Montmerle, T. 1993, A&A, 236, 180 Andr´e, P., & Montmerle, T. 1994, ApJ, 420, 837 Andr´e, P., Ward-Thompson, D., & Barsony, M. 1993, ApJ, 406, 122 Andrews, S. M., & Williams, J. P. 2007, ApJ, 671, 1800 Arce, H. G., et al. 2007, Protostars and Planets V, ed. B. Reipurth, D. Jewitt, & K. Keil, (Tucson, AZ: Univ. Arizona Press), 245 4
http://code.google.com/p/aicer/
– 15 – Bally, J., Reipurth, B., & Davis, C. J. 2007, Protostars and Planets V, ed. B. Reipurth, D. Jewitt, & K. Keil (Tucson, AZ: Univ. Arizona Press), 215 Barsony, M., Burton, M. G., Russell, A. P. G., Carlstrom, J. E., & Garden, R. 1989, ApJ, 346, L93 Barsony, M., Kenyon, S. J., Lada, E. A., & Teuben, P. J. 1997, ApJS, 112, 109 Bary, J. S., Weintraub, D. A., & Kastner, J. H. 2002, ApJ, 576, L73 Bitner, M. A., et al. 2008,ApJ,688,1326 Bodenheime, P. 1995, ARA&A, 33, 199 Bontemps, S. 1996, Ph.D. thesis, Univ. Paris, XI Bontemps, S., et al. 2001, A&A, 372, 173B Bouvier, J., & Appenzeller, I. 1992, A&AS, 92, 481 Bussmann, R. S., Wong, T. W., Hedden, A. S., Kulesa, C. A., & Walker, C. K. 2007, ApJ, 657, L33 Caratti o Garatti, A., Giannini, T., Nisini, B., & Lorenzetti, D. 2006, A&A, 449, 1077 Castets, A., Ceccarelli, C., Loinard, L., Caux, E., & Lefloch, B. 2001, A&A, 375, 40 Chen, X. P., Launhardt, R., & Henning, Th. 2007, A&A, 475, 277 Chen, H., Myers, P. C., Ladd, E. F., & Wood, D. O. S. 1995, ApJ, 445, 377 Cyganowski, C. J., et al. 2008, AJ, 136, 2391 Davis, C. J., Dent, W. R. F., Matthews, H. E., Coulson, I. M., & McCaughrean, M. J. 2000, MNRAS, 318, 952 Dent, W. R. F., Matthews, H. E., & Walther, D. M. 1995, MNRAS, 277, 193 Dunham, M. M., Crapsi, A., Evans, N. J., II, Bourke, T. L., Huard, T. L., Myers, P. C., & Kauffmann, J. 2008, ApJS, 179, 249 Eisl¨offel, J., Mundt, R., Ray, T. P., & Rodr´ıguez, L. F. 2000, in Protostars and Planets IV, ed. V. Mannings, A. P. Boss, & S. S. Russell (Tucson: Univ. Arizona Press), 815 Elias, J. H. 1978, ApJ, 224, 453
– 16 – Evans, N. J., II, et al. 2003, PASP, 115, 965 Evans, N. J., II, et al. 2009, ApJS, 181, 321 G´omez, M., Stark, D. P., Whitney, B. A.,& Churchwell, E. 2003, AJ, 126, 863 G´omez, M., Whitney, B. A., & Wood, K. 1998, AJ, 115, 2018 Grasdalen, G. L., Strom, K. M., & Strom, S. E. 1973, ApJ, 184, L53 Greene, T. P., Wilking, B. A., Andr´e, P., Young, E. T., & Lada, C. J. 1994, ApJ, 434, 614 Greene, T. P., & Young, E. T. 1992, ApJ, 395, 516 Grosso, N., Alves, J., Neuh¨auser, R., & Montmerle, T. 2001, A&A, 380, L1 Hirano, N., Mikami, H., Umemoto, T., Yamamoto, S., & Taniguchi, Y. 2001, ApJ, 547, 899 Imanishi, K., Koyama, K., & Tsuboi, Y. 2001, ApJ, 557, 747 Johnstone, D., Francesco, J. D., & Kirk, H. 2004, ApJ, 611, L45 Johnstone, D., Wilson, C. D., Moriarty-Schieven, G., Joncas, G., Smith, G., Gregersen, E., Fich, M. 2000, ApJ, 545, 327 Jørgensen, J. K., et al. 2006, ApJ, 645, 1246 Khanzadyan, T., Gredel, R., Smith, M. D., & Stanke, T. 2004, A&A, 426, 171 Lis, D. C., Gerin, M., Phillips, T. G., & Motte, F. 2002, ApJ, 569, 322 Loren, R. B. 1989a, ApJ, 338, 902 Loren, R. B. 1989b, ApJ, 338, 925 Loren, R. B., & Wootten, A. 1986, ApJ, 306, 142 Lucas, P. W., et al. 2008, MNRAS, 391, 136 Lynds, B. T. 1962, ApJS, 7, 1L Mer´ın, B., et al. 2008, ApJS, 177, 551 Montmerle, T., Koch-Miramond, L., Falgarone, E., & Grindlay, J. E. 1983, ApJ, 269, 182 Motte, F., Andr´e, P., & Neri, R. 1998, A&A, 336, 150
– 17 – Mundy, L. G., Wootten, A., Wilking, B. A., Blake, G. A., & Sargent, A. I. 1992, ApJ, 385, 306 Noriega-Crespo, A., et al. 2004, ApJS, 154, 352 Nutter, D., Ward-Thompson, D., & Andr´e, P. 2006, MNRAS, 368, 1833N Ozawa, H., Grosso, N., & Montmerle, T. 2005, A&A, 429, 963 Padgett, D. L., et al. 2008, ApJ, 672,1013 Phelps, R. L., & Barsony, M. 2004, AJ, 127, 420 Preibisch, Th., Guenther, E., Zinnecker, H., Sterzik, M., Frink, S., & R¨oser, S. 1998, A&A, 333, 619 Reach, W. T., et al. 2006, AJ, 131, 1479 Reipurth, B., & Bally, J. 2001, ARA&A, 39, 403 Reipurth, B., Bally, J., & Devine, D. 1997, AJ, 114, 2708R Ridge, N. A., et al. 2006, AJ, 131, 2921R Rosenthal, D., Bertoldi, F., & Drapatz, S. 2000, A&A, 356, 705 Shang, H., Li, Z.-Y., & Hirano, N. 2007, Protostars and Planets V, ed. B. Reipurth, D. Jewitt, & K. Keil (Tucson, AZ: Univ. Arizona Press), 261 Smith, M. D., Gredel, R., Khanzadyan, T., & Stanke, T. 2005, Mem. Soc. Astron. Italiana, 76, 247 Smith, H. A., Hora, J. L., Marengo, M., & Pipher, J. L. 2006, ApJ, 645, 1264 Smith, M. D. & Rosen, A. 2005, MNRAS, 357, 1370 Stanke, T., Smith, M. D., Gredel, R., & Khanzadyan, T. 2006, A&A, 447, 609 Stark, R., et al. 2004, ApJ, 608, 341 Struve, O., & Rudkjobing, M. 1949, ApJ, 109, 92 Teixeira, P. S., McCoey, C., Fich, M., & Lada, C. J. 2008, MNRAS, 384, 71 Visser, A. E., Richer, J. S., & Chandler, C. J. 2002,AJ,124,2756
– 18 – Vrba, F. J., Strom, K. M., Strom, S. E., & Grasdalen, G. L. 1975, ApJ, 197, 77 Wilking, B. A., Bontemps, S., Schuler, R. E., Greene, T. P., & Andr´e, P. 2001, ApJ, 551, 357 Wilking, B. A., Gagn´e, M., & Allen, L. E. 2008, Astronomical Society of the Pacific, Handbook of Star Forming Regions Vol. II Wilking, B. A., Lada, C. J., & Young, E. T. 1989, ApJ, 340, 823 Wilking, B. A., Meyer, M. R., Robinson, J. G., & Greene, T. P. 2005, AJ, 130, 1733 Wilking, B. A., Schwartz, R. D., & Blackwell, J. H. 1987, AJ, 94, 106 Wilking, B. A., Schwartz, R. D., Fanetti, T. M., & Friel, E. D. 1997, PASP, 109, 549 Wilson, C. D., et al. 1999, ApJ, 513, L139 Wootten, A. 1989, ApJ, 337, 858 Wootten, A., & Loren, R. B. 1987, ApJ, 317, 220 Wu, J., Wang, M., Yang, J., Deng, L., & Chen, J. 2002, AJ, 123, 1986 Wu, Y., Wei, Y., Zhao, M., Shi, Y., Yu, W., Qin, S., & Huang, M. 2004, A&A, 426, 503 Young, E. T, Lada, C. J., & Wilking, B. A. 1986, ApJ, 304, L45 Young, K. E., et al. 2006, ApJ, 644, 326 de Zeeuw, P. T., Hoogerwerf, R., & de Bruijne, J. H. J. 1999, AJ, 117, 354
This preprint was prepared with the AAS LATEX macros v5.2.
– 19 –
Table 1. IRAC Mid-infrared Outflows in Ophiuchus
Object EGO EGO EGO EGO EGO EGO EGO EGO EGO EGO EGO EGO EGO EGO EGO EGO EGO EGO EGO EGO EGO EGO EGO EGO EGO EGO EGO EGO EGO EGO EGO EGO EGO EGO EGO EGO EGO EGO EGO EGO EGO EGO EGO EGO EGO
04 12 33 35a 35b 35c 35d 35e 35f 35g 35h 35i 35j 36a 36b 36c 36d 36e 36f 36g 36h 37 38 39 40 41a 41b 41c 41d 41e 41f 41g 41h 41i 42 43a1 43a2 43a3 43a4 43a5 43a6 43b1 43b2 43b3 43b4
α (J2000.0)
δ (J2000.0)
Figure Reference
16:26:10.1 16:26:18.2 16:28:16.2 16:28:58.9 16:28:59.3 16:28:59.7 16:28:59.9 16:29:00.7 16:29:00.7 16:29:01.9 16:29:02.3 16:29:02.5 16:29:03.1 16:29:13.4 16:29:13.5 16:29:14.4 16:29:14.4 16:29:14.5 16:29:15.2 16:29:15.4 16:29:17.2 16:31:22.0 16:31:25.8 16:31:36.0 16:31:37.2 16:32:01.0 16:32:01.2 16:32:02.2 16:32:03.2 16:32:03.2 16:32:03.3 16:32:04.2 16:32:04.2 16:32:04.7 16:32:11.8 16:32:19.3 16:32:19.5 16:32:21.1 16:32:21.5 16:32:22.3 16:32:23.6 16:32:27.0 16:32:27.8 16:32:28.6 16:32:29.2
-24:12:40 -24:15:07 -24:35:03 -24:17:54 -24:17:51 -24:17:46 -24:18:18 -24:18:02 -24:17:49 -24:18:24 -24:18:28 -24:17:56 -24:18:23 -24:16:59 -24:16:25 -24:16:39 -24:17:17 -24:17:03 -24:16:32 -24:16:11 -24:16:07 -24:03:17 -24:02:42 -24:03:51 -24:03:30 -24:31:59 -24:31:54 -24:31:42 -24:32:27 -24:32:19 -24:31:39 -24:31:55 -24:31:35 -24:31:40 -24:30:33 -24:28:31 -24:28:11 -24:28:30 -24:28:38 -24:28:32 -24:28:35 -24:28:19 -24:28:36 -24:28:31 -24:28:16
3,4 3,4 5,6 7,8,9 7,8,9 7,8,9 7,8,9 7,8,9 7,8,9 7,8,9 7,8,9 7,8,9 7,8,9 7,8,9 7,8,9 7,8,9 7,8,9 7,8,9 7,8,9 7,8,9 7,8,9 10,11 10,11 10,11 10,11 12,13 12,13 12,13 12,13 12,13 12,13 12,13 12,13 12,13 12,13 13,15 13,15 13,15 13,15 13,15 13,15 13,15 13,15 13,15 13,15
– 20 –
Table 1—Continued Object EGO EGO EGO EGO EGO EGO EGO EGO EGO EGO EGO EGO EGO EGO EGO EGO EGO EGO EGO EGO
43b5 43b6 43b7 43b8 43b9 43b10 43b11 43c1 43c2 43c3 43c4 43c5 43d1 43d2 43d3 43d4 43d5 43d6 43d7 44
α (J2000.0)
δ (J2000.0)
Figure Reference
16:32:30.1 16:32:33.8 16:32:34.7 16:32:35.4 16:32:36.1 16:32:36.5 16:32:36.6 16:32:44.7 16:32:45.7 16:32:47.1 16:32:47.2 16:32:48.9 16:32:55.9 16:32:57.5 16:32:58.4 16:33:01.3 16:33:02.9 16:33:04.2 16:33:07.2 16:40:50.6
-24:28:28 -24:29:04 -24:28:33 -24:29:04 -24:28:28 -24:28:32 -24:28:56 -24:29:28 -24:29:09 -24:29:09 -24:28:49 -24:29:13 -24:28:13 -24:28:24 -24:28:39 -24:28:54 -24:28:53 -24:28:40 -24:28:27 -24:01:21
13,15 13,15 13,15 13,15 13,15 13,15 13,15 13,14 13,14 13,14 13,14 13,14 13,14 13,14 13,14 13,14 13,14 13,14 13,14 16,17
Note. — Units of right ascension are hours, minutes, and seconds, and units of declination are degrees, arcminutes, and arcseconds.
– 21 –
Table 2. Likely Exciting Sources of the Newly Detected Outflows
Object EGO EGO EGO EGO EGO EGO EGO EGO EGO EGO EGO EGO EGO
04 12 33 35 36 37 38 39 40 41 42 43 44
Exciting Source
a
BKLT J162624-241616 BKLT J162624-241616 BKLT J162816-243657 SR 10, SR 20W, BKLT J162908-241549, SR 20, BKLT J162923-241359 SR 10, SR 20W, BKLT J162908-241549, SR 20, BKLT J162923-241359 GWAYL 4 GWAYL 4 L1709 3 L1709 3 SSTc2d J163145.81-243909.0, IRAS 16293-2422 SSTc2d J163145.81-243909.0, IRAS 16293-2422 IRAS 16293-2422 IRAS 16367-2356
Lada Class
b
II II II II, II, II, III, III II, II, II, III, III Flat Flat Flat Flat II, 0 II, 0 0 II
Distance c (arcmin) 4.74 1.78 1.88 2.84, 16.94 1.70, 20.58 3.6 2.55 0.60 0.70 8.00, 5.50 10.36, 3.00 11.35 d 14.90
a Source designations used in the table correspond to the following optical or infrared surveys: BKLT is from Barsony et al. (1997), GWAYL from Greene et al. (1994), L1709 from Padgett et al. (2008) and SR from Struve & Rudkjobing (1949) b The Lada Class is classified based on the spectral index and bolometric temperature. Greene et al. (1994) and Chen et al. (1995) c The
The criteria are from
distances to the nearest exciting source and to the farthest exciting source if there are more than one possible exciting source. d This
is the scale of the outflow.
.
– 22 –
Table 3. Mid-infrared Counterparts of Known HH Objects and H2 Flows in ρ Ophiuchi
Counterpart
α (J2000.0)
δ (J2000.0)
Previous Identificationsa
EGO EGO EGO EGO EGO EGO EGO EGO EGO EGO EGO EGO EGO EGO EGO EGO EGO EGO EGO EGO EGO EGO EGO EGO EGO EGO EGO EGO EGO EGO EGO EGO EGO EGO EGO EGO EGO EGO EGO EGO EGO EGO EGO EGO EGO
16:25:49.8 16:25:50.4 16:25:51.3 16:26:03.1 16:26:06.5 16:26:11.1 16:26:12.7 16:26:13.5 16:26:15.9 16:26:16.4 16:26:16.6 16:26:16.6 16:26:17.3 16:26:17.5 16:26:19.0 16:26:21.4 16:26:21.8 16:26:21.9 16:26:25.3 16:26:28.4 16:26:31.1 16:26:31.7 16:26:32.3 16:26:32.9 16:26:33.7 16:26:35.7 16:26:36.6 16:26:37.5 16:26:38.3 16:26:39.2 16:26:40.2 16:26:38.2 16:26:39.0 16:26:44.4 16:26:46.4 16:26:47.2 16:26:47.5 16:26:59.0 16:27:08.1 16:27:08.4 16:27:08.6 16:27:09.5 16:27:10.3 16:27:16.4 16:27:22.3
-24:22:12 -24:22:22 -24:22:16 -24:29:33 -24:21:35 -24:20:33 -24:31:13 -24:31:10 -24:22:41 -24:22:45 -24:28:35 -24:25:39 -24:18:05 -24:23:13 -24:23:05 -24:23:31 -24:23:37 -24:23:26 -24:27:34 -24:27:05 -24:25:14 -24:25:17 -24:25:19 -24:25:22 -24:25:29 -24:25:27 -24:25:39 -24:25:40 -24:25:46 -24:25:54 -24:26:07 -24:18:29 -24:40:53 -24:20:07 -24:20:15 -24:20:12 -24:38:16 -24:37:03 -24:33:05 -24:33:32 -24:33:17 -24:33:41 -24:17:45 -24:43:56 -24:49:14
Ab Ab Ab [KGS2004] f10-01b [GSWC2003] 8a [GSWC2003] 8d [KGS2004] f10-02a [KGS2004] f10-02b [GSWC2003] 11a [GSWC2003] 11b [KGS2004] f10-01e [KGS2004] f10-03 [GSWC2003] 9 HH 313Bc HH 313A, VLA 1623A, [DMW95] H5 [GSWC2003] 14f [GSWC2003] 14e [GSWC2003] 14g [KGS2004] f10-01h [KGS2004] f10-01i [GSWC2003] 20a, [KGS2004] f10-04d, [DMW95] H3 [GSWC2003] 20b, [KGS2004] f10-04e [GSWC2003] 20c, [KGS2004] f10-04f [GSWC2003] 20d, [KGS2004] f10-04g, [DMW95] H2 [GSWC2003] 20f, [KGS2004] f10-04h, [DMW95] H1 [GSWC2003] 21a, [KGS2004] f10-04i [GSWC2003] 21b, [KGS2004] f10-04j [GSWC2003] 21c, [KGS2004] f10-04k [GSWC2003] 21d [KGS2004] f10-04m newd [GSWC2003] 24a HH 314 HH 79bc HH 79a1c HH 79a2c HH 673, [KGS2004] f04-01a [KGS2004] f04-01b [KGS2004] f09-01a, [GSWC2003] 3f [KGS2004] f09-01d, [GSWC2003] 3d [KGS2004] f09-01c, [KGS2004] f09-01e, [GSWC2003] 3b [GSWC2003] 25a, HH 711 [GSWC2003] 25b [KGS2004] f03-02a
01a 01b 01c 02 03 05 06a 06b 07a 07b 08 09 10 11 13 14a 14b 14c 15 16 17a 17b 17c 17d 17e 18a 18b 18c 18d 18e 18f 19 20 21a 21b1 21b2 22 23 24a 24b 24c 24d 25a 25b 26a
Figure Reference 18,19 18,19 18,19 20,21 22,23 22,23 20,21 20,21 24,25 24,25 20,21 24,25 22,23 24,25 24,25 24,25 24,25 24,25 20,21 20,21 24,26 24,26 24,26 24,26 24,26 24,26 24,26 24,26 24,26 24,26 24,26 27,28 29,30 27,28 27,28 27,28 29,30 29,30 31,32 31,32 31,32 31,32 27,28 27,28 33,34
– 23 –
Table 3—Continued Counterpart
α (J2000.0)
δ (J2000.0)
EGO EGO EGO EGO EGO EGO EGO EGO EGO EGO EGO EGO
16:27:22.8 16:27:28.2 16:27:39.6 16:27:39.8 16:27:40.2 16:27:43.2 16:27:50.4 16:28:03.9 16:28:05.2 16:28:17.7 16:28:19.4 16:28:23.1
-24:48:53 -24:37:56 -24:41:50 -24:38:09 -24:37:60 -24:31:51 -24:40:08 -24:30:54 -24:30:40 -24:38:09 -24:37:09 -24:36:10
26b 27 28 29a 29b 30 31 32a 32b 34a 34b 34c
Previous Identificationsa [KGS2004] [KGS2004] [KGS2004] [KGS2004] [KGS2004] [KGS2004] [KGS2004] [KGS2004] [KGS2004] [KGS2004] [KGS2004] [KGS2004]
f03-02b, HH 224S f04-06 f05-01 f04-03e, [GSWC2003] 7a f04-03f, [GSWC2003] 7b f08-01a f05-03 f08-01g f08-01h f05-04a f05-04b f05-04c
Figure Reference 33,34 35,36 35,36,37,38 35,36 35,36 39,40 37,38 39,40 39,40 5,6 5,6 5,6
Note. — Units of right ascension are hours, minutes, and seconds, and units of declination are degrees, arcminutes, and arcseconds. a Source designations used in the table correspond to the following optical or infrared surveys: [GSWC2003] is from G´ omez et al. (2003), [KGS2004] from Khanzadyan et al. (2004), and [DMW95] from Dent et al. (1995). b This
identification is from Lucas et al. (2008) and it is not included in Simbad
c Also
detected in the near-infrared and the identifications are designated with HH object numbers. d This
source is a new feature which has no counterpart of optical or near-infrared flow.
– 24 –
Fig. 1.— Three-color image of the ρ Ophiuchi molecular clouds with IRAC band 1 (3.6µm, blue), IRAC band 2 (4.5µm, green) and IRAC band 4 (8.0µm, red). We marked the main Lynds cloud in the region (Lynds 1962).
– 25 –
Fig. 2.— The portion of the ρ Ophiuchi cloud which includes all the IRAC mid-infrared outflows. The grey scale image is the IRAC channel 2 (4.5µm) image. The newly detected outflows are marked with circles and the counterparts of previously known HH objects and H2 flows are labelled with pluses. The open squares represent the L1689 and L1709 aggregates (Padgett et al. 2008). We also labelled three YSOs with filled squares for the convenience of subsequent discussion (see Section 3.1). SR sources are from Struve & Rudkjobing (1949).
– 26 –
Fig. 3.— The region of EGO 04 and EGO 12. The image is the difference image of IRAC channel 2 (4.5 µm) minus channel 1 (3.6 µm). The BKLT sources are from Barsony et al. (1997).
– 27 –
Fig. 4.— Three-color image of the EGO 04 and EGO 12 region. The image uses IRAC channel 1 (3.6 µm, blue), channel 2 (4.5 µm, green) and channel 4 (8.0 µm, red). The EGOs identified in the region are marked.
– 28 –
Fig. 5.— The difference image of the EGO 33 and EGO 34 region. Filter ghosts are marked with “gh”. MMS126 (Class 0, Stanke et al. 2006) and BKLT sources (Barsony et al. 1997) are marked.
– 29 –
Fig. 6.— Three-color image of the EGO 33 and EGO 34 region. Others are the same as in Fig. 4.
– 30 –
Fig. 7.— Region of EGOs 35 and 36. Others are the same as in Fig. 3
– 31 –
Fig. 8.— Three-color image of the region of EGOs 35 and 36. Others are the same as in Fig. 4. Note that the bow shock morphology of EGOs 35 and 36 is outlined with the white lines.
– 32 –
Fig. 9.— A large view of the EGOs 35 and 36 region. YSOs in this region are marked.
– 33 –
Fig. 10.— The region of EGOs 37-40. The members of the L1709 YSO aggregate, L1709 1-6 (Padgett et al. 2008), are labelled. Filter ghosts and stray lights are marked. The bow shock morphology of EGO 38 is outlined with a white line. Others are the same as in Fig. 3
– 34 –
Fig. 11.— Three-color image of the region of EGOs 37-40. Others are the same as in Fig. 4.
– 35 –
Fig. 12.— The region of EGOs 41 and 42. The bow shock morphology of EGO 41 is outlined with a white line. Others are the same as in Fig. 3.
– 36 –
Fig. 13.— Three-color image of the IRAS 16293-2422 region. EGOs in the region, 41-42 and 43A-D, are marked. The GWAYL source is from Greene et al. (1994). Others are the same as in Fig. 4.
– 37 –
Fig. 14.— Image of the inner portion of the EGO 43 outflow. The locations of IRAS 16293-2422 A, B and IRAS 16293E are marked with pentagrams. Others are the same as in Fig. 3.
– 38 –
Fig. 15.— Image of the outer portion of the EGO 43 outflow. Others are the same as in Fig. 3.
– 39 –
Fig. 16.— The region of EGO 44. The bow shock morphology of EGO 44 is outlined with a white line. Others are the same as in Fig. 3.
– 40 –
Fig. 17.— Three-color image of the EGO 44 region. Others are the same as in Fig. 4.
– 41 –
Fig. 18.— The region of EGO 01, a counterpart of H2 emission (Lucas et al. 2008). The GSS source is from Grasdalen et al. (1973) and the SR source is from Struve & Rudkjobing (1949). Others are the same as in Fig. 3.
– 42 –
Fig. 19.— The same as Fig. 4, but for the EGO 01 region.
– 43 –
Fig. 20.— The same as Fig. 3, but for the EGOs 02, 06, 08, 15, and 16 region. The BKLT source is from Barsony et al. (1997).
– 44 –
Fig. 21.— The same as Fig. 4, but for the EGOs 02, 06, 08, 15, and 16 region.
– 45 –
Fig. 22.— The same as Fig. 3, but for the region of EGOs 03, 05, and 10. Elias 2 is from Elias (1978), GSS 26 from Grasdalen et al. (1973), and ISO-oph 18 from Bontemps et al. (2001). The bow shock morphology of EGO 10 is outlined with a white line.
– 46 –
Fig. 23.— The same as Fig. 4, but for the region of EGOs 03, 05, and 10.
– 47 –
Fig. 24.— The same as Fig. 4, but for the region of EGOs 07, 09, 11, 13-14, 17-18. The location of the Class 0 sources VLA1623-243 is marked with a white pentagram.
– 48 –
Fig. 25.— The same as Fig. 3, but for the VLA1623-243 northwest region. The location of the Class 0 sources VLA1623-243 is marked with a pentagram. The GSS source is from Grasdalen et al. (1973).
– 49 –
Fig. 26.— The same as Fig. 3, but for the VLA1623-243 southeast region. The OPH source is from Grasdalen et al. (1973).
– 50 –
Fig. 27.— The same as Fig. 3, but for the EGOs 19, 21, and 25 region. Source designations used are as follows: BKLT sources are from Barsony et al. (1997), Elias sources from Elias (1978), SR sources from Struve & Rudkjobing (1949), VSSG sources from Vrba et al. (1975) and WLY sources from Wilking et al. (1989). The bow shock morphology of EGO 19 is outlined with a black line.
– 51 –
Fig. 28.— The same as Fig. 4, but for the EGOs 19, 21, and 25 region.
– 52 –
Fig. 29.— The same as Fig. 3, but for the EGOs 20 and 22-23 region. Source designations used are as follows: BKLT sources are from Barsony et al. (1997), ISO-oph sources from Bontemps et al. (2001) and BBRCG sources from Barsony et al. (1989).
– 53 –
Fig. 30.— The same as Fig. 4, but for the EGOs 20 and 22-23 region.
– 54 –
Fig. 31.— The same as Fig. 3, but for the EGO 24 region. BBRCG sources are from Barsony et al. (1989). The bow shock morphology of EGO 24a is outlined with a white line.
– 55 –
Fig. 32.— The same as Fig. 4, but for the EGO 24 region.
– 56 –
Fig. 33.— The same as Fig. 3, but for the EGO 26 region. The BKLT source is from Barsony et al. (1997).
– 57 –
Fig. 34.— The same as Fig. 4, but for the EGO 26 region.
– 58 –
Fig. 35.— The same as Fig. 3, but for the EGOs 27-29 region. YLW sources are from Young et al. (1986) and WLY1 sources from Wilking et al. (1989).
– 59 –
Fig. 36.— The same as Fig. 4, but for the EGOs 27-29 region.
– 60 –
Fig. 37.— The same as Fig. 3, but for the EGOs 28 and 31 region. BKLT sources are from Barsony et al. (1997), ISO-oph sources from Bontemps et al. (2001), and AOC sources from Alves de Oliveira & Casali (2008).
– 61 –
Fig. 38.— The same as Fig. 4, but for the EGOs 28 and 31 region.
– 62 –
Fig. 39.— The same as Fig. 3, but for the EGOs 30 and 32 region. The YLW source is from Young et al. (1986) and the GY92 source is from Greene & Young (1992).
– 63 –
Fig. 40.— The same as Fig. 4, but for the EGOs 30 and 32 region.
– 64 –
Fig. 41.— The distribution of IRAC mid-infrared outflows, HH objects, and CO outflows in the ρ Ophiuchi molecular cloud. The grey scale image is the IRAC 4.5 µm image. The contours represent antenna temperatures TA∗ of 2,4,5,6,7,8,10,12,14,18 and 20K of the 13 CO emission. CO outflows are from Wu et al. (2004) and HH objects are from Simbad. The arrow marks the direction of the Upper Scorpius OB association with respect to the Ophiuchus cloud. The distance shown above the arrow is from the center of current figure to the center of Upper-Scorpius OB association region that was defined by de Zeeuw et al. (1999) .
– 65 –
Fig. 42.— The distribution of IRAC mid-infrared outflows compared with that of YSO candidates. Others are the same as in Fig. 41.
– 66 –
Fig. 43.— The distribution of IRAC mid-infrared outflows compared with that of MMSs and SMMs. MMSs are from Young et al. (2006) and SMMs are from Simbad. Others are the same as in Fig. 41.