ABSTRACT. In this paper, an attempt has been made to develop a statistical model for the sensor data stream, estimating density for distribution of data and ...
International Journal of Computer Applications (0975 – 8887) Volume 5– No.7, August 2010
Outlier Detection of Data in Wireless Sensor Networks Using Kernel Density Estimation V. S. Kumar Samparthi
Harsh K. Verma
Department of Computer Science and Engineering National Institute of Technology, Jalandhar, Punjab, India
Department of Computer Science and Engineering National Institute of Technology, Jalandhar, Punjab, India
ABSTRACT In this paper, an attempt has been made to develop a statistical model for the sensor data stream, estimating density for distribution of data and flagging a particular value as an outlier in the best possible manner without compromising with the performance. A statistical modeling technique transforms the raw sensor readings into meaningful information which will yield effective output, hence offering a more reliable way to gain insight into the physical phenomena under observation. We have proposed a model that is based on the approximation of the sensor data distribution. Our approach takes into consideration various characteristics and features of streaming sensor data. We processed and evaluated our proposed scheme with a set of experiments with datasets which is taken from Intel Berkeley research lab. The experimental evaluation shows that our algorithm can achieve very high precision and recall rates for identifying outliers and demonstrate the effectiveness of the proposed approach.
Keywords
outlier detection, statistical modeling technique, kernel density function, wireless sensor networks
1.
INTRODUCTION
In real life situations, there are many physical phenomenons like measuring temperature, air pressure, monitoring the network or traffic, which needs to be continuously monitored. Wireless sensor networks have become an important source of data for such applications. These collaborated and interconnected sensors in wireless sensor networks produce data continuously which is uncertain and unreliable. Hence an effective processing and analysis of data streams becomes our utmost importance for various applications like outlier detection. But unfortunately sensor data is highly susceptible to various sources of errors such as changing environmental conditions which may produce noise or noise from other sources. These noises can severely affect our reading or approximation of data leading to imprecise and incorrect answers to the posed queries. These unexpected or unwanted data are called outliers. In order to detect the outliers within sensors, we must first derive the meaningful information of physical world from raw and uncertain sensor reading. So to bridge the gap from raw uncertain sensor readings to meaningful information model, statistical modeling technique is applied. It approximates the distribution of data within sensors. Once density is determined, we can determine the outliers not falling in particular density and taking care of deviation of neighboring density. So the main problem of concern is to choose appropriate algorithms which can solve the above mentioned problems and to use them for detecting outliers.
The remaining of the paper is organized as follows. Section-2 reviews the literature survey done. Section-3 presents the proposed approach and methodology. The simulation results have been discussed in Section-4. Section-5 concludes the paper giving future scope of the work.
2.
RELATED WORK
A comprehensive review of the work reported in literature is presented in this section. In 2003, Eiman Elnahrawy and Badri Nath [1], introduced a framework for cleaning and querying noisy sensors. Specifically, they presented a Bayesian approach for reducing the uncertainty associated with the data that arise due to random noise, in an online fashion. Their approach combined prior knowledge of the true sensor reading, the noise characteristics of this sensor, and the observed noisy reading in order to obtain a more accurate estimate of the reading. This cleaning step can be performed either at the sensor level or at the base-station. Based on these proposed uncertainty models and using a statistical approach, the authors have introduced several algorithms for answering traditional database queries over uncertain sensor readings. Finally, the authors have presented a preliminary evaluation of their proposed approach using synthetic data and highlighted some exciting research directions in this area. In 2004, Victoria J. Hodge & Jim Austin [2], proposed a survey of contemporary techniques for outlier detection. In outlier detection, the developer should select an algorithm that is suitable for their data set in terms of the correct distribution model, the correct attribute types, the scalability, the speed, any incremental capabilities to allow new exemplars to be stored and the modeling accuracy. The developer should also consider which of the three fundamental approaches is suitable for their problem, a clustering approach, a classification approach or a novelty approach. This will depend on: the data type, whether the data is pre-labeled, the ground truth of the labeling, how the authors have wished to detect outliers and how the authors have wished to handle them. How the developers wish to handle outliers is very important, whether the authors have wished to expunge them from future processing in a diagnostic clustering or a recognition system or retain them with an appropriate label in a accommodating clustering or a classification system. In 2006, Christoph Heinz and Bernhard Seeger [3] suggested that initial approach to tackle an important problem in sensor processing, namely the detection of outliers, with a statistical model and investigated the augmentation of sensor network querying by meaningful statistical models. Instead of exploring 28
International Journal of Computer Applications (0975 – 8887) Volume 5– No.7, August 2010 the raw sensor readings, a statistical model offers a more reliable way to gain insight into the physical phenomena observed. A key ingredient of statistical models is the probability density function as it provides a comprehensive summary. Based on online computable estimates of the probability density function, the authors have presented an initial approach to detect outliers in streaming sensor data. However, outlier detection is only one of many possibilities to enrich sensor querying with statistical modeling techniques. In 2006, S. Subramaniam, UC Riverside, T. Palpanas and D. Papadopoulos, V. Kalogeraki, D. Gunopulos [4] proposed a framework that computes in a distributed fashion an approximation of multi-dimensional data distributions in order to enable complex applications in resource-constrained sensor networks. The authors have motivated these techniques in the context of the problem of outlier detection. The authors have demonstrated how these frameworks can be extended in order to identify either distance or density-based outliers in a single pass over the data, and with limited memory requirements. The authors have studied the problem of outlier detection in sensor networks. Outlier detection is very important in this context, since it enables the analyst to focus on the interesting events in the network. Moreover, the authors have distributed the computation effort among the nodes in the network, thus better exploiting the available resources and cutting back on the communication and processing costs.
3. PROPOSED APPROACH AND METHODOLOGY A sensor network captures samples of data from real world physical phenomenon. In this type of organization the sensors are located at the network nodes. Let us assume that each sensor is measuring a single real valued attribute X i, at each time instant. So considering this situation we have to model the set of attributes X1, ..., Xn as an n-dimensional random variable X = (X1, ..., Xn), i.e., we assume that the sensor readings are samples of the random variable X. And if we have the probability density function (pdf) f(X1, ...,Xn) for above mentioned sensor readings, then we can determine the distribution of X in terms of the probabilities of arbitrary attribute :
(1) But the question is how to determine the PDF for a measured set of attributes. There are probably a bunch of probability density estimation techniques in our bucket that have been proposed earlier [5] such as: Histograms means of estimation, Wavelets density estimation, Kernel density estimators, Orthogonal series estimation, General weight function estimators, Maximum penalized estimators and others. All these above discussed methods have their different usability in different fields. In our work, we have chosen to estimate the distribution of the measurements generated by the sensors by kernel density estimators, due to the following described properties which are desirable:
To maintain a streaming environment of sensor data, kernel density estimation technique is efficient to compute and analysis than others Kernel Density Estimation Technique is very effective to approximate an unknown data distribution than other methods which has described. In block by block processing through kernel density estimation the blocks can easily be combined in comparison to other methods and also They scale well in multiple dimensions. Towards this work, we have to develop our model for a memoryadaptive maintenance of arbitrary nonparametric estimators over a particular sensor data streams. To do the same, the data stream is partitioned into blocks of fixed size smaller than available memory. The basic idea here is that we are not processing the entire sensor data stream at once, rather than that the particular data stream here will be processed block by block. Means a data stream is firstly broken into smaller streams or blocks. To accomplish this we are computing here a local density estimation for each block. After that we must have to combine all these blocks into a single one as an overall estimation. The cumulative estimator corresponds to a convex linear combination of the local estimators derived from already consumed blocks. This is the basic computation step in processing of the sensor data stream. Computation of the cumulative estimator is based on the method of defining a binary function that takes as input the cumulative estimator of the first n blocks and the block estimator of the (n+1)th block. So, now here a linear combination of both inputs will return the cumulative estimator for the first n+ 1 block. The following formula may well depict the iterative computability of cumulative estimators as referred in [6]:
(2) In the above formula is the cumulative estimator for different blocks in the sensor data stream, where m denotes the number of already processed one. Then, for all cumulative estimators consists of sequence of weights where 0 .
3.1
Kernel Density Estimation
The first step is to produce a uniform random sample of streaming sensor data. However random sampling is the basic and simple statistical estimation technique for Density Estimation and we all are aware that distribution of random sample is defined by its Probability Density Function (PDF). In Kernel Density Estimation all the game go just around the Kernel Functions, it’s the sum over Kernel Functions which are centered at sample points of concerned data stream. Generally in kernel density estimation a kernel function depicts the way of distributing the weights in the area near to the values or points which is being processed. To determine the density estimation for whole data set we must have to combine all the kernel functions. 29
International Journal of Computer Applications (0975 – 8887) Volume 5– No.7, August 2010 Let us assume that (X1,....., Xd) are the elements of a block in a data stream then the kernel density estimator (KDE) may be defined as in [6] =
(3)
Here K is the Kernel Function and B denotes the bandwidth or window width. Bandwidth is also called smoothing parameter by some authors. Here the bandwidth B is very important and crucial parameter in our work of density estimation since it’s more or less controls the influential region of a point in a data stream as discussed in [7]. In the Paper [7] various strategies are also discussed for making the bandwidth choice.
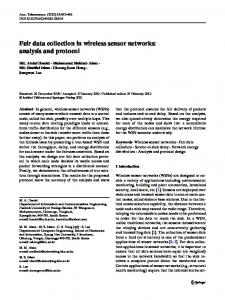
[9] for a particular point in the data stream. Deviation factor at radius r for a point p is the relative deviation of its local neighborhood density from the average local neighborhood density in its r-neighborhood i.e. (sampling neighborhood) [9]. According to this we need to calculate the count of neighbors and samples of neighbors [9] which are also called counting neighborhood and sampling neighborhood. These two values would be determined from the above discussed Kernel Density Estimation model which are (i) αr-neighbors of the observation p (counting neighborhood) and (ii) the total no of observations in the interval 2αr (sampling neighborhood) (Fig.1).
The bandwidth B is set by using Scott’s rule [8] where we determine the standard deviation σ of the values within the random sample S taken from sensor data stream under processing. (4) The Kernel Functions are having some basic properties like smoothness, continuous, positive and symmetric.The Kernel Density Estimation exhibits these properties of Kernel Functions. Moreover, The standard kernel functions [5] are the Epanechnikov Kernel, Laplacian Kernel, Gaussian Kernels, Quartic kernel, uniform Kernel etc. Moreover in our work we are focusing towards Epanechnikov Kernel and Gaussian Kernels. The Epanechnikov Kernel and Gaussian Kernels are described by standard formula[5] that are (5)
Fig.1 Counting Neighborhood and Sampling Neighborhood Counting neighborhood Nr(p,αr) is calculated through probability density model as (10) Where d is a block size and P[p-αr ; p+ αr] is calculated using kernel density estimation which has been discussed as
And the other one is (11) (6)
3.2
Methods for Weighting
An appropriate weighting scheme may prove a better accuracy and can increase the efficiency in kernel density estimation. The Arithmetic weighting method and exponential weighting method discussed in [6] are the two methods which will fulfill our requirement here. In arithmetic weighting method all Block Estimation fn(x) is weighted equally something like this:
(7) Hence the weight sequence Wn, n>=1 is defined as = And the overall estimation
(8)
DEVF(p,r,α) > NDEVF(p,r,α)
3.4
(12)
Algorithm for outlier detection To check a particular point say P for outlier, first, we need to compute the deviation factor of that point. For this we need to compute the sampling neighbourhood and counting neighbourhood for point y. Sampling neighnourhood for a particular point p and radius r is the set of neighbour which falls within the radius r. The element of set are called r-neighbours. Counting neighbourhood is the set of αr-neighbours of each element of set of r-neighbours. Compute the deviation factor DEVF for a point p, radius r and chosen parameter α
follows (9)
3.3
Similarly sampling neighborhood Nr(p, r) can be computed. Now we will calculate the DEVF for a point p, radius r and α and normalized deviation factor NDEVF. Now a point p will be flagged as an outlier if
(13)
Outlier Detection
To detect a value as an outlier we need to compute the deviation factor (DEVF) [9] and Normalized Deviation Factor (NDEVF)
Now compute the normalized deviation factor which is given by 30
International Journal of Computer Applications (0975 – 8887) Volume 5– No.7, August 2010
(14) If DEVF > NDEVF than the point will be flagged as an outlier.
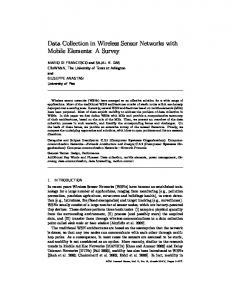
We have applied the kernel density estimation techniques for sensor-1. It approximated the density at various kernel points and given the points where we have to plot the density. We have plotted the density estimate for temperature, humidity and voltage for sensor-1. The plots we got are: Probability Density Estimation based on 43047 data samples 0.2
RESULTS AND DISCUSSIONS
To apply our proposed method, we used the real data set from Intel Berkeley Research lab [10]. This dataset is freely available on their website and contains information about data collected from 54 sensors deployed in the lab between February 28th and April 5th, 2004. This file includes a log of about 2.3 million readings collected from these sensors. The file is 34MB gzipped, and 150MB uncompressed. The schema is as follows:
0.15 f(x)
4.
0.1 0.05 0
0
20
40
60
80
100
120
140
120
140
Cumulative Distribution Function 1.5
Table 1: Schema of dataset (Intel Lab Data) Time
Epoch
Moteid
temp
humidity
light
voltage
(yymmdd)
(hh:
(int)
(int)
(real)
(real)
(real)
(real)
F(x)
1
Date
mean(x) = 39.9525 var(x) = 1371.94
0.5
mm: 0
ss.
0
20
40
60
xxx)
100
Fig. 2 Graph showing estimated density for temperature of sensor-1 Probability Density Estimation based on 43047 data samples 0.08 0.06 f(x)
In our work, with the help of 30-40 lines of java code, we have derived column vector of single attributes for individual sensors. Each one is having approx. 50000 data samples. These vectors will be used as input dataset for density estimation and outlier detection components. The important features have been calculated in advance as it will be used further. We are describing below the table of features for sensor1.
Min
Max
Mean
Median
0.04 0.02
Table 2: Statistical characteristics for sensor1 Dataset
80 x
0 -10
StdDev
0
10
20
30
40
50
60
50
60
Cumulative Distribution Function 1
Humidity
Voltage
17.195
122.153
39.952
22.144
33.651
-4
50.739
34.321
38.633
13.880
2.006
2.762
2.519
2.582
0.169
F(x)
Temp.
mean(x) = 34.3211 var(x) = 192.867 0.5
0 -10
0
10
20
30
40
x
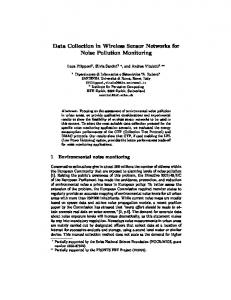
Fig. 3 Graph showing estimated density for humidity of sensor -1 Moreover, we have implemented the following components: 1) 2) 3) 4)
chain-sample, which maintains a running sample of the sensor readings in the window, variance estimator, which maintains a running estimate of the standard deviation of those values, kernel density estimator, which is used to approximate the data distributions, DEVF-based outlier detection algorithm.
Now if we run the outlier detection component on above derived estimation of densities then it will demonstrate the indices of probable outlier present on a particular dataset. In our experiment we have done the same for temperature, humidity and voltage of sensor-1 and found the indices of outliers.
31
International Journal of Computer Applications (0975 – 8887) Volume 5– No.7, August 2010
Probability Density Estimation based on 43047 data samples 4
f(x)
3 2 1 0 1.8
2
2.2
2.4
2.6
2.8
3
Cumulative Distribution Function
6.
F(x)
1
0.5
2
2.2
2.4 x
2.6
2.8
3
Fig. 4 Graph showing estimated density for voltage of sensor-1
5.
REFERENCES
[1] E. Elnahrawy and B. Nath. 2003. Cleaning and Querying Noisy Sensors. In Proc. of the 2nd ACM International conference on WSNA’03, pages 78-87.
mean(x) = 2.51963 var(x) = 0.0288638
0 1.8
estimation) [3]. The basic idea of this method is to compute the distribution of measurement by estimating the coefficients of its Fourier transform [3]. Recent studies and works have shown that wavelet based density estimation techniques promises to be superior to others due to its local nature. Right now we are working for single attribute sensors but in future we will try to extend our method for multi-attribute sensors. And will focus on some other idea for outlier detection for multi-attribute sensors if required.
CONCLUSION AND FUTURE WORK
In this work, we focused on the problem of outlier detection in wireless sensor networks. Outlier detection techniques generally focus the developer’s or user’s context into the interesting events or unexpected results in the network which has very low probability of occurrence. Rather than working on the raw sensor readings at first, a statistical modeling technique transforms it into meaningful information which will yield effective output, hence offering a more reliable way to gain insight into the physical phenomena under observation. For the same, we have proposed a model that is based on the approximation of the sensor data distribution. Our approach takes into consideration various characteristics and features of streaming sensor data. We processed and evaluated our proposed scheme with a set of experiments with datasets which is taken from Intel Berkeley research lab. The experimental evaluation shows that our algorithm can achieve very high precision and recall rates for identifying outliers, and demonstrate the effectiveness of the proposed approach.
[2] Victoria J. Hodge and Jim Austin. 2004. A survey of outlier detection methodologies. Artificial Intelligence Review 22, pages85-126. [3] Christoph Heinz and Bernhard Seeger. 2006. Statistical Modeling of Sensor Data and its application to Outlier Detection. Technical Report 2006/07, University of Stuttgart; 5. GI/ITG KuVS Fachgespräch "Drahtlose Sensornetze", Stuttgart. [4] S. Subramaniam, T. Palpanas, D. Papadopoulos, V. Kalogeraki and D. Gunopulos. 2006. Online Outlier Detection in Sensor Data Using Non-Parametric Models. VLDB’06, September 12-15, Seoul, Korea, pages 187-198. [5] Silverman, B. 1986. Density Estimation for Statistics and Data Analysis. Chapman and Hall. [6] B. Blohsfeld, C. Heinz, and B. Seeger. 2005. Maintaining Nonparametric Estimators over Data Streams. In Proc. of BTW, March 2-4, Karlsruhe-Germany, pages 385-404. [7] http://en.wikipedia.org/wiki/Kernel (statistics). [8] D. W. Scott.1992. Multivariate Density Estimation: Theory, Practice and Visualization. Wiley and Sons, New York. [9] S. Papadimitriou, H. Kitagawa, P. Gibbons and C. Faloutsos. 2003. Loci: Fast Outlier detection using the local correlation integral. In Proc. of the 19th International Conference on Data Engineering (ICDE’03), pages 315-326. [10] http://db.csail.mit.edu/labdata/labdata.html
As future work, we will be focusing on other density estimation techniques like orthogonal series expansion (wavelet density
32