letters to nature movements in Triassic theropod dinosaurs. Nature 339, 141–144 (1999). 8. Gierlin´ski, G. Avialian theropod tracks from the Early Jurassic strata of Poland. Zubia 14, 79–87 (1996). 9. Rainforth, E. C. Late Triassic–Early Jurassic dinosaur ichnofaunas, eastern North America and Southern Africa. J. Vert. Paleo. 21, 91A (2001). 10. Chiappe, L. M. The first 85 million years of avian evolution. Nature 378, 349–355 (1995). 11. Caminos, R., Zamuner, A. B., Limarino, O. C. & Fauque´, L. El Tria´sico superior fosilı´fero en la Precordillera riojana. Rev. Asoc. Geol. Arg. 50, 262–265 (1995). 12. Coughlin, T. J. Linked Orogen-Oblique Fault Zones in the Central Argentine Andes: The Basis of a New Model for Andean Orogenesis and Metallogenesis PhD thesis (Univ. Queensland, 2001). 13. Caminos, R. & Fauque´, L. Geologic sheet 2969-II Tinogasta (1:250,000). Ser. Geol. Min. Arg. (2001). 14. Artabe, A. E., Brea, M. & Zamuner, A. B. Rhexoxylon brunoi Artabe, Brea et Zamuner, sp. nov., a new Triassic Corystosperm from the Paramillo de Uspallata, Mendoza, Argentina. Rev. Palaeobot. Palyn. 105, 63–74 (1999). 15. Gradstein, F. M. et al. ATriassic, Jurassic and Cretaceous time scale. SEPM Spec. Publ. 54, 95–126 (1995). 16. Kent, D. V. & Olsen, P. E. Implications of astronomical climate cycles to the chronology of the Late Triassic. Zbl. Geol. Pala¨ont. 8, 1463–1473 (2000). 17. Pa´lfy, J., Smith, P. L. & Mortensen, J. K. A U-Pb and 40Ar/39Ar time scale for the Jurassic. Can. J. Earth Sci. 37, 923–944 (2000). 18. Currie, P. Bird footprints from the Gething Formation (Aptian, Lower Cretaceous) of northeastern British Columbia, Canada. J. Vert. Paleontol. 1, 257–264 (1981). 19. Lockley, M. G., Yang, S-Y., Matsukawa, M., Fleming, F. & Lim, S-K. The track record of Mesozoic birds: evidence and implications. Phil. Trans. R. Soc. Lond. B 336, 113–134 (1992). 20. Fuentes Vidarte, C. Primeras huellas de aves en el Weald de Soria (Espan˜a). Nuevo icnoge´nero, Archaeornithipus y nueva icnoespecie. A. meijidi. Est. Geol. 52, 63–75 (1996). 21. Doyle, P., Wood, J. L. & George, G. T. The shorebird ichnofacies: an example from the Miocene of southern Spain. Geol. Mag. 137, 517–536 (2000). 22. McCrea, R. T. & Sarjeant, W. A. S. in Mesozoic Vertebrate Life (eds Tanke, D. H. & Carpenter, K.) 453–478 (Indiana Univ. Press, Bloomington/Indianapolis, 2001). 23. Lockley, M. G. The vertebrate track record. Nature 396, 429–432 (1998). 24. Ellenberger, P. Contribution a` la classification des pistes de verte´bre´s du Trias: Les types du Stormberg d’Afrique du Sud (I). Palaeovert. Me´m. Extraordinaire., 1–128 (1972). 25. Weems, R. E. & Kimmel, P. G. Upper Triassic reptile footprints and a coelacanth fish scale from the Culpeper basin, Virginia. Proc. Biol. Soc. Wash. 106, 390–401 (1993). 26. Gierlinski, G. & Sabath, K. Protoavian affinity of the Plesiornis trackmaker. J. Vert. Paleo. 18, 46A (1998). 27. Heckert, A. B. & Lucas, S. G. Global correlation of the Triassic theropod record. Gaia 15, 63–74 (1998).
Acknowledgements This work was funded by the Agencia Nacional de Promocio´n Cientifica y Technologica of Argentina. M. Archangelsky helped during fieldwork. We thank T. Coughlin for sharing unpublished geochronological data. W.A.S. Sarjeant critically read the manuscript and A. Zamuner commented on biostratigraphical implications of the fossil flora.
Competing interests statement The authors declare that they have no competing financial interests.
addressed this issue by training non-human primates to make reaching movements with and without viscous loads applied to the shoulder and/or elbow joints, and then examined neural representations in primary motor cortex (MI) for each load condition. Even though the shoulder and elbow loads are mechanically independent, we found that some neurons responded to both of these single-joint loads. Furthermore, changes in activity of individual neurons during multi-joint loads could be predicted from their response to subordinate single-joint loads. These findings suggest that neural representations of different mechanical contexts in MI are organized in a highly structured manner that may provide a neural basis for how complex motor behaviour is learned from simpler motor tasks. Behavioural studies suggest that the brain uses internal models— neural processes that mimic the characteristics of the body or environment—to predict and generate motor commands for movement1,3, but little is known about neural computations associated with these representations4,5. Here we test two qualitatively distinct hypotheses about the organization in the brain of internal models for different mechanical loads2. One possibility is that internal models for different loads are represented within a single controller that encapsulates all possible loads (Fig. 1a). A second possibility is a more modular scheme in which multiple controllers co-exist, each suitable for one context (or a small set of contexts) (Fig. 1b). These two hypotheses predict differences in how individual neurons in the brain respond when loads are applied in a given motor task: either a cell consistently changes activity for all mechanical loads (former), or it changes activity only for one or a subset of loads (latter). We tested these two alternatives using a reaching task with different dynamic loads, and recorded neuronal activity in MI, a region intimately involved in volitional motor control where cells often respond to changes in force output4–8. We trained monkeys to wear a robotic exoskeleton (KINARM) that permitted horizontal limb movements using flexion and extension motions at the shoulder and elbow9,10. Monkeys made reaching movements without loads (NL) and with one of three
Correspondence and requests for materials should be addressed to R.N.M. (e-mail:
[email protected]).
..............................................................
Overlap of internal models in motor cortex for mechanical loads during reaching Paul L. Gribble* & Stephen H. Scott Department of Anatomy and Cell Biology, CIHR Group in Sensory-Motor Systems, Centre for Neuroscience Studies, Queen’s University, Kingston, Ontario K7L 3N6, Canada .............................................................................................................................................................................
A hallmark of the human motor system is its ability to adapt motor patterns for different environmental conditions, such as when a skilled ice-hockey player accurately shoots a puck with or without protective equipment. Each object (stick, shoulder pad, elbow pad) imparts a distinct load upon the limb, and a key problem in motor neuroscience is to understand how the brain controls movement for different mechanical contexts1,2. We * Present address: Department of Psychology, The University of Western Ontario, London, Ontario N6A 5C2, Canada
938
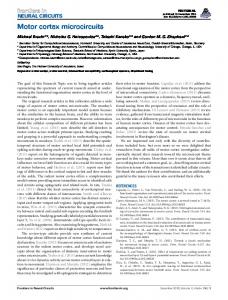
Figure 1 Two hypotheses about the neural control of different mechanical loads. A singlecontroller that encapsulates all load contexts (a), or multiple controllers, each of which represent individual loads (b). c, Experimental design used to assess the neural representation of multiple loads. A robotic exoskeleton applied velocity-dependent (viscous) loads to the monkey’s arm during reaching movements. Viscous shoulder (VS) and viscous elbow (VE) are mechanically independent loads. Viscous both (VB) is the superposition of viscous shoulder and viscous elbow loads.
© 2002 Nature Publishing Group
NATURE | VOL 417 | 27 JUNE 2002 | www.nature.com/nature
letters to nature velocity-dependent loads (Fig. 1c): one where loads are applied at the shoulder only (viscous shoulder, VS), one where loads are applied at the elbow only (viscous elbow, VE), and a superposition of the two single-joint loads (viscous both, VB). Single-joint loads were created easily with this device, as forces are applied directly on the limb segments rather than at the hand. VS and VE loads allow us to address whether mechanically independent loads are represented by distinct populations of neurons or distributed across a single population in MI. Moreover, because VE and VS are both mechanically subordinate to VB, we can also explore whether or not the representation of a complex load (VB) can be generated from simpler representations (VE and VS). A key to these studies was to ensure that the kinematics of reaching remained similar between mechanical conditions, so that changes in neural activity could be related to a representation of the mechanical load and not features of movement kinematics (Supplementary Information). A total of 101 cells in primary motor cortex were recorded from three monkeys (see Methods) in the NL condition and all three load conditions (monkey A, 44; monkey B, 18; monkey C, 39). Over half of these cells (55 of 101) showed significant changes in firing rate relative to their activity in NL, for at least one movement direction and one load condition (P , 0.05, analysis of variance, ANOVA; monkey A, 28; monkey B, 13; monkey C, 14). These changes in activity are not solely due to afferent feedback because 19 cells showed significant changes in firing rate before movement onset (150–0 ms before movement onset). Figure 2 shows typical
responses for two cells, one that increased its activity (a, c, e) and another that decreased its activity (b, d, f) for VE and VB. Although the presence of the viscous loads required an increase in muscle force to oppose the load (see below), half of the cells that showed statistically significant changes in mean firing rate decreased their mean discharge during movement (Fig. 3a). These decreases in discharge may partially reflect reductions in co-contraction of antagonistic muscles with loads11,12. As observed in previous load studies4, changes in activity with load (increases or decreases) tended to occur along each cell’s preferred direction, the direction of movement with maximal activity during unloaded reaching (Fig. 3b). We found that 48 cells responded to at least one of the two singlejoint loads, with 8, 26 and 14 cells responding to VS only, VE only or to both loads, respectively. The proportion of cells responding to both single-joint loads is larger than predicted if each load was randomly represented across our cell sample (x 2 ¼ 6.8, P , 0.01). Moreover, there was a highly consistent relationship between how a cell changed its activity for VS and VE (n ¼ 48, r 2 ¼ 0.65, P , 0.001). Cells that increased discharge for VS also tended to increase discharge for VE, while decreases were likewise associated (top projection plane in Fig. 4a). An important point is that 31 of the 38 cells that responded to the multi-joint load (VB) also responded to either of the mechanically subordinate single-joint loads (VS or VE). This is much higher than expected if single and multi-joint loads were each randomly
Figure 2 Neural activity of two cells during movement in different dynamic loads. a,b, Each set of rasters shows the discharge of a cell in each of 15 (a) or 10 (b) repeat trials in the no-load condition and in each viscous load, for a single reaching movement forward (target 3, see e inset). Vertical bars denote (from left to right) target onset, movement onset, peak velocity and movement end. Data are aligned to movement onset, indicated by vertical arrows. c,d, Mean discharge over time in the four load conditions, computed using a 50-ms sliding window every 20 ms. e,f, Mean discharge between 150 ms before movement onset and peak velocity in each load condition, for movements to eight targets (see inset, e). Vertical bars indicate one standard error. Red asterisk, P , 0.05. a,c,e, Shows a cell (no. 034) from monkey B that increased discharge for VE and VB loads; b,d,f shows a cell (no. 017) from monkey A that decreased discharge for VE and VB loads.
Figure 3 Changes in cell activity across three load conditions. a, Mean discharge between 150 ms before movement onset to peak velocity during unloaded reaching movements (NL) versus change in activity between unloaded and loaded conditions. Large red, blue and green dots denote significant changes in activity associated with VE, VS and VB conditions, respectively (P , 0.05, ANOVA). Small black dots denote non-significant changes. b, Histogram of the distribution of load-related preferred directions (PD) relative to each cell’s PD for unloaded reaching. Inset panel illustrates this distribution using individual lines of orientation for each load-related PD relative to each cell’s PD for unloaded reaching, which has been arbitrarily rotated to the right in the figure.
NATURE | VOL 417 | 27 JUNE 2002 | www.nature.com/nature
© 2002 Nature Publishing Group
939
letters to nature represented across our cell sample (x 2 ¼ 28.3, P , 0.01). Moreover, a categorical analysis such as ANOVA fails to capture fully the consistency of the coupling between each cell’s response for VB and its associated responses for VS and VE. Figure 4 illustrates this robust linkage; the observed change in discharge (relative to NL) for VB is plotted against the corresponding changes in discharge for VS and VE. A notable result is that almost all cells (45/55, 82%) are located in only two of the eight possible quadrants (x 2 ¼ 98.0, P , 0.001). These two quadrants reflect cell responses where cells either increased (22 cells, green dots) or decreased (23 cells, red dots) their discharge compared to NL in all three load conditions. We have previously found that multi-joint postural loads could be predicted from single-joint loads using a vector summation model which supposes that neural activity can be represented by a
coordinate frame with the shoulder and elbow each representing orthogonal axes13. This vector model also predicted the response of neurons during VB based on each cell’s response during VS and VE conditions (r 2 ¼ 0.81, P , 0.001; slope of best fit similar to unity, P . 0.05; Fig. 4b). A linear summation model was also attempted, in which the change in discharge for VB was assumed to equal the sum of the changes in VS and VE. Although there was a consistent and statistically significant relationship between predicted and actual cell discharge using the linear model (r 2 ¼ 0.81, P , 0.001), this model tended to overestimate cell discharge in VB (paired t-test, P , 0.01; slope of best fit 1.6, P , 0.0001). Electromyographic (EMG) activity of forelimb muscles shared some but not all features observed for MI cells (Supplementary Information). Unlike MI cells, almost all muscles (55/57) changed activity for at least one mechanical load, and 24 changed activity for all three. In addition, EMG changes were predominantly (78%) increases in activity, whereas there was almost an equal number of neurons that either increased or decreased their activity with loads (x 2 ¼ 18.2, P , 0.001). Thus our observations in MI cannot be explained solely on the basis of muscle activation patterns. The present results provide details on how internal models for different velocity-dependent loads are represented in the discharge patterns of cells in MI. In theory, the multi-joint and the two singlejoint loads could each have been represented by separate population of neurons (that is, separate neural modules). However, we found substantive overlap in representations, particularly between multijoint and subordinate single-joint loads, suggesting that neural activity in MI behaves like a single controller (that is, a single internal model) for these different contexts. Further, there was a partial overlap in the representations of the two single-joint load conditions that may partially reflect the coarse somato-motor map in primary motor cortex14 and the fact that some motor-cortical cells are related to multiple muscles spanning different joints15. Although other regions of the brain, such as cerebellum, may use a more modular organization for multiple mechanical contexts16,17, the output from these other regions is presumably integrated to form the representations that we observed in MI. Finally, our results suggest that internal models for simpler loads are combined to form models for more complex loads, and may explain why training on simpler tasks can be transferred and improve performance on related, more complex tasks18,19. A
Methods Experiments
Figure 4 Neural representation of mechanically dependent loads. a, Relationship between cell discharge change (relative to no load) in VS, VE and VB loads for the 55 cells (out of 101 recorded in 3 monkeys in all 4 conditions) that showed significant changes in discharge in at least one movement direction for at least one load condition (VS, VE or VB). Neural responses were highly consistent across the different load conditions. Significant relationships were observed between cell discharge change in VS versus VE (r 2 ¼ 0.66, P , 0.0001), VS versus VB (r 2 ¼ 0.62, P , 0.0001) and VE versus VB (r 2 ¼ 0.83, P , 0.0001). Data plotted for each cell represent the movement direction showing the greatest absolute change in mean discharge. Green dots, data from cells that increased discharge in all three loads; red dots, cells that decreased discharge in all three loads; black dots, cells that showed other patterns. b, Predicting neural activity for a multi-joint load. The change in discharge (from NL) in VB is plotted against predicted discharge change using a vector combination of neural activity in individual single-joint component loads (DVB ¼ (DVS2 þ DVE2)1/2). The model successfully predicts a neuron’s response in VB using a combination of its activity in VS and VE (r 2 ¼ 0.81, P , 0.001). Solid red line is line of best fit, dashed line represents y ¼ x. A linear model (c) tended to overestimate cell discharge in VB. 940
Three male rhesus monkeys (Macaca mulatta, 6–7 kg) were trained to wear a robotic exoskeleton (KINARM) and move from a central target to one of eight peripheral targets located on the circumference of a circle9,10. Training included experimental conditions NL, VS, VE and VB (see text). In all cases, the torques applied by KINARM were negatively proportional to joint velocity, and opposed joint rotation, and no load was applied when the limb was stationary. Monkeys were fully trained to perform these movements consistently in all load conditions before neural recordings were initiated. Rigorous spatial and temporal accuracy requirements were imposed during both training and recording sessions to ensure that movement kinematics were held constant across all load conditions (Supplementary Information). All experimental procedures were approved by the Queen’s University Animal Care Committee.
Data recording Recording chambers were surgically implanted under isoflurane anaesthesia, and conventional techniques were used for extracellular recording of single-neuron activity in the proximal arm representation of primary motor cortex contralateral to the arm used to perform reaching movements10,20. Cell activity and several measures of limb motion were typically recorded in six repeat trials for each of the movement targets in a pseudo-random block design. In subsequent data analyses, the first movement to each target was excluded. In the first two monkeys (A and B), neural activity was recorded for movement to eight targets, selected specifically to sample roughly equal intervals in joint-torque space. These directions in torque-space correspond to the following directions in hand-space: 458, 67.58, 908, 1808, 247.58, 2708, 3058 and 327.58, where 08 is to the right, and positive rotation is anticlockwise (see Fig. 2e and Supplementary Information for diagram). Initially a block of 48 trials (8 targets £ 6 repeat trials) was recorded in the NL condition, followed by three blocks of 48 trials in the VS, VE and VB conditions, respectively, where the order of the three loads was randomized for each cell. Finally, as a control for time-dependent changes in cell activity, a second block of trials in the NL condition was recorded after the
© 2002 Nature Publishing Group
NATURE | VOL 417 | 27 JUNE 2002 | www.nature.com/nature
letters to nature completion of the three viscous load conditions (Supplementary Information). Monkey C was trained to perform movements with loads to eight directions uniformly distributed in hand-space. In order to save time during the viscous load conditions, neural activity was recorded only to targets at 908 and 2708, directions associated with large shoulder and elbow rotations, and thus large loads (Supplementary Information).
Acknowledgements
Data analysis
Competing interests statement
Cell activity was represented as the number of action potentials recorded between 150 ms before movement onset (defined on the basis of 5% of peak tangential hand velocity) and peak tangential hand velocity. Muscle torques at the shoulder and elbow were computed using inverse dynamics9. Differences in mean cell discharge were assessed between load conditions and across movement directions using two-way ANOVA followed by individual comparisons between means using a Bonferroni correction for multiple comparisons. For monkeys A and B, differences were considered significant at P , 0.0021 (P , 0.05 / 24 comparisons: 8 target directions £ 3 load conditions); for monkey C differences were considered significant at P , 0.0083 (P , 0.05 / 6 comparisons: 2 targets £ 3 loads). All probability values reported in the text represent Bonferronicorrected values. The preferred direction (PD), the direction of maximal activity, of each cell for unloaded reaching movements was computed10,21. We also defined a load-related PD based on the absolute change in cell activity between NL and each load condition. In this case, the preferred direction signified the largest change (either increase or decrease) in activity. Bootstrap techniques were used to identify whether these directional signals were statistically significant (P , 0.01)10,20. In each monkey, the EMG activity of up to 16 forelimb muscles (mono- and biarticular muscles spanning shoulder and elbow) was recorded during conditions NL, VB, VS and VE. Pairs of single-strand wires were inserted percutaneously in monkeys A, B and C, and pairs of multi-strand wires were implanted chronically in monkeys A and C under aseptic conditions10,22. Some muscles were sampled twice in monkeys A and C, once using chronically implanted wires and a second time using percutaneously inserted wires providing a total of 57 samples of EMG (Supplementary Information).
The authors declare competing financial interests: details accompany the paper on Nature’s website (http://www.nature.com).
Received 25 January; accepted 16 April 2002; doi:10.1038/nature00834. 1. Wolpert, D. M. & Ghahramani, Z. Computational principles of movement neuroscience. Nature Neurosci. 3 suppl., 1212–1217 (2000). 2. Wolpert, D. M. & Kawato, M. Multiple paired forward and inverse models for motor control. Neural Netw. 11, 1317–1329 (1998). 3. Shadmehr, R. & Mussa-Ivaldi, F. A. Adaptive representation of dynamics during learning of a motor task. J. Neurosci. 14, 3208–3224 (1994). 4. Kalaska, J. F., Cohen, D. A., Hyde, M. L. & Prud’homme, M. A comparison of movement directionrelated versus load direction-related activity in primate motor cortex, using a two-dimensional reaching task. J. Neurosci. 9, 2080–2102 (1989). 5. Gandolfo, F., Li, C., Benda, B. J., Schioppa, C. P. & Bizzi, E. Cortical correlates of learning in monkeys adapting to a new dynamical environment. Proc. Natl Acad. Sci. USA 97, 2259–2263 (2000). 6. Kalaska, J. F., Scott, S. H., Cisek, P. & Sergio, L. E. Cortical control of reaching movements. Curr. Opin. Neurobiol. 7, 849–859 (1997). 7. Porter, R. & Lemon, R. Corticospinal Function and Voluntary Movement (Oxford Univ. Press, Oxford, 1995). 8. Ashe, J. Force and the motor cortex. Behav. Brain Res. 87, 255–269 (1997). 9. Scott, S. H. Apparatus for measuring and perturbing shoulder and elbow joint positions and torques during reaching. J. Neurosci. Methods 89, 119–127 (1999). 10. Scott, S. H., Gribble, P. L., Graham, K. M. & Cabel, D. W. Dissociation between hand motion and population vectors from neural activity in motor cortex. Nature 413, 161–165 (2001). 11. Humphrey, D. R. & Reed, D. J. in Motor Control Mechanisms in Health and Disease Advances in Neurology no. 39 (ed. Desmedt, J.) 347–372 (Raven, New York, 1983). 12. Fetz, E. E., Cheney, P. D., Mewes, K. & Palmer, S. in Peripheral Control of Posture and Locomotion (eds Allum, J. A. H. & Hulliger, M.) 437–449 (Elsevier, New York, 1989). 13. Cabel, D. W., Cisek, P. & Scott, S. H. Neural activity in primary motor cortex related to mechanical loads applied to the shoulder and elbow during a postural task. J. Neurophysiol. 86, 2102–2108 (2001). 14. Sanes, J. N. & Schieber, M. H. Orderly somatotopy in primary motor cortex: does it exist? Neuroimage 13, 968–974 (2001). 15. McKiernan, B. J., Marcario, J. K., Karrer, J. H. & Cheney, P. D. Corticomotorneuronal postspike effects in shoulder, elbow, wrist, digit, and intrinsic hand muscles during a reach and prehension task. J. Neurophysiol. 80, 1961–1980 (1998). 16. Imamizu, H. et al. Human cerebellar activity reflecting an acquired internal model of a new tool. Nature 403, 192–195 (2000). 17. Wolpert, D. M., Miall, R. C. & Kawato, M. Internal models in the cerebellum. Trends Cogn. Sci. 2, 338–347 (1998). 18. Schmidt, R. A. & Wrisbert, C. A. Motor Learning and Performance: A Problem-Based Learning Approach (Human Kinetics, Champaign, 2000). 19. Wightman, D. C. & Lintern, G. Part-task training for tracking and manual control. Hum. Factors 27, 267–283 (1985). 20. Scott, S. H. & Kalaska, J. F. Reaching movements with similar hand paths but different arm orientations. I. Activity of individual cells in motor cortex. J. Neurophysiol. 77, 826–852 (1997). 21. Gribble, P. L. & Scott, S. H. Method for assessing directional characteristics of non-uniformly sampled neural activity. J. Neurosci. Methods 113, 187–197 (2002). 22. Loeb, G. E. & Gans, C. Electromyography for Experimentalists (Univ. Chicago Press, Chicago, 1986).
Supplementary Information accompanies the paper on Nature’s website (http://www.nature.com/nature). NATURE | VOL 417 | 27 JUNE 2002 | www.nature.com/nature
We thank K. Moore for technical assistance, and D.W. Cabel and S. Chan who assisted in some of the training and neuronal recording sessions. We thank D. Munoz, M. Pare and K. Rose for comments on this manuscript. This work was supported by a CIHR grant and scholarship (S.H.S.) and a CIHR postdoctoral fellowship (P.L.G.).
Correspondence and requests for materials should be addressed to S.H.S. (e-mail:
[email protected]).
..............................................................
Oligodendrocyte-myelin glycoprotein is a Nogo receptor ligand that inhibits neurite outgrowth Kevin C. Wang*†, Vuk Koprivica*†, Jieun A. Kim*, Rajeev Sivasankaran*, Yong Guo‡, Rachel L. Neve†§ & Zhigang He*† * Division of Neuroscience, Children’s Hospital, and † Program in Neuroscience, Harvard Medical School, 320 Longwood Avenue, Boston, Massachusetts 02115, USA ‡ Aventis Pharmaceuticals, Bridgewater, New Jersey 08807, USA § McLean Hospital, 115 Mill Street, Belmont, Massachusetts 02478, USA .............................................................................................................................................................................
The inhibitory activity associated with myelin is a major obstacle for successful axon regeneration in the adult mammalian central nervous system (CNS)1,2. In addition to myelin-associated glycoprotein (MAG)3,4 and Nogo-A5–7, available evidence suggests the existence of additional inhibitors in CNS myelin8. We show here that a glycosylphosphatidylinositol (GPI)-anchored CNS myelin protein, oligodendrocyte-myelin glycoprotein (OMgp), is a potent inhibitor of neurite outgrowth in cultured neurons. Like Nogo-A, OMgp contributes significantly to the inhibitory activity associated with CNS myelin. To further elucidate the mechanisms that mediate this inhibitory activity of OMgp, we screened an expression library and identified the Nogo receptor (NgR)9 as a high-affinity OMgp-binding protein. Cleavage of NgR and other GPI-linked proteins from the cell surface renders axons of dorsal root ganglia insensitive to OMgp. Introduction of exogenous NgR confers OMgp responsiveness to otherwise insensitive neurons. Thus, OMgp is an important inhibitor of neurite outgrowth that acts through NgR and its associated receptor complex. Interfering with the OMgp/NgR pathway may allow lesioned axons to regenerate after injury in vivo. To examine whether any GPI-linked proteins in CNS myelin act as inhibitors of neurite outgrowth, we treated purified myelin from bovine white matter with phosphatidylinositol-specific phospholipase C (PI-PLC) and examined the released proteins for their ability to alter growth cone morphology in an assay of growth cone collapse using dorsal root ganglia from chicks at embryonic day 13 (E13 DRG)6,9,10. PI-PLC-released proteins from CNS myelin exhibited marked growth cone collapsing activity (Fig. 1). By SDS– polyacrylamide gel electrophoresis (PAGE) and silver staining, we found that a band of relative molecular mass about 110,000 (M r ,110K) was significantly enriched in this fraction (Fig. 2a). Because the size of this band was similar to that of a previously identified CNS myelin protein, OMgp11,12, we used anti-OMgp antibodies to detect enrichment of cleaved OMgp in the PI-PLC supernatants by western blot. Anti-OMgp antibodies detected a band of comparable size in the PI-PLC-treated supernatants
© 2002 Nature Publishing Group
941