service (DoS) attacks on major web-sites has highlighted this need even further. ..... send back custom messages to the web clients, a queue length threshold ...
Overload Control Mechanisms for Web Servers Ravi Iyer, Vijay Tewari and Krishna Kant
f
j
j
g
Server Architecture Lab, Intel Corporation, Beaverton, OR ravishankar.iyer vijay.tewari krishna.kant @intel.com
Abstract:
Web servers often experience overload situations due to the extremely bursty nature of Internet traffic, popular online events or malicious attacks. Such overload situations significantly affect performance and may result in lost revenue as reported by the recent denial of service attacks. Overload control schemes are well researched and understood in telecommunication systems. However, their use in web servers is currently very limited. Our focus in this paper is to propose effective overload control mechanisms for web servers. An important aspect in overload control is to minimize the work spent on a request which is eventually not serviced due to overload. This paper studies three simple schemes for controlling the load effectively. The first scheme selectively drops incoming requests as they arrive at the server using an intelligent network interface card (NIC). The second scheme provides feedback to a previous node (proxy server or ultimate client) to allow a gapping control that reduces offered load under overload. The third scheme is simply a combination of the two. The experimental results show that even these simple schemes are effective in improving the throughput of the web server by 40% and response time by 70% under heavy overloads, as compared with the case without any overload control.
1 Motivation The exploding use of web-based user interfaces for conducting business on the Internet has brought to focus the problem of dealing with overloads to which the web servers (especially those that form the front end of an e-commerce site) are subjected to. This paper motivates the need for overload control and presents results of some preliminary experiments on overload control. It is well-established by now that Internet traffic is very bursty over a large range of timescales and shows asymptotic self-similarity and multi-fractal behavior at intermediate time scales. For example, our study of web-server request process in [2] shows that the busy-period traffic is asymptotically self-similar with a Hurst parameter of around 0.8. Several studies have also shown that WAN traffic is multifractal in nature [15, 3]. Informally, self-similarity and multifractal behavior imply that there is considerable bunching of requests as they arrive at the server. Such an arrival process is known to lead to heavy-tailed queue-length distribution, which means that unless the web server is engineered for a rather low average operating load, it will experience huge swings in response times and may occasionally experience queue overflows (and the consequent “server-too-busy” errors sent to clients).
Our recent analysis of e-commerce sites suggests that e-commerce traffic usually cannot be assumed to be stationary for more than 10-15 minutes [4]. Nonstationarity further exacerbates loading problems on the web server and consequently degrades user experiences. In addition, ecommerce sites are increasingly affected by special events either directly (e.g., promotional sale held by the site itself) or indirectly (e.g., championship game broadcast by television along with advertisements that direct viewers to the site). Such events can easily subject the front ends (i.e., web servers) of the e-commerce sites to loads that are an order of magnitude higher than normal loads, and thus cannot be handled by conservative engineering practices. The massive overload of Victoria Secret’s web site during the last Superbowl illustrates this point very well. All these characteristics call for effective overload control of web servers. The recent denial of service (DoS) attacks on major web-sites has highlighted this need even further. The DoS attacks are usually carried out by a simple program, usually replicated on a large number of clients, that sends out a barrage of HTTP requests to the web-site and overloads it. Obviously, combating such DoS attacks requires an overload control scheme that can reject requests selectively from misbehaving clients. This would require rather sophisticated overload controls, which can be built on the foundation laid in this paper. The outline for the rest of the paper is as follows. Section 2 discusses load management schemes both in the context of telecommunications systems (where they are most well developed) and as they are currently employed by the web servers. Section 3 describes the experimental setup, Section 4 presents the overload control methods that were tested, and section 5 presents the results. Finally, section 6 concludes the paper and discusses areas for further work.
2 Overview of Overload Control Mechanisms Overload control is a very well-researched topic in telecommunications systems, and a carefully designed overload control scheme is a part of every level of the SS7 signalling stack [10, 11, 12, 8]. In particular, telecommunications signalling nodes use a hierarchical structure to isolate each SS7 layer from congestion at other layers. Also, every signalling link, its associated processor, all network level (MTP3) processors, and all application level (ISUP/BISUP or TCAP) processors are protected by appropriate congestion control mechanisms. This section first discusses the general structure of these overload control schemes, and then points out special considerations for applying them to web-servers.
2.1 Overload control in Telecommunications Systems The signalling network used in telecommunications systems (SS7) is a datagram network where most telephony related services do not establish any explicit virtual circuit for an end to end reliable communication. Only the link-layer uses transparent retransmissions to cope with (link level) errors; higher layers (including application) depend on other mechanisms such as timeouts, redundant messages, and explicit repetition of certain messages for lost/corrupted/duplicated/delayed messages. This approach is different from the web-server environment where the transport (TCP) layer is supposed to provide transparent protection against all losses/duplications of messages.
Such a behavior considerably complicates feedback overload control as discussed later in the paper. In the following, overload control schemes are described in general terms. Details of specific schemes for link, network and application level congestion control may be found in [10]. The overload control is typically effected by defining 3 thresholds for the monitored parameter (e.g., CPU queue length) (a) abatement, (b) onset, and (c) discard. When the onset threshold is crossed from below, a feedback message is sent out towards the traffic source to request cut-down in the traffic. The traffic throttling happens at some control node, which is usually just the previous node, but could in principle be any node on the path back to the source, including the source itself. If the discard threshold is crossed before the traffic has been adequately cut-down, the excess traffic is simply discarded. Once the onset threshold is crossed, feedback messages continue to be sent until the monitored parameter goes below the abatement threshold. The motivation of continuous feedback is both to guard against dropped feedback messages and also to effectively handle rapidly fluctuating loads. In order to limit the feedback related overhead, most schemes don’t send feedback for every message. Instead, they may send feedback for every n messages or every � seconds, where n or � are parameters of the control mechanism. One crucial aspect in overload control is the amount of resources expended on calls that are eventually dropped. Since setting up/tearing down a call involves a sequence of signalling messages, it helps to be more reluctant to drop messages well into the call setup process. Also, it undesirable to drop messages related to call teardown, since processing those messages would release resources. This brings in the concept of congestion priorities for various messages. That is, depending on their expected importance, messages are assigned congestion priorities for the purposes of overload control. Congestion priorities need not be identical to scheduling priorities at the server; for example, the server may process all accepted messages in a FCFS manner but give high congestion priorities to important messages so that they are unlikely to be dropped. Congestion priorities are implemented by using a separate sequence of abatement (Ai ), onset (Oi ) and discard (Di ) threshold for each priority level i. (Assuming that higher i represents higher congestion priority, one typically uses Ai+1 > Di .) The feedback message indicates the priority level at which onset threshold has been crossed. The highest onset level crossed essentially indicates the priority level such that all messages of same and lower priority are to be throttled. Even when only one congestion priority is used, it may be useful to have a sequence of increasing onset levels, such that crossing level Oi indicates a “severity-level” of i to the control node. This can be used by the control node for deciding the how much traffic to throttle. The SS7 application-level congestion control mechanisms known as automatic congestion control (ACC) and automatic code gapping (ACG) use such an approach. The severity level is typically used in one of the following two ways for traffic throttling at the control node: 1. Percentage throttling: Traffic is throttled probabilistically (with higher drop probability at higher severity level). 2. Gapping control: The severity level is translated into a “gap” (i.e., minimum time between successive requests) and this gap is enforced by dropping all non-conforming requests.
Many considerations go into setting various congestion thresholds including feedback delays (which decides spacing between onset and discard thresholds), maximum acceptable response time (which decides location of onset threshold), probability of the queue running empty (which decides the abatement threshold), etc. These considerations apply in the web-server context as well, but a full discussion of these is beyond the scope of this paper.
2.2 Overload Control in Web servers Before considering overload controls, let us first note a few important distinctions between webservers and SS7 signalling nodes. Unlike the latter, current web servers have a monolithic architecture, with most of the processing performed on the main processor. A direct consequence of monolithic structure is large overhead associated with bringing a request up to the application layer. (The current architecture also results in unexpected bottlenecks which makes explicit overload control even more important [1].) In particular, an incoming packet will result in I/O interrupt handling, TCP processing, message assembly, possibly a copy from kernel to user space, and message analysis at the HTTP level, before the request can actually be dropped. This “wasted effort” would result in an unstable situation where the throughput continues to degrade as a function of overload amount. This is a critical consideration in any practical overload control scheme for web-servers. As the Web server architecture matures, it is expected that different software layers would run on different physical processors, which would make the task of isolating each processor easier. In fact, driven by the needs for QoS support, IPSec support [6], offloading of protocol processing from the main processor, etc., more distributed approaches are emerging rapidly. One such approach is to have several special purpose processors connected via a highspeed, low latency interconnect (e.g. InfiniBandTM ) for assisting the main processor (e.g., for TCP processing, security processing, etc.). Concurrently, the intelligence is percolating down into “protocol processors” and intelligent NICS that can do packet classification, packet forwarding, partial TCP processing (e.g., TCP checksums), etc. Assuming that these processors do not themselves get bottlenecked, much of the overhead of dropping packets is eliminated and good overload performance can be achieved. The experiments reported here used such a setup. It is important to note, however, that much of the benefit of overload control can also be achieved by implementing packet classification and dropping in the driver software of an ordinary NIC. The overload control mechanisms in place in current web servers are rather rudimentary. Often, the only overload control technique is to return the HTTP server too busy message if the HTTP server queue exceeds some threshold. It is then up to the client to decide whether it wants to retry the request and with how much delay. A more sophisticated scheme is to do admission control at a node in front of the server farm (e.g., a load-balancer), so that web-servers don’t have to deal with excess requests. Such an approach does not result in any wasted work on the web servers, however, it requires HTTP processing capability in the front end, which is used more and more as the overload increases. Thus, the detrimental effect of overload (i.e., wasted work) occurs at the front end, which is highly undesirable. More sophisticated load balancers also try to do balancing between multiple clusters of web-servers, perhaps located in geographically diverse areas [14, 13]. The geographical diversity allows the use of spare capacity in another region if the servers in one region are overwhelmed. It is also possible to exploit geographically distributed
servers in minimizing the effects of network congestion and delays. Although sophisticated loadbalancing can help considerably in alleviating overloads caused by the highly variable nature of the web traffic, it must be noted that load-balancing cannot replace proper overload control. Thus, a good overload control is essential for commercial grade servers even with load-balancing. Moreover, for small (e.g., single node) web-servers where load-balancing does not apply, or when not all servers can handle all web-pages, overload control becomes even more essential. In this paper, a direct implementation of overload control on the web-server is explored without necessarily assuming the presence of a “front-end” node that does admission control or load balancing. The motivation is to decentralise the rather heavy duty tasks of packet classification (needed for QoS based overload control), maintaining information on TCP sessions in progress, maintaining status about (possibly a large number of) traffic sources, etc. With the availability of intelligent NICs, packet classification and dropping can be done on each server without incurring significant “wasted work”. Also, instead of directly sending “server-too-busy” message from the server application level to the client application, lower level feedback messages are sent which can be used either for throttling the traffic or for simply indicating “server too busy” on the client end. Whenever feasible, the feedback is sent to a server on the path back to the client (e.g., the front-end load balancer, a proxy server, firewall, re-director node, etc.) so that traffic throttling can be effected easily. Dropping traffic as close to the source as possible helps cut down unnecessary traffic through the network. As noted in the last subsection, a major difference between web-servers and SS7 nodes in terms of overload control issues is the connection oriented (TCP) environment. In an SS7 node, it is usually okay to simply drop any messages that cannot be handled since this would eventually result in a dropped call and subsequent retry by the user. In contrast, dropping a packet over TCP layer results in repeated attempts by the other side to retransmit the packet. The TCP-initiated retries are more troublesome because of much smaller gaps between retries compared to retries by a human and the overhead of maintaining the connection related information. A feedback mechanism that can avoid automatic retries in this case would be very helpful, but would surely require some changes to the default TCP behavior. Although the use of intelligent NICs in a monolithic server allows dropping of packets without incurring much overhead on them, it introduces a mismatch between the relevant data units that the application layer may wish to drop (i.e., an entire message) and the data units that the NIC deals with (i.e., packets). Although most requests to a web-server fit in one ethernet packet, a general solution demands that all packets corresponding to a request be identified and dropped. When there is a one to one mapping between TCP connections and application layer requests, this mismatch is easy to handle. In particular, by dropping the TCP connection request (i.e., the SYN message), the entire data exchange is avoided. However, a TCP connection may be used for multiple application level data transfers (using keep-alive feature of HTTP/1.0 or by default in HTTP/1.1). In such a case, overload control can be considered at two levels of granularity: (a) TCP connection level, and (b) HTTP transaction level. If the time for which the TCP connection remains open is well-bounded, a connection level control is not only adequate but also highly desirable. However, if a single TCP connection is left open for an entire user session, a connection level control is clearly flawed. The increasing use of secure HTTP protocol for safeguarding sensitive transactions at e-commerce sites illustrates both of these extremes. Secure HTTP trans-
actions typically use secure socket layer (SSL) which involves 3-4 rounds of message exchanges between the client and the server for mutual authentication and key exchange, followed by one or more data transfers [7]. In some environments, such as on-line retailing, a secure channel is needed only for purchase related transactions and therefore the duration of a secure HTTP session is well-bounded. A connection level control would work the best in this case. However, in certain other applications such as on-line banking, the entire user session is secured by going through the handshake process only in the beginning and then keeping the TCP connection open. In such cases, it may be unreasonable to keep additional users out until those already in are done. In order to do transaction level control, the intelligent NIC needs to examine the IP header of the packets and recognize packets belonging to the same message. Thus dropping all packets of a request is straightforward. However as stated earlier this interferes with the normal TCP functioning and the only way to handle this situation is for the intelligent NIC to be able to generate special type of acknowledgements that are treated by TCP as true acknowledgements, but delivered to the application layer as indications of packet drops. In situations where certain classes of requests involve only a few transactions whereas other involve many, it may be desirable to implement both connection and transaction level controls simultaneously. If no such a priori classification exists and the number of transactions per connection varies widely, transaction level controls would have to be implemented. The discussion above indicates that overload control for exchanges in a connection oriented environment is difficult and would require changes to the transport layer so that proper feedback can be generated by the intelligent NIC and acted upon properly on the receive end. The feedback itself can be provided using a UDP channel and is easy to handle. Given a wide deployment of TCP, any changes to it need to be evaluated carefully. Also, in more general internet servers that use both TCP and UDP for data exchange (e.g., streaming media servers), the impact of overload control (or more appropriately admission control) must be examined on both types of transport. A related issue is of how feedback should be used by the ultimate clients (or browsers), where a direct traffic throttling makes no sense. The browsers could either transparently convert the feedback into a “server-too-busy” message to the user, or attempt to filter attempts by the user in repeatedly hitting the same site under overload conditions.
3 Experimental Methodology and Setup This section describes the experimental setup that was used for performing overload control experiments, including such essential components as packet classification, overload detection, feedback mechanism, and traffic throttling policies used. It may be noted that the main purpose of this paper is to demonstrate the advantages of overload control in web-servers and to highlight the need for appropriate O/S and protocol support, rather than to explore the policy or parameter space for optimal overload performance. The latter issues need to be examined for each application environment and are beyond the scope of this paper. Also, the experiments address only the simple environment where each connection carries just one request, and thus there is no need to distinguish between connections and the request within a connection.
0 1 000 111 0 1 000 111 0 1 0 1 1111 0000 0 1 0000 1111 0 1 0 1 0 1 0000 1111 0 1 0000 1111 0 1 0000 1111 0 1 0000 1111 0 1 0000 1111
Web Server (IIS 4.0 on WinNT 4.0 Server)
100 Mbps Network
Uncontrolled Clients
Controlled Clients Web Users
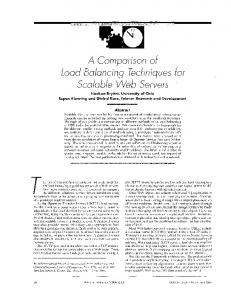
Figure 1: Experimental Setup
3.1 System Configuration Our experimental setup consists of a few clients and a web server as illustrated in Figure 1. The web server was running Microsoft Internet Information Service 4.0 (Web server) on Windows NT 4.0 and equipped with 4 NICs (Network Interface Cards) designed to operate on 100 Mbps ethernet. In order to allow targeting a desired amount of load on each NIC, each of them was configured on a separate subnet. The clients were partitioned into two categories called controlled and uncontrolled. The controlled clients made requests to the web server and responded to information about overload on the server. In contrast, the uncontrolled clients did not respond to changing load on the web server, and can be considered to be given preferential treatment. This treatment was introduced to understand the impact of overload control mechanisms in the presence of QoS constraints. The uncontrolled clients can be considered to be users that have paid a higher subscription rate to the service provider, revenue-generating traffic (e.g., purchases transactions in e-commerce), or others. One of the four server NICs were targeted by uncontrolled clients and did not need any packet classification capability. All others required such a capability and intelligent NIC’s from NetboostTM were used. Apart from the functionality of ordinary NICs, these NICs consist of two major components called classification engine and policy engine. The classification engine understands an imperative language through which one could specify what fields in the packet headers (IP header, TCP header, or HTTP header) or even arbitrary strings in the message body (e.g., URL) are to be examined for packet classification. The policy engine deals with treatment of the packets (dropping, forwarding, sending them up the host stack, etc.). For our purposes, incoming packets were classified into two categories: (a) connection request packets destined to port 80 (HTTP) and (b) all other packets. Connection request packets were sent to the policy
Address Space Internet Information Service (Web Server)
Address Space Monitoring Application Load Status
Application Layer
OS/Kernel Layer
Incoming
Is Host
Overloaded?
TCP/IP Stack
No
Packets
NetBoost NIC (PE 2100)
Hardware Layer
Yes Drop Packets
Figure 2: Dropping Incoming Requests using the intelligent NIC
engine, while all the other packets were directly passed to the host networking stack. In order to drop connection packets under overload, functionality was developed within the policy engine using intelligent NIC’s APIs. The host application monitored the load on the system (via NT’s Perfmon utility) and activated selective dropping of packets within the policy engine when the system got overloaded. This mechanism avoids the overhead of protocol stack processing for dropped packets. The flow of packets as implemented using the intelligent NIC is illustrated in Figure 2.
3.2 Traffic Generation All clients generated HTTP GET requests resulting in the execution of a single active server page (ASP) script on the server that generated the web page to be sent out dynamically. The traffic was generated by a locally developed tool that generates aggregate traffic seen by the webserver without necessarily having to individually emulate each user. The generator has two parts: request parameter generator and actual request generator. The request parameter generator generates the time, size, target web page and other characteristics of the requests and could even be run offline to generate a trace. The request generator then formulates actual HTTP requests that accurately reflect these parameters. In order to achieve correct timing, successive requests are generated by a round-robin scheme between all the O/S threads on a client. When multiple client machines are used for load generation, a round-robin scheme is used between the clients as well. The traffic generator is capable of generating traffic with complex behavior (e.g., asymptotic self-similarity and multifractality at intermediate time scales for the arrival process, flexible description of skewness in web-page accesses, etc.), but most of those features were not used in the experiments reported here. The uncontrolled client made 30 requests per second for all runs. In order to study the impact of the arrival process on the performance, two extreme cases were considered: (a) deterministic inter-arrival times, and (b) M=G= traffic [3], which is known to be extremely bursty and asymptotically self-similar. Overload situations were simulated by providing the web server with additional load from the controlled clients. Each controlled client generated an average of 20 requests per second. Each experimental run was for about 5 minutes and the controlled clients
1
were started up after the load from the uncontrolled clients had stabilized at the server.
3.3 Data Collection During each experimental run, the clients collected data about each request sent. The parameters monitored were the latency for the response and the type of the response. In addition, aggregate parameters for each test were collected which gave information about the total number of OK (HTTP 200) responses received and the total number of Server Error (HTTP 500) responses received. The aggregate data was collected in the time window that the overload occurred. Separate data was collected to determine the length of the tail until the load returned to normal. During the experiments, data collection on the web server was done using the performance monitoring utility of the host O/S (PERFMON). This utility provides access to various performance counters pertaining to several system objects such as the processor, active server page (ASP) statistics, TCP and UDP related counters, etc. In particular, processor utilization, the ASP queue length, connection requests per second and connection requests rejected and UDP packets sent during the experiment were used to analyze the performance of the proposed mechanisms. One limitation of this utility is that it can update performance parameters at most every second. For a large server, 1 second updates may be too slow. For certain metrics, such as the number of queued requests, this limitation can be easily overcome by explicitly monitoring the desired parameter.
4 Proposed Mechanisms 4.1 Overload Detection Although a high processor utilization is a good indicator of server load, it is not very useful for overload control since it does not indicate the severity of the overload beyond 100%. The real measure of interest is, of course, the unfinished work, often also referred to as virtual waiting time [5]. However, because a direct estimate of unfinished work is either infeasible or expensive, simple approximations (e.g., number of unserved requests) are typically used. In our experiments, every request targets an ASP file (actually the same ASP file), therefore, a good metric is the ASP queue length. It is important to note here that if the requests invoke a number of ASP scripts with widely different characteristics, the ASP queue length alone may not be a good measure of the unfinished work. The host operating system provides access to the registry from where data regarding queue length for the ASP requests can be obtained by an application. The ASP object from the Windows registry facilitates monitoring of various parameters related to ASP requests. Using the API related to this object the queue length of outstanding ASP requests was monitored via an application thread on the web server. The following subsections describe three simple overload control schemes that were used to demonstrate potential performance gains due to overload control. Optimization of the schemes or their parameter values is beyond the scope of this paper.
4.2 Dropping Incoming Requests This is the “baseline” scheme that simply drops new connection requests under overload. As stated earlier, most web-servers currently use a similar scheme (except that they incur a higher overhead by generating the “server too busy” response). Thus, to be useful, more sophisticated schemes have to provide better overload performance than this simple scheme. In this scheme, two thresholds are defined for the ASP queue length: abatement and discard. Whenever discard threshold is crossed, the host software makes a down call into the policy engine on the intelligent NIC so that all new connection requests arriving from the controlled clients are dropped. This dropping continues until the ASP queue goes below the abatement threshold. (Once again, the crossing of abatement threshold requires a down call to the intelligent NIC so that its policy engine can start redirecting traffic to the local TCP stack). One important consideration in such a scheme is how the requests are dropped. As discussed earlier, in current web-server architectures, there is no real dropping of the request; instead, either the web-server or a front-end load balancer responds to the HTTP request by a “server-too-busy” response. When done by the web-server itself, this approach obviously results in a lot of wasted work and thus will not perform well under heavy overload. In our scheme, the connection request is actually dropped by the NIC without even the TCP layer knowing about it. Consequently, the TCP on the other end considers this as a “lost packet” situation and reattempts the connection with increasing gaps (1.5 seconds initially, and doubling every time thereafter for a certain number of attempts). This puts additional burden on the clients and the network, which is undesirable.
4.3 Traffic Throttling In this scheme, two thresholds are defined for the ASP queue length: abatement and onset. Whenever onset threshold is crossed, a feedback message is sent by the application towards the proxy server. The feedback mechanism is implemented by using UDP because of its lightweight nature. The server does not discard any packets in this case. Upon receiving the feedback indicating overload, the proxy server needs to reduce the rate at which it sends requests to this web server. It can accomplish this by forcing a minimum time gap between successive requests served from its queue. This introduces the risk of queue buildup at the proxy, a possible performance bottleneck. Since most proxy servers have the ability to send back custom messages to the web clients, a queue length threshold can be introduced to protect the proxy server from overload. When the proxy server queue length exceeds beyond this chosen threshold value, it can send a “Server Too Busy” (STB) message directly to the user, thus saving the additional overhead of establishing a connection with the web server and receiving this response from the server. This also saves the server from performing wasted work (processing STBs).
4.4 A combined mechanism for overload control A third mechanism involving the use of both the above mentioned methods is described here. In this method, three thresholds are defined to classify the load on the server (in increasing order): an abatement threshold, an onset threshold and a discard threshold. The proxy server starts gapping
Table 1: CPU utilization and ASP queue length without overload control Offered Processor Avg Queue Load Utilization Length (requests/s) (%) (Reqs) 32.58 73.67 0.043 43.97 99.95 105.02 71.42 99.87 249.52 99.55 99.82 252.68
the requests when the onset threshold is crossed. If the load does not increase further, this mechanism acts exactly like the throttling mechanism presented earlier. However, if the load increases further and the discard threshold is crossed, subsequent connection requests are dropped. When the server load falls below the onset threshold, dropping is disabled and all subsequent connections are accepted. When the load eventually drops below the abatement threshold, a feedback message is sent to the clients to resume full traffic.
5 Results and Analysis 5.1 Performance without Overload Control We start by analyzing the impact of varied levels of load on throughput, utilization and response time. Figures 3 and 4 present the gathered results from this experiment. The offered load (requests to active server pages) is varied from approximately 30 requests per second to roughly 100 requests per second. If the connection is accepted by the server, the request is typically processed by the web service (IIS 4.0) in two ways depending on the number of requests already queued at the server. If the number of requests are below a certain threshold, IIS processes the request and sends back an OK response code to the client. If the number of queued requests has crossed the threshold, then the web service rejects the request and sends a “Server Too Busy” (STB) response to the client. This threshold, called “RequestQueueMax”, is a O/S registry parameter that can be configured based on the observed performance of the server. Figure 3 presents the number of OK and STB responses as the offered load increases from 32 requests per second (leftmost) to 100 requests per second (rightmost). From the figure, it is found that the web server is capable of sustaining approximately 45 requests/s without generating STBs at approximately 100% processor utilization. As the offered load increases to 71 requests/s (160% of optimal load), almost half the requests experience STB responses, thus lowering the OK throughput to 39 requests/s (86% of server capacity). Furthermore, when the offered load increases to 100 requests/s (225% of server capacity), the OK throughput reduces to 32 requests/s (71% of server capacity). Another important metric to measure performance is the response time as seen by the client. Figure 4 presents the impact of increasing load on the average response time. It is clear from
5HVS 7LPH DW YDU\LQJ ORDGV
�� �� �� �� �� �� �� �� �
2. 5HVS �V (UU 5HVS�V
8WLO � ���
8WLO � ���
8WLO � ���� �ORDG ����
5HVSRQVH 7LPH �PV
5HT�V
7KURXJKSXW DW YDU\LQJ ORDGV
8WLO � ���� �ORDG ����
����� ���� ���� ���� ���� ���� ���� ���� ���� ���� �
8WLO � ���
8WLO � ���
8WLO � ���� �ORDG 8WLO � ���� �ORDG ���� ����
8WLO � /RDG
8WLO � /RDG
Figure 3: Throughput vs. offered load (no overload control)
Figure 4: Response time vs. offered load (no overload control)
7KURXJKSXW DW YDU\LQJ ORDGV
5HVSRQVH 7LPH DW YDU\LQJ ORDGV
�6HOI 6LPLODU 7UDIILF
�6HOI 6LPLODU 7UDIILF
5HVSRQVHV �V
�� �� ��
2. 5HVS�V (UU 5HVS�V
�� �� �
8WLO � ��� 8WLO � ��� 8WLO � ��� 8WLO � ���� 8WLO � ���� 8WLO � ���� �ORDG �ORDG �ORDG ���� ���� ���� 8WLO � /RDG
Figure 5: Throughput vs. offerred load (Self Similar Traffic, no overload control)
$YJ 5HVSRQVH 7LPH �PV
��
���� ���� ���� ���� ���� ���� ���� ���� �
8WLO � ���
8WLO � ���
8WLO � ���
8WLO � ���� 8WLO � ���� 8WLO � ���� �ORDG ���� �ORDG ���� �ORDG ����
8WLO � /RDG
Figure 6: Response time vs. offerred load (Self Similar Traffic, no overload control)
,PSDFW RI 'URSSLQJ &RQQHFWLRQ 3NWV RQ 5HVS 7LPH ����� ORDG
��
������
��
������ 5HVSRQVH 7LPH �PV
7KURXJKSXW �5HT�V
,PSDFW RI 'URSSLQJ &RQQHFWLRQ 3NWV RQ 7KURXJKSXW ����� ORDG
�� �� �� �� �� ��
������ ������
8QFRQWUROOHG &RQWUROOHG� &RQWUROOHG�
����� ����� ����� �����
���� EDVH
GURS ������� 4OHQ�� 4OHQJWK � 'URS )DFWRU
GURS ������ 4OHQ��
Figure 7: Throughput for 160% overload (dropping only)
�
���� EDVH
GURS ������� GURS ������ 4OHQ�� 4OHQ�� 4OHQJWK � 'URS )DFWRU
Figure 8: Response time for 160% overload (dropping only)
the figure that when the system is running at 75% processor utilization (32 requests/s load), the average response time seen by the client is very small (about 170 ms) and a negligible average queue length. However, when the system is almost 100% utilized (at roughly 44 requests/s), the response time increases to over 3.3 seconds. The increase in response time is attributed the time spent in the request queue (average queue length of 105 requests) waiting to be serviced. Furthermore, as the load increases beyond 45 requests/s, the average response time increases to 7.3 seconds corresponding to an average queue length of 249 requests (at 160% load) and to 8.8 seconds corresponding to an average queue length of 252 requests (at 225% load). Table 1 shows the processor utilization and queue length at various loading levels. The results above used deterministic interarrival times. Figures 5 and 6 show the results for the M=G= self-similar request arrival process. Here the average offered load is varied from approximately 27 requests per second to roughly 85 requests per second. It is seen that the web server is still capable of sustaining approximately 45 reqs/sec without generating STBs at approximately 100% processor utilization. As the offered load increases to 70 reqs/sec (150% of optimal load), almost half the requests experience STB responses, consequently lowering the OK throughput to 38 reqs/sec (85% of server capacity). Furthermore, when the offered load increases to 85 reqs/sec (190% of server capacity), the OK throughput reduces to 36 reqs/sec (80% of server capacity). As to the response time, Figure 5 shows that when the web server is loaded to 88% processor utilization (corresponding to a load of 38 req/sec) the average response time is close to 500 ms. At 150% overload however, the response time increases to 6.2 seconds even though the throughput is 38 requests/sec. It can be seen from this discussion that the overload behavior does not differ much even though the nature of the traffic changes drastically (from deterministic to self-similar). This is not surprising because if the ASP queue is running close to being full, the nature of the traffic hardly matters.
1
5.2 Dropping Incoming Requests This section studies the performance improvement obtained by simply dropping excess new connection requests at server. For this, two controlled clients were used so that it is possible to choose different dropping percentages for them. Figures 7 and 8 present the performance of this scheme under 160% overload. Three different cases are shown here: (a) base case (i.e., no overload control), (b) control triggered at onset threshold of 20 and a 100% drop, for both controlled clients, and (c) control triggered at onset threshold of 20 and (50%,100%) dropping at the two controlled clients. Note here that requests from the uncontrolled client are not dropped and thus it can be considered a preferred client. The results indicate that this mechanism raises the throughput close to the server capacity (an improvement of 9%). Also, the change in response time is different for controlled vs uncontrolled clients. The average response time for controlled clients goes up significantly since dropping the connections results in several TCP retransmissions until the connection is accepted or the number of retries exceeds a predefined maximum. The control increases the response time of controlled clients by a factor of almost 20 whereas the response time of the uncontrolled client decreases substantially. For brevity, detailed results for the self-similar traffic are omitted here. The overall behavior is similar to that for the deterministic traffic except that the highly bursty nature of the traffic precludes achieving the optimum throughput of 44 requests/sec. Instead, the best achieved throughput is only about 41 requests/sec. As in the deterministic case, the response time of the controlled clients increases substantially, but that of the uncontrolled client drops by about 30%.
5.3 Impact of Traffic Throttling This section studies the performance improvement obtained by detecting the overload and sending the feedback. Ideally, the feedback should be sent to a control node (e.g., proxy server) as described in Section 4.3. However, this scenario was simulated by sending a UDP message directly to the controlled clients. Upon receiving the message, the controlled clients increase the time gap between their consecutive requests. In the future, we intend to incorporate this mechanism into a proxy server (e.g., Squid). Here we analyze the performance of this mechanism and its relation to the following parameters: level of overload, queue length thresholds and time gap. Note that in these experiments, an explicit feedback is sent out to the clients whenever the ASP queue size falls below the abatement threshold. This is different from the more traditional approach where the control node chooses a time-interval for traffic throttling. An explicit feedback certainly gives more accurate information and thus will work better; however, it suffers from the weakness that if the feedback message is lost or excessively delayed, an overcontrol will result. It is possible to rectify this by using probe messages, but this aspect has not been explored at this stage. Figure 9 and 10 show the effect of traffic throttling on transaction throughput and response times when the offered load is 225% of the server capacity. The base case (leftmost bars), representing 225% overload with no control, shows a throughput of roughly 33 requests/s and a response time of approximately 9 seconds. In this situation, the average queue length was approximately 252 (close to the maximum value). Thus, the overload control was studied with onset thresholds of both 200 and 150. The gapping interval used by the clients was also varied (50 ms,
�� �� �� �� �� �� �� �� ��
,PSDFW RI *DSSLQJ &OLHQWV RQ 5HVSRQVH 7LPH ����� ORDG ����� ���� 8QFRQWUROOHG &RQWUROOHG
���� 5HVSRQVH 7LPH �PV
7KURXJKSXW �5HT�V
,PSDFW RI *DSSLQJ &OLHQWV RQ 7KURXJKSXW ����� ORDG
���� ���� ���� ���� ���� ���� ����
���� *DS�� *DS��� *DS��� *DS��� *DS��� *DS��� *DS��� %DVH 4OHQ��� 4OHQ��� 4OHQ�� 4OHQJWK � *DSSLQJ ,QWHUYDO
�
���� *DS�� *DS��� *DS��� *DS��� *DS��� *DS��� *DS��� %DVH 4OHQ��� 4OHQ��� 4OHQ�� 4OHQJWK � *DSSLQJ ,QWHUYDO
Figure 9: Throughput for 225% overload (throttling only)
Figure 10: Response time for 225% overload (throttling only)
150 ms & 250 ms respectively). From Figures 9 and 10, it may be seen that the performance gains are significant up to a time gap of 150 ms. Since the three controlled clients each generate a uniform load of 20 requests/s under no control, increasing the time gap by 150 ms reduced the traffic during overload to roughly 5 requests/s (a total of 15 requests/s from the three uncontrolled clients). Since the uncontrolled client generated roughly 30 requests/s, the overall load to the server was about 45 requests/s. Since this is the capacity of the server, the queue length remains constant and the performance improvement achieved by throttling traffic at a gap 150 ms is close to optimal. As the time gap was increased further to 250 ms, the gains in performance were minimal. We hypothesize that using a lower onset threshold to activate the overload control mechanism can further reduce the average queue length and correspondingly reduce the average response time. The data shown in the figure not only supports this hypothesis but also shows that the overall throughput does not change significantly when the onset threshold is reduced. The impact of the queue length threshold and time gap values on throughput and average response time was illustrated in the above. However, the service provider may also be interested in the level of service provided to the incoming web traffic during overload. One way of quantifying the level of service is by looking at the overall distribution of latencies observed for all request-response pairs during the overload. Figures 11 and 12 plot the cumulative distribution of requests (y-axis) versus the response time (x-axis). In other words, a given point (X, Y) denotes that Y% of the requests experienced a service time of X milliseconds or less. In the figure, there are eight different curves corresponding to the 225% overload and the throttling mechanism run with different values for (time gap, queue length) as indicated by the labels. The case of no overload contro is depicted by No control and shows the highest average response time due to the largest queue buildup (about 260 reqs). As the threshold queue-length is reduced , the curves shift to the left. Similarly, as the time gap is increased under a fixed queue length threshold, the response time decreases. Also, for a large time gap of 250 ms, the curves increase very gradually from left to right. This can be attributed to the high fluctuations in the queue length caused by periods of underload and overload. The results above are for deterministic arrival process. With self-similar process, the throttling scheme is able to acheive a throughput of 43.5 requests/sec, which is very close to the
100 70 50
60
(50,150)
(250,10)
40
(250,150) No control
(150,10)
30
Cumulative percentage
80
90
(150,150)
20
(250,100)
0
10
(150,100)
0
2000
4000
6000
8000
10000
12000
Response time (ms)
Figure 11: Uncontrolled client resp. time dist. for 225% overload (throttling only)
optimal value of 44 requests/sec. The response time also decreases substantially as in case of the deterministic traffic. Figures 13 and 14 compare the performance of traffic throttling and dropping mechanisms for deterministic traffic under 160% overload. At this loading level, throttling achieves a throughput improvement of roughly 12% and response time reduction by a factor of 3.6. As expected, throttling incoming traffic is more effective than dropping connection requests since the former can better control the number of requests sent to the overloaded web server. In terms of response time, the average response time including controlled and uncontrolled clients is lower for the throttling mechanism. However, the average response time for the uncontrolled clients is much lower with dropping mechanism since dropping affects the controlled clients severely by causing several retransmissions.
5.4 Impact of combining the two schemes In this case, the onset threshold is chosen as 150 and discard threshold as 200. Figures 15 and 16 show the performance improvement of this scheme under 225% overloaded and deterministic arrivals. While the improvement in throughput is not significant when compared to the throttling mechanism, the average queue length is lower by 40% resulting in a lower response time for the uncontrolled clients as shown in Figure 16. This is an important result since it shows that revenue-generating traffic can be supported even when the server is heavily overloaded. The combined scheme performs better than the throttling only scheme for self-similar traffic as well.
5.5 Multiple Congestion Thresholds Section 2.1 mentioned the use of congestion priorities in implementing multiple grades of service. In order to demonstrate this, the controlled clients were divided into two classes such that one
100 70 50
60
(50,150)
(250,10)
40
(250,150) No control
(150,10)
30
Cumulative percentage
80
90
(150,150)
20
(250,100)
0
10
(150,100)
0
2000
4000
6000
8000
10000
12000
Response time (ms)
Figure 12: Controlled client resp. time dist. for 225% overload (throttling only)
,PSDFW RI *DSSLQJ � 'URSSLQJ RQ 7KURXJKSXW
,PSDFW RI *DSSLQJ � 'URSSLQJ RQ 5HVSRQVH 7LPH �7KUHVKROG DW 4
�7KUHVKROG DW 4 /HQ ��
/HQ ��
$YHUDJH 5HVSRQVH 7LPH �PV
��
5HTXHWV SHU VHFRQG
�� �� �� �� �� �� �� �� ��
����� ����� �����
8QFRQWUROOHG &RQWUROOHG
����� ����� ����� ����� �
�� ���
'URS �������
*DS ���
���
%DVH
'URSSLQJ
*DSSLQJ
%DVH
'URS �������
*DS ���
'URSSLQJ
*DSSLQJ
*DSSLQJ � 'URSSLQJ
*DSSLQJ � 'URSSLQJ
Figure 13: Throughput for 160% overload (dropping vs. throttling)
Figure 14: Response time for 160% overload (dropping vs. throttling)
,PSDFW RI *DSSLQJ�'URSSLQJ RQ 7KURXJKSXW ����� ORDG
,PSDFW RI *DSSLQJ�'URSSLQJ RQ 5HVS 7LPH ����� ORDG
��
�����
��
����� 5HVSRQVH 7LPH �PV
7KURXJKSXW �5HT�V
�� �� �� �� �� �� ��
8QFRQWUROOHG &RQWUROOHG
����� ���� ���� ���� ����
� �
�����
�
%DVH
*DSSLQJ
&RQWURO 0HWKRG
*DSSLQJ�'URSSLQJ
Figure 15: Throughput for 225% overload (dropping and throttling)
%DVH
*DSSLQJ
&RQWURO 0HWKRG
*DSSLQJ�'URSSLQJ
Figure 16: Response time for 225% overload (dropping and throttling)
,PSDFW RI *DSSLQJ &OLHQWV RQ 5HVSRQVH 7LPHV XVLQJ GLIIHUHQW WKUHVKROGV IRU FOLHQWV �/RDG ����
,PSDFW RI *DSSLQJ &OLHQWV RQ WKURXJKSXW XVLQJ GLIIHUHQW WKUHVKROGV IRU FOLHQWV �/RDG ����
1R &RQWURO *DSSLQJ ���PV
���� �����
1R &RQWURO *DSSLQJ ���PV
����
5HVSRQVH 7LPH �PV
2. 5HVSRQVHV 5HFYG
�����
�����
����
����
����
����
����
����
����
����
���� � &RQWUROOHG &OLHQW
&RQWUROOHG &OLHQW
�/RZ 7K
�+LJK 7K
8QFRQWUROOHG &OLHQW
�
7RWDO 7KURXJKSXW
&RQWUROOHG &OLHQW �/RZ 7K
&OLHQW &DWHJRU\
Figure 17: Throughput for 150% overload (throttling w/ multiple thresholds)
&RQWUROOHG &OLHQW �+LJK 7K
8QFRQWUROOHG &OLHQW
&OLHQW &DWHJRU\
Figure 18: Response time for 150% overload (throttling w/ multiple thresholds)
class had higher congestion thresholds than the other (and hence given a preferential treatment under overload conditions). The uncontrolled clients were still retained and obviously received the best treatment during overload. In these experiments, self-similar input traffic was used and overload control was achieved by traffic throttling. The experiments were run with traffic loads of 120% and 150%. Figures 17, and 18 presents the data for 150% overload. The client with the lowest threshold for overload control has a reduction in the overall throughput by about 22% while the other clients see an improvement in the throughput. It can be seen that the overall throughput is not affected much by the control, however, the impact of different congestion thresholds is clear. Similarly, the response time for the client with no control (corresponding to the client being given the highest QoS) shows an improvement of 55% as compared to an improvement of 35% for the client with the lowest threshold for overload control (corresponding to the lowest quality of service). Thus, multiple thresholds can be used to tune the performance according to the QoS requirements for various classes of traffic.
6 Conclusions and Future Work This paper proposed several simple overload control mechanisms to improve the performance of heavily stressed web servers. One such mechanism is to use an intelligent NIC at the web server to selectively drop connection request packets when overload occurs. Another mechanism is to send load feedback backwards towards the traffic source (another native server, a proxy server, or the ultimate client) to enable traffic throttling at or closer to the source. Through extensive experimental runs, it was shown that the performance improvements using these mechanisms can improve the throughput by as high as 40% and reduce the response time by 70% when the web server is 225% overloaded. The two mechanisms can also be combined and help reduce the response time further while maintaining the improvement in throughput. These results demonstrate how intelligent NICs can be exploited for an effective overload control without requiring a separate dispatcher node for the web-server.
In order to judge the true worth of an overload scheme, it is necessary to repeat experiments for a wide variety of scenarios in terms of arrival process characteristics, level of overload, duration of overload, and type of overload. Also the parameter space for the overload control scheme (e.g., monitored congestion index, location of various thresholds, etc.) needs to be explored in order to find suitable operating regions. This paper has not concentrated on these issue since the purpose was simply to demonstrate the usefulness of more sophisticated overload control schemes than simply returning “server-too-busy” message to the client. As mentioned in section 2.1, application level overload feedback messages (e.g., ACC or ACG) used in telecommunications systems go only back to the previous application node. This is done because retracing the path backwards and directing feedback to them is expensive (in fact, not even possible according to the current standards). Reference [9] proposes a scheme for a more general and unified congestion control mechanism. A similar problem occurs in case of web-servers as well. If a proxy server receives overload feedback, a considerable extra work would be needed to direct it back to the originating client (e.g., additional UDP channel back to each client and maintenance of the context so that the feedback can be pushed backwards). It remains to see if the overhead of such a scheme is worthwhile. It appears that effectively combating DoS attacks would require such a capability. Transaction level overload control was mentioned in section 2. Efficient implementation of such controls would require some protocol support so that it is possible to drop individual requests and not have them retried. In certain situations, successive requests on a TCP connection are strongly dependent on previous ones — a prime example of this is the SSL handshake required by a secure HTTP transaction where the SSL handshake itself requires 3-4 request-response pairs. In such a situation, either the entire handshake should be allowed to go through or it should not be allowed to start at all. However, once the secure connection is established, a transaction level control might be used for individual requests. An appropriate use of congestion priorities can achieve such a behavior; however, the difficulty arises in recognizing congestion priorities at the NIC level. Again, a protocol support (e.g., congestion priorities encoded in HTTP headers) would help greatly in implementing such schemes. Identifying precisely what protocol changes are required at TCP and HTTP level to support feedback overload control is a major issue for further work on the topic. It is important to actually make these changes, do an extensive testing under a variety of loading conditions, and use that as a basis for proposing changes to existing standards. As mentioned earlier, the browsers also should be able to deal effectively with feedback messages. Demonstrating the usefulness of such changes to browsers is also a topic for further work in the area.
References [1] G. Banga, P. Druschel, and J.C. Mogul, “Better Operating System features for faster network servers,” Proc. of workshop on internet server performance (WISP), June 1998. [2] K. Kant and Y. Won, “Server capacity planning for web traffic workload”, IEEE transactions on data and knowledge Engineering, Oct 1999, pp731-747.
[3] K. Kant, “On Aggregate Traffic Generation with Multifractal Properties”, Proceedings of GLOBECOM 2000, Rio de Janeiro, Brazil. [4] K. Kant and M. Venakatachalam, “Modeling traffic non-stationarity in e-commerce servers, working paper, Sept 2000, Available at kkant.ccwebhost.com. [5] K. Kant, Introduction to Computer System Performance Modeling, McGraw Hill, 1992. [6] S. Kent and R. Atkinson, “Security Architecture for the Internet Protocol,” RFC 2401, Nov 1998. [7] K. Kant, R. Iyer, and P. Mohapatra, “Architectural Impact of Secure Socket Layer on Internet Servers”, to appear in International conference on computer design (ICCD), Sept 2000. [8] K. Kant, “Performance of Internal Overload Controls in Large Switches”, 28th Annual Simulation Conference, Phoenix, AZ, April 1995, pp 228-237. [9] K. Kant, “A Unified Global Congestion Control Scheme for Broadband Signaling Networks”, unpublished report. Available at kkant.ccwebhost.com. [10] D.R. Manfield, G. Millsteed, and M. Zukerman, “Congestion Controls in SS7 Signalling Networks”, IEEE Communications Magazine, June 1993, pp 50-57. [11] B. Northcote and M. Rumsewicz, “An investigation of CCS Tandem Overload Control Issues,” Proceedings of GLOBECOM, Nov 1995, Singapore, pp718. [12] M.P. Rumsewicz and D.E. Smith, “A Comparison of SS7 Congestion Control Options During Mass Call-in Situations”, IEEE Trans. on Networking, Vol 3, No 1, Feb 1995. [13] M. Rumsewicz, M. Castro, and M.T. Le, “Eddie Admission Control Scheme: Algorithm description, prototypt design details and capacity benchmarking”, available at www.eddieware.org. [14] M. Rumsewicz, “Load balancing and control algorithm for a single site Web server”, available at www.eddieware.org. [15] A. Feldmann, A.C. Gilbert and W. Willinger, “Data Networks as Cascades: Investigating the multifractal nature of Internet WAN traffic”, Proc. 1998 ACM SIGCOMM, pp42-55.