IPC 24th Session, Dehradun Nov 2012
29/11/2012
Overview Problem statement: profitability of bio-oil production Methodology: cost-benefit analysis & risk analysis
International Poplar Commission, 24th Session, Dehradun, India
Pyrolysis: oil yields & combined heat & power (CHP) production Economic model: investment; expenditures & revenues Base case: results & sensitivity analysis
ECONOMICS of POPLAR PYROLYSIS
Optimistic and pessimistic scenario analysis
stemming from PHYTOREMEDIATION of METAL POLLUTED SOILS
Discussion and conclusions
Theo Thewys & Tom Kuppens Research group Environmental Economics 11/2012
T. Thewys & T. Kuppens (Univ. Hasselt)
2
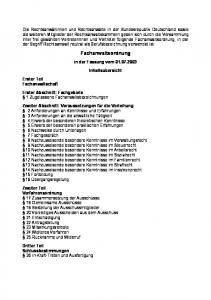
Phytoremediation
Campine region: cadmium pollution Cd concentrations exceed threshold
Phytoextraction
values for agriculture
Special form of
Poplar
phytoremediation Metal uptake by plant
Vast area of 3400 ha of farmland in
Translocation of metals
the Belgian Campine require
from soil to harvestable
soil remediation
parts of the plant
Phytoremediation is better suited (costs) than conventional soil remediation
T. Thewys, dr. & T. Kuppens, drs. (Univ. Hasselt)
= biomass 3
T. Thewys, dr. & T. Kuppens, drs. (Univ. Hasselt)
4
1
IPC 24th Session, Dehradun Nov 2012
29/11/2012
Problem: output price (farmer) versus input price (oil producer) Short rotation poplar
Chips
Risk analysis (1) The poplar price (ppoplar) is the maximal price an investor in a
= ‘output’ (for the farmer) Income selling price ?
pyrolysis installation is willing to pay for the use of poplar High price
= ‘input’ (for the oil producer) Cost purchase price ?
? Maximal poplar price …. …. so that investment in the oil producing plant is still profitable ! Heat
Bio-oil Pyrolysis reactor
as a feedstock for the conversion plant
Electricity
Guaranteeing a 95 % chance of a positive net present value of cash flows generated by the investment
The poplar price thus should be determined by taking Low profit
into account uncertainties/risks of the project
Combined Heat & Power T. Thewys, dr. & T. Kuppens, drs. (Univ. Hasselt)
Risk analysis (2) How to measure economic risk?
6
Thermochemical conversion Pyrolysis
Monte Carlo simulations (MC)
Lower process temperatures
• How sensitive is the NPV of the cash flows for changes in the values of the input variables (e.g. yearly volume of biomass; oil yield (wt %); sales of heat) in the simulation model? • Requires knowledge (assumptions) about minimal, most probable and maximal values of input variables and their respective frequency of appearance • Results in probability distribution of NPV after thousands of
metals are concentrated in char Slow pyrolysis max! char formation (but market value of biochar is unknown) Flash pyrolysis: quantity of O2 added / O2 required for complete combustion = 0 max! oil formation
simulations
T. Thewys, dr. & T. Kuppens, drs. (Univ. Hasselt)
7
T. Thewys, dr. & T. Kuppens, drs. (Univ. Hasselt)
8
2
IPC 24th Session, Dehradun Nov 2012
29/11/2012
Conversion process
Flash pyrolysis Anaerobic cracking of biomass molecules (lignin, cellulose) into solid and gaseous fraction
Poplar
Poplar (SRC)
Pyrolysis reactor
Pyrolysis oil
Electricity and heat
CHP engine
13 – 25 wt. % biogas 5% radiation losses
Internal energy consumption
10% flue losses
100% primary fuel
52 – 71 wt. % pyrolysis oil calorific value: 17,5 GJ/ton 16 – 23 wt. % char Internal energy consumption 50% heat
11/2012
T. Thewys, dr. & T. Kuppens, drs. (Univ. Hasselt)
T. Thewys, dr. & T. Kuppens, drs. (Univ. Hasselt)
9
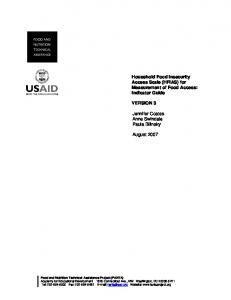
Revenues & Expenditures Transport cost
25,000 4,641
base case
Labor cost
823 1,539
20,000
2000
Shredder cost
1800
2,073
Biomass purchase 3,337
H e c t a r e s
Fixed operational costs Interest payments
12,429 4,678
Investment Heat & Power Certif
10,000
2,229
Green Curr Certif Investment subsidies
1,466
5,000
1400
20.000 tons poplar
1200 1000
11.292 tons poplar
800
base case
600 400
0 1
Heat sales
8,681 5,104
2
3
4
5
6
7
8
9 10 11 12 13 14 15 16 17 18 19 20
Years
Electricity sales 11
0 Revenues
Growing “willingness to engage in poplar” by farmers
1600
200
1,825
11/2012
10
Cultivated surface
(net present value over 20 yrs, 1.000 Euro)
15,000
35% electric
11/2012
T. Thewys, dr. & T. Kuppens, drs. (Univ. Hasselt)
12
Expenditures
3
IPC 24th Session, Dehradun Nov 2012
29/11/2012
Overview
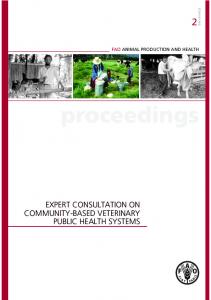
Cash flows Revenues
Problem statement: profitability of bio-oil production
Expenditure
8,000
Methodology: cost-benefit analysis & risk analysis
Inv = 6.409
7,000
Pyrolysis: oil yields & combined heat & power (CHP)
Inv = 5.974
1.000 Euro
6,000
production
5,000
Economic model: investment; recurring expenditures &
4,000 Economies of scale
3,000
revenues
2,000
Base case: results & sensitivity analysis
1,000
Optimistic and pessimistic scenario analysis
0 0
1
2
3
4
5
6
7
8
9 10 11 12 13 14 15 16 17 18 19 20
Discussion and conclusions
Year 11/2012
T. Thewys, dr. & T. Kuppens, drs. (Univ. Hasselt)
11/2012
13
T. Thewys, dr. & T. Kuppens, drs. (Univ. Hasselt)
Median NPV (base case)
14
Overview
& importance of 5 base case ranges Economic model: investment & recurring expenditures & Row
Variable
Minimum
Middle
Maximum
NPV sensitivity
(1)
(2)
(3)
(4)
(5)
(6)
31,5 EUR/odt
35 EUR/odt
38,5 EUR/odt
-2,0 %
revenues Base case: results & sensitivity analysis
1
Biomass price
2
Starting surface Syear 1
607,5 ha
675 ha
742,5 ha
5,0 %
3
Oil yield Yoil
63 wt.%
70 wt.%
77 wt.%
92,5 %
4
Heat sales Qsold
45 %
50 %
55 %
0,4 %
5
Discount rate i
8,1 %
9%
9,9 %
0,0 %
6
Median NPV
7
Probability NPV > 0
696.194
Optimistic and pessimistic scenarios about: 1. yearly volume of poplar (cultivated surface) 2. oil yield 3. % of heat sold locally
86,1 %
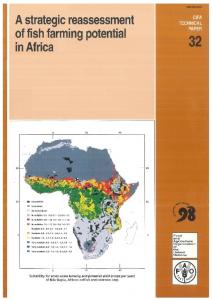
Risk (NPV 0
“Willingness to engage” by farmers in first year?
1800
Surface occupied by poplar (ha) max price poplar (EUR/odt)
Optimistic base case Pessimistic
Oil yield (wt %) max price poplar (EUR/odt)
pessim
base case
optimist
300
675
850
-20
30
40
60%
70%
80%
-5
30
60
30%
50%
80%
25
30
35
400
300
Heat sold locally (% of production)
200
max price poplar (EUR/odt) 0 1
2
3
4
5
6
7
8
9 10 11 12 13 14 15 16 17 18 19 20
Years
11/2012
T. Thewys, dr. & T. Kuppens, drs. (Univ. Hasselt)
17
11/2012
T. Thewys, dr. & T. Kuppens, drs. (Univ. Hasselt)
Conclusions (1) 1. Installation: 1,6 odt/hr (year 1-10); 2,8 odt/hr (year 11-20) 2. Base case: 1.
Assumptions:
675 ha;
70% oil yield;
50% heat sold
2. Net present value (NPV) cash flows: 696,000 Euro (mean value) 3. Probability of a positive NPV of the cash flows: 86 %. 4. Sensitiveness analysis: most important determinants:
Conclusions (2) 3. Maximum poplar price (€/ton): scenarios (95 % prob >0) 1. Larger surface:
-20 ; 30 ; 40 €/ton
2. Larger oil yield:
-5 ; 30 ; 60 €/ton
3. Lager % heat sold: :
25 ; 30 ; 35 €/ton
4. Explanation 1. Returns to scale: average oil production cost decrease with larger volume biomass
1. oil yield 2. yearly volume of poplar (cultivated surface)
2. Cost are based on the supplied volume of processed biomass (odt/year) 3. Greater valorisation of heat output
3. % of heat sold locally
T. Thewys, dr. & T. Kuppens, drs. (Univ. Hasselt)
21
22
T. Thewys, dr. & T. Kuppens, drs. (Univ. Hasselt)
23
5
IPC 24th Session, Dehradun Nov 2012
29/11/2012
Discussion Questions? Suggestions?
Thank you for your attention!
[email protected] 24
6