Training & Testing
Oxygen Cost of Running Barefoot vs. Running Shod
Authors
N. J. Hanson1, K. Berg1, P. Deka1, J. R. Meendering2, C. Ryan3
Affiliations
1
Key words ▶ barefoot ● ▶ running economy ● ▶ overground ● ▶ treadmill ● ▶ nike plus ●
Abstract ▼
Health, Physical Education and Recreation, University of Nebraska at Omaha, United States Health, Physical Education and Recreation, South Dakota State University, Brookings, United States 3 Psychology, University of Nebraska Omaha, United States
The purpose of this study was to investigate the oxygen cost of running barefoot vs. running shod on the treadmill as well as overground. 10 healthy recreational runners, 5 male and 5 female, whose mean age was 23.8 ± 3.39 volunteered to participate in the study. Subjects participated in 4 experimental conditions: 1) barefoot on treadmill, 2) shod on treadmill, 3) barefoot overground, and 4) shod overground. For each condition, subjects ran for 6 min at 70 % vVO2max pace while VO2, heart rate (HR), and rating of perceived exertion
Introduction ▼
accepted after revision August 24, 2010 Bibliography DOI http://dx.doi.org/ 10.1055/s-0030-1265203 Published online: 2011 Int J Sports Med © Georg Thieme Verlag KG Stuttgart · New York ISSN 0172-4622 Correspondence Nicholas J. Hanson, MS University of Nebraska at Omaha Health, Physical Education & Recreation Dodge Street 6001 68182-0216 Omaha United States Tel.: + 1/402/554 2670 Fax: + 1/402/554 3693
[email protected]
Running has become increasingly popular over the years and provides numerous health benefits including improved cardiovascular health [42], decreased risk of stroke [43] and hypertension [25], increased bone mass [12, 41] and psychological benefits such as decreased depression and a positive effect on mood state [11, 36]. Despite its popularity and many benefits runners still experience a high injury rate, with up to 79 % of runners incurring an injury annually [22, 40]. Thus, runners have sought numerous strategies in hopes of reducing injury and running faster. One strategy is to run without any shoes at all: barefoot. While running barefoot, people tend to implement a mid foot strike rather than a heel strike [38]. Barefoot runners utilize a coordination strategy starting at the ankle apparently to reduce the ground reaction force (GRF) and resulting pain from a heel strike [20]. To lessen this pain, the force is distributed upon each landing across a greater surface area than the heel alone, the middle of the foot. The function of the plantar fascia is to create a support system for the arch of the foot and to act as a shock absorber
(RPE) were assessed. A 2 × 2 (shoe condition x surface) repeated measures ANOVA revealed that running with shoes showed significantly higher VO2 values on both the treadmill and the overground track (p < 0.05). HR and RPE were significantly higher in the shod condition as well (p < 0.02 and p < 0.01, respectively). For the overground and treadmill conditions, recorded VO2 while running shod was 5.7 % and 2.0 % higher than running barefoot. It was concluded that at 70 % of vVO2max pace, barefoot running is more economical than running shod, both overground and on a treadmill.
during walking and running [44]. It also helps to supply a great deal of elastic energy during running [4]. Perhaps barefoot running aids in strengthening the intrinsic stabilizing muscles of the feet and allows for greater utilization and elasticity of the plantar fascia [32]. It is thought that the more time one spends barefoot, the stronger the arch becomes. In a study of 2 300 children between the ages of 4 and 13, the prevalence of flat foot was 8.6 % in an urban group that normally wore shoes and 2.8 % in a rural group that normally went barefoot (p < 0.001); [30]. The authors suggested that there is a critical age where foot arch development is crucial and can be interrupted by excessive shoe use. They also stated that perhaps the human foot has no need for additional external support, and the muscles of the arch can grow stronger with increased barefoot walking and running. Some research has suggested that expensive running shoes may actually lead to more injuries than lower priced ones [23, 33]. Additionally, a negative correlation between shoe stiffness and vertical impact was found, meaning that as the level of cushioning increases the harder one lands (r = − 0.87, p < 0.001); [34]. The extra cushioning in running shoes may decrease caution upon
Hanson NJ et al. Oxygen Cost of Running Barefoot … Int J Sports Med
Downloaded by: Universite Laval. Copyrighted material.
2
Training & Testing Experimental design The subjects came to the laboratory for 2 testing sessions. The main outcome of the first session was a VO2max test. This was performed to determine the velocity of running at peak oxygen consumption and later for data collection purposes in which the subjects ran on the treadmill and on the track at 70 % of that peak velocity, or 70 % vVO2max. The second session occurred within 1 week of the VO2max test. This study used a 2 × 2 repeated measures design, with 4 different testing conditions: 2 runs on a treadmill and 2 on an indoor track, each with and without running shoes. The subjects were assigned to 1 of 4 test sequences using a balanced Latin square design with 4 different starting points for the sequences used. This process minimized possible order effect.
Instrumentation For both the treadmill and the overground testing VO2 was assessed using a portable metabolic measurement system. Prior to each testing session the system was auto-calibrated through the computer software, according to the manufacturer’s instructions (VO2000; Medical Graphics Corp., St. Paul, MN). This autocalibration process involves sampling of the surrounding air and does not require syringes or reference gases. The validity and reliability of this portable metabolic cart system has been confirmed previously [6]. For all of the treadmill tests the grade was set at 1 % to correct for the lack of air resistance encountered while running on a treadmill [7, 16]. The treadmill speed was validated for each subject using a strip of tape attached to the belt and calculating revolutions per minute for speeds of 80 through 268 m•min − 1 and found to be 99.6–99.7 % accurate. Heart rate (HR) was monitored with a Polar watch (Polar Electro Oy, Kempele, Finland) and the rating of perceived exertion (RPE) was determined using the Borg 6–20 scale [3] every 3 min. During overground running the velocity was assessed with a Nike + accelerometer (Nike, Beaverton, OR) connected to an Apple iPod (Apple, Cupertino, CA) which was calibrated according to the manufacturer’s specifications and required the subject to run at a self selected pace for 402 m. The validity of this instrumental setup has been tested and is determined to closely estimate variable running speeds [18].
Procedures Methods ▼ Subjects 10 healthy runners, 5 males and 5 females, participated in this study. All subjects ran recreationally, at least 16 km per week for the previous 6 months. Potential subjects were excluded if they reported any lower extremity injuries in the last 12 months. They all signed an informed consent form approved by the university’s Institutional Review Board after having the testing procedure explained in detail. The study was conducted in accordance with the ethical standards of national and interna▶ Table 1. tional laws [15]. Subjects are described in ● Table 1 Demographics of subjects. Gender male (n = 5) female (n = 5)
Age 24.4 ± 3.1 23.2 ± 4.0
Height (cm)
Mass (kg)
182.9 ± 0.9 168.3 ± 3.1
90.2 ± 21.1 63.8 ± 25.6
(M ± SD; N = 10)
Hanson NJ et al. Oxygen Cost of Running Barefoot … Int J Sports Med
The first session began with a VO2max test while the subject was wearing running shoes. The treadmill was set at a speed of 80.5 m•min − 1 and increased by 26.8 m•min − 1 every 2 min until HR reached 170 bpm. The speed was then increased by 13.4 m•min − 1 every minute until the subject reached exhaustion. For this session and for all subsequent sessions the portable metabolic cart was used to measure VO2. Use of the same equipment allowed the subjects to become comfortable with the system before using it for the 4 different testing conditions. The sampling frequency was set at 0.05 s − 1. HR was monitored continuously and RPE was assessed 30 s before each speed increment during the test. After the VO2max test the subject was allowed to rest for a minimum of 5–10 min and then was permitted to run barefoot on the treadmill for familiarization. In the second session, which was conducted on a separate day within 1 week of the first visit, the subject completed all 4 conditions with rest periods between each. To allow for adequate rest, the subsequent testing condition was not started until the subjects’ HR were less than 110 bpm and they felt ready to start the next testing condition. The order of testing conditions varied
Downloaded by: Universite Laval. Copyrighted material.
each landing and lead to an increase in impact. In an earlier study the vertical impact between barefoot and shod running was investigated [31]. The authors suggested that there is a preferred amount of sensation upon each landing during running, whether barefoot or shod, and that running shoes make it more difficult for a person to find a preferred level of impact due to decreased proprioception. A study by Kerrigan et al. [19] showed increased joint torques at the ankle, knee and hip when running with shoes compared to running barefoot, likely due to the raised heel of the typical running shoe. A possible mechanism for injury while running in shoes may be due to increased GRF. Barefoot running decreases overall GRF, and also decreases the amount of force that the heel receives upon each impact [8, 9, 13]. 2 important determinants of success in distance running are VO2max and running economy (RE). Several studies have shown that RE is a more accurate predictor of distance running success than VO2max [21, 26, 27], and is often what distinguishes elite distance runners from very good distance runners [29]. At submaximal speeds, in which many long distance races are performed, runners who have a higher RE require less oxygen utilization than do those with low RE at a given speed. They can thereby run faster at the same relative level of oxygen cost [14, 35]. Thus, RE is an important factor to consider when investigating running performance. Barefoot running was previously found to reduce the oxygen cost of running but early research was unable to determine whether it was due to the mass of the shoe, a change in gait or both [5]. Recent work has shown that the improvement in RE during barefoot running is likely due to the decreased mass on the feet and not the changes in gait [10]. However, very few studies have assessed the RE of barefoot running. Additionally, many studies of barefoot running have used a treadmill [9, 19, 20, 37] and have not assessed overground running. Further study of this topic appears warranted. Research is needed to determine whether running barefoot can significantly reduce the oxygen cost of running overground and whether RE varies between treadmill and overground running. Therefore, the purpose of this study is to compare the economy of barefoot and shod running, and to determine whether differences exist between running on a treadmill and overground.
Training & Testing
Statistical analyses were performed using SAS (Statistical Analysis Software, Cary, NC). A 2 × 2 repeated measures ANOVA (Analysis of Variance) was used to determine the amount of variance due to the use or non-use of shoes during running and the surface (treadmill or overground). Paired t-tests were performed for each variable in order to determine if any simple effects were significant at the level of p ≤ 0.05. If a significant difference between conditions was found, the proportional reduction in error (PRE) was determined to express the magnitude of the difference [17].
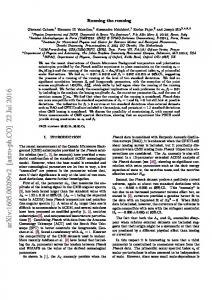
48.0 45.0 42.0 39.0
30.0 27.0
21.0 18.0 barefoot/treadmill shod/treadmill
Fig. 1
barefoot/track
shod/track
VO2 for each condition (M + SD; N = 10); no significant simple effects.
200
* 190
Table 2 Summary of VO2max testing. Mean
SD
48.8 44.4 195.1 1.05 254.8 178.4
3.6 9.2 4.9 0.05 23.7 16.4
Range
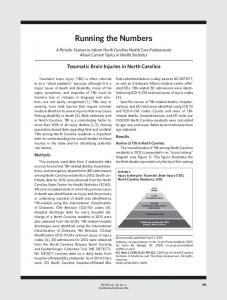
HR (beats·min–1)
180 170 160 150 140 130 120 barefoot/treadmill shod/treadmill
Fig. 2
barefoot/track
shod/track
Heart rate (HR) for each condition (M + SD; N = 10); * p=0.040.
17
**
*
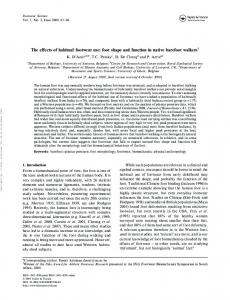
16 RPE (Rating of perceived Exertion)
4 of the subjects reported running between 16–24 km per week, 4 ran between 24–32 km per week and 2 subjects ran between 32–40 km per week. 2 subjects reported running a majority of the time barefoot; 2 reported running barefoot a few times prior to the study. The other 6 subjects had not previously run barefoot. The results of the VO2max testing for the subjects are listed ▶ Table 2. in ● The mean VO2, HR and RPE for the different conditions are dis▶ Fig. 1–3, respectively. Across the mean of the 2 surplayed in ● face conditions barefoot running was 3.8 % more economical than running with shoes (F(1,9) = 6.23, p = 0.034). HR and RPE were also significantly lower while running barefoot (F(1,9) = 8.90, p = 0.015 and F(1,9) = 18.00, p = 0.003). Across footwear conditions the mean VO2 and HR during treadmill running and overground running were not significantly different (F(1,9) = 0.60, p = 0.457 for VO2 and F(1,9) = 0.66, p = 0.438 for HR). The mean RPE for footwear was also not significantly different (F(1,9) = 0.08, p = 0.782). Interaction between the 2 main effects, footwear condition and running surface, was not significant for VO2 (F(1,9) = 1.08, p = 0.327). The corresponding interactions for HR and RPE were also not significant (F(1,9) = 0.12, p = 0.738 and F(1,9) = 0.31,
VO2max (ml · kg − 1 · min − 1) male (n = 5) female (n = 5) HRmax (N = 10) RER (N = 10) vVO2max speed (m•min − 1) 70 % vVO2max speed (m•min − 1)
33.0
24.0
Results ▼
Variable
36.0
15 14 13 12 11
44.8–52.1 31.4–55.2 185–202 0.96–1.12 214.6–295.0 150.2–206.5
10 barefoot/treadmill shod/treadmill
barefoot/track
shod/track
Fig. 3 RPE (Rating of Perceived Exertion) for each condition (M + SD; N = 10); ** p = 0.009,* p = 0.013 .
Hanson NJ et al. Oxygen Cost of Running Barefoot … Int J Sports Med
Downloaded by: Universite Laval. Copyrighted material.
Data analysis
p = 0.594, respectively). However, several of the differences in mean values for the dependent variables were of moderate size. On the treadmill, HR and RPE were significantly higher when shod compared to barefoot (p = 0.040 and p = 0.009). In the overground track condition, RPE was also significantly higher when shod (p = 0.013).
VO2 (ml·kg–1.min–1)
using a balanced Latin square design. For each condition the subject was fitted with a breathing mask which was attached to the portable metabolic cart and allowed to jog at a self-selected pace to warm up for 2–3 min before beginning the protocol. The subject then ran for 6 min at 70 % vVO2max in order to achieve steady state VO2. Pacing on the overground indoor track was done with the Nike + accelerometer, which included a sensor that was taped to the top of the subject’s foot and an iPod carried by the subject. They were asked to run as smoothly as possible and keep a regular stride rate, as the accelerometer calculates pace based on the average speed that the foot travels during each stride. Subjects were encouraged to periodically glance down at the iPod to view pace and adjust accordingly.
Discussion ▼ The major finding in this study is that barefoot running overground and on the treadmill was significantly more economical than running with shoes. In contrast, no significant differences in VO2 were found between the treadmill and the overground track regardless of the footwear condition (barefoot/shod). The magnitude of the lower VO2 while running barefoot yielded a PRE of 0.41, meaning that 41 % of the variance in VO2 was explained by the barefoot vs. shod difference. The associated PRE values due to the barefoot vs. shod difference for HR and RPE were 0.50 and 0.69, respectively. The reduced oxygen cost of barefoot running has several plausible explanations. Bramble and Lieberman [4] state the depression of the arch supplies roughly 17 % of the energy for each stance phase while running barefoot. This elastic energy may be reduced when running shod. The added mass of the shoe also contributes to the oxygen cost of running. Berg and Sady [2] studied the effect of shoe inserts on VO2. Submaximal VO2 was assessed in 15 recreational runners on a treadmill at speeds of 241 and 268 m•min − 1, with or without shoe inserts which were 75 or 100 g, depending on the size of the shoe worn. No significant differences in VO2 were found between running with or without the inserts. However, the mean relative VO2 was 0.9 % higher when using the inserts running at 241 m•min − 1, and 1.5 % higher when using the inserts and running at 268 m•min − 1. Although not significant, the results from the current study show a trend toward higher relative VO2 when using shoes compared to running barefoot: 2.0 % on the treadmill and 5.7 % on the overground track (Cohen’s d values of 0.091 and 0.029, respectively). Basset et al. [1] investigated the differences in VO2 between the treadmill and overground running at 3 different speeds between 136 and 286 m•min − 1. They did not find a significant difference in VO2 between the treadmill and overground conditions, which is in agreement with our results. Our results show a shod/ treadmill condition mean VO2 of 36.4 ml•kg − 1•min − 1 and for the shod/track condition a mean of 36.5 ml•kg − 1•min − 1, a difference of only 0.2 %. The mean HR values were 178.1 bpm and 175.7 bpm, respectively, a decrease of 1.4 %. Burkett et al. [5] studied the oxygen cost of running barefoot compared to running with shoes as well as shoes with orthotics using a range of speeds from 161 m•min − 1 to 201 m•min − 1. They found that running with shoes required 1.3 % more oxygen than barefoot and running in shoes fitted with orthotics required 2.4 % more oxygen than barefoot (p < 0.05). The study did not mention the grade of the treadmill that was used; it is assumed that it was level. The current study found a 2.0 % increase in oxygen uptake on the treadmill when running shoes were worn compared to barefoot. This is a slightly higher value than the 1.3 % seen by Burkett et al. [5] and the difference may be due to the 1 % grade that was used for the treadmill in the current study. Divert et al. [10] also found an increase in VO2 when running shod. Their subjects ran at 216 m•min − 1 on a treadmill for 6 different conditions: barefoot, ultra-thin diving socks, diving socks with 150 g of weight sewn into the fabric, diving socks with 350 g of weight, a 150 g shoe and a 350 g shoe. They found that both the 350 g weighted socks and the 350 g shoe showed significantly higher VO2 values than when the subjects were barefoot (p < 0.05).
Hanson NJ et al. Oxygen Cost of Running Barefoot … Int J Sports Med
Many runners perform some part of their training outdoors or on an indoor track, rather than on a treadmill. Therefore, it is of interest to know whether the oxygen cost varies between treadmill and overground running. However, in order to fairly compare VO2 on the 2 surfaces, a correction is needed for the increased amount of air resistance one must overcome when running overground. Previous studies have suggested that a 1 % grade on the treadmill is most similar to overground running [7, 16]. The results from the current study showed that treadmill running required 1.7 % more oxygen when compared to overground running, with the difference not being significant (p = 0.457). Thus, our results corroborate the 1 % grade as a reasonable correction factor for reduced air resistance while running on a treadmill. In order to qualitatively assess the perceptions of our subjects regarding barefoot running, they were queried after collection of data. Some responses included feeling “lighter, more responsive, and faster” while running barefoot. One subject reported some soreness in the feet after testing due to the rough surface of the treadmill belt. Another subject with a history of over-pronation while running reported slight pain on the medial ankle. Most responses were positive and all but one subject reported being likely to try barefoot running in the future. The relative absence of discomfort and injury in these subjects suggests that subjects wishing to start running barefoot might do so without a great concern for their safety. Further work is needed to clarify this point. This study may have been limited because barefoot running was novel to 6 of the 10 runners in the study. An attempt to control for this was made by encouraging the runners to practice barefoot walking and running before coming to the testing sessions. However, not all of the subjects may have done this and furthermore, it is currently unknown how much practice is necessary to become comfortable and efficient running barefoot. Variations in running mechanics and foot type were not controlled for; this could be a limitation. Another limitation is that the overground condition was performed on an indoor track that required 10 laps per mile. Running on a curved track may have increased the VO2 needed to run at the predetermined pace compared to the treadmill. Lastly, subjects were asked to maintain a pace of 70 % vVO2max using the Nike + accelerometer, but pace most likely fluctuated somewhat. However, our subjects felt that they were able to run at a steady pace that felt typical of a normal run where pace was not directly monitored. VO2 while shod on the track was 36.5 ml•kg − 1•min − 1 and on the treadmill was 36.4 ml•kg − 1•min − 1. The nearly identical values support that the pacing technique used did not alter the results. Statistical power for the analysis of running economy (RE) was about 0.60 [39] assuming the moderate to large effect size that has been reported in other studies [14, 24]. While our study was moderately underpowered, previous studies addressing RE have detected statistically significant findings with sample sizes similar to the 10 in our study. For example, significant results were found with sample sizes of 8 [37], 12 [10], and 14 [28]. Also, the subjects in our study were relatively homogeneous in regards to age, training status, and VO2max, which would tend to reduce error variance thereby enhancing statistical power. The fact that we found significantly greater RE when barefoot compared to running shod indicates that the sample size was adequate for testing the RE of shod vs. barefoot. However, the study may have been underpowered for the tests of surface condition (treadmill vs. overground) and its interaction with shod vs. barefoot.
Downloaded by: Universite Laval. Copyrighted material.
Training & Testing
Future research on this topic could be done on runners who have habituated themselves to barefoot running. Practice of running barefoot may improve skill by inducing various modifications such as stride length and stride rate. Strengthening of the intrinsic foot muscles and habituation to barefoot running may also allow for greater use of the elastic recoil in tendons and ligaments. It may also be interesting to assess the VO2 during running barefoot at faster speeds which more closely approximate competitive race pace. The elastic recoil associated with barefoot running may yield even greater energy at increased speeds. Injury prevention is important to runners, and barefoot running has been found to decrease force on the lower extremity joints [8, 9, 13]. However, future research should be performed to track barefoot runners over time to compare injury rates with shod runners. The impact of RE from barefoot running can be appreciated by examining its effect on running performance. Burkett et al. [5] indicated that a 1.7 % increase in absolute VO2 is equal to roughly a 5.0 m•min − 1 decrease in speed. Thus, each 1.0 % increase in VO2 would translate to a 2.94 m•min − 1 decrease in running speed. Application of this decrement to the 5.7 % greater oxygen cost in our subjects running overground while shod translates to being able to run 16.8 m•min − 1 faster when barefoot (5.7 × 2.94 = 16.8 m•min − 1). Over the course of a marathon (42.195 km) this increase in sustainable speed would be meaningful. For example, if one were to run an average speed of 204.8 m•min − 1 rather than 188 m•min − 1 during a marathon approximately 18 min would be saved. The current study showed a significantly lower RPE when running barefoot for both the treadmill and track conditions (p < 0.01). RPE is a subjective measure that gives some insight as to how difficult a physical activity is. Our results show that when the subjects were running at 70 % of vVO2max it felt easier for them to maintain that pace when running barefoot. This could be useful information to runners because it allows them to maintain a desired pace with a decreased sense of effort. The results from previous studies [7, 16] as well as from the current study show that a 1 % grade used on the treadmill accurately represents the increased air resistance one must overcome when running overground. This grade could be used when running indoors on a treadmill in order to keep the oxygen cost equivalent to running outdoors. The following conclusions are warranted from the results of the study: At 70 % vVO2max, barefoot running requires significantly lower VO2 than running shod, indicating higher running economy. A 1 % grade on a treadmill is an effective means of equalizing the oxygen cost of running at the same speed overground. Lastly, the effect of footwear (barefoot/shod) on VO2 was not dependent on the type of surface (treadmill/track).
References 1 Bassett DR Jr, Giese MD, Nagle FJ, Ward A, Raab DM, Balke B. Aerobic requirements of overground versus treadmill running. Med Sci Sports Exerc 1985; 17: 477–481 2 Berg K, Sady S. Oxygen cost of running at submaximal speeds while wearing shoe inserts. Res Q Exerc Sport 1985; 56: 86–89 3 Borg GA. Psychophysical bases of perceived exertion. Med Sci Sports Exerc 1982; 14: 377–381 4 Bramble D, Lieberman D. Endurance running and the evolution of Homo. Nature 2004; 432: 345–352 5 Burkett LN, Kohrt WM, Buchbinder R. Effects of shoes and foot orthotics on VO2 and selected frontal plane knee kinematics. Med Sci Sports Exerc 1985; 17: 158–163
6 Byard AD, Dengel DR. Validity of a portable metabolic measurement system. Med Sci Sports Exerc 2002; 34: S149 7 Davies CT. Effects of wind assistance and resistance on the forward motion of a runner. J Appl Physiol 1980; 48: 702–709 8 De Wit B, De Clercq D, Aerts P. Biomechanical analysis of the stance phase during barefoot and shod running. J Biomech 2000; 33: 269–278 9 Divert C, Mornieux G, Baur H, Mayer F, Belli A. Mechanical comparison of barefoot and shod running. Int J Sports Med 2005; 26: 593–598 10 Divert C, Mornieux G, Freychat P, Baly L, Mayer F, Belli A. Barefoot-shod running differences: shoe or mass effect? Int J Sports Med 2008; 29: 512–518 11 Doyne EJ, Ossip-Klein DJ, Bowman ED, Osborn KM, McDougall-Wilson IB, Neimeyer RA. Running versus weight lifting in the treatment of depression. J Consult Clin Psychol 1987; 55: 748–754 12 Drysdale IP, Collins AL, Walters NJ, Bird D, Hinkley HJ. Potential benefits of marathon training on bone health as assessed by calcaneal broadband ultrasound attenuation. J Clinical Densitometry 2007; 10: 179–183 13 Freychat P, Belli A, Carret JP, Lacour JR. Relationship between rearfoot and forefoot orientation and ground reaction forces during running. Med Sci Sports Exerc 1996; 28: 225–232 14 Guglielmo LG, Greco CC, Denadai BS. Effects of strength training on running economy. Int J Sports Med 2009; 30: 27–32 15 Harriss DJ, Atkinson G. International Journal of Sports Medicine – Ethical Standards in Sport and Exercise Science Research. Int J Sports Med 2009; 30: 701–702 16 Jones AM, Doust JH. A 1% treadmill grade most accurately reflects the energetic cost of outdoor running. J Sports Sci 1996; 14: 321–327 17 Judd CM, McClelland GH, Ryan CS. Data analysis: A Model Comparison Approach (2nd ed). New York, NY: Routledge; 2009 18 Kane NA, Simmons MC, John D, Thompson DL, Basset DR. Validity of the Nike+ Device during walking and running. Int J Sports Med 2009; 31: 101–105 19 Kerrigan DC, Franz JR, Keenan GS, Dicharry J, Della Croce U, Wilder RP. The effect of running shoes on lower extremity joint torques. PM & R 2009; 1: 1058–1063 20 Kurz MJ, Stergiou N. Does footwear affect ankle coordination strategies? J Am Podiatr Med Assoc 2004; 94: 53–58 21 Lucia A, Esteve-Lanao J, Olivan J, Gomez-Gallego F, San Juan AF, Santiago C, Perez M, Chamorro-Vina C, Foster C. Physiological characteristics of the best Eritrean runners-exceptional running economy. Appl Physiol Nutr Metab 2006; 31: 530–540 22 Lun V, Meeuwisse WH, Stergiou P, Stefanyshyn D. Relation between running injury and static lower limb alignment in recreational runners. Br J Sports Med 2004; 38: 576–580 23 Marti B, Vader JP, Minder CE, Abelin T. On the epidemiology of running injuries. The 1984 Bern Grand-Prix study. Am J Sports Med 1988; 16: 285–294 24 Millet GP, Jaouen B, Borrani F, Candau R. Effects of concurrent endurance and strength training on running economy and VO2 kinetics. Med Sci Sports Exerc 2002; 34: 1351–1359 25 Mota MR, Pardono E, Lima LC, Arsa G, Bottaro M, Campbell C S, Simoes HG. Effects of treadmill running and resistance exercises on lowering blood pressure during the daily work of hypertensive subjects. J Strength Cond Res 2009; 23: 2331–2338 26 Noakes TD. Implications of exercise testing for prediction of athletic performance: A contemporary perspective. Med Sci Sports Exerc 1988; 20: 319–330 27 Noakes TD. The Lore of Running. Champaign, IL: Leisure Press; 1991 28 Pinnington HC, Dawson B. The energy cost of running on grass compared to soft dry beach sand. J Sci Med Sport 2001; 4: 416–430 29 Pollock ML. Submaximal and maximal working capacity of elite distance runners, Part I: Cardiorespiratory aspects. Ann NY Acad Sci 1977; 301: 310–322 30 Rao UB, Joseph B. The influence of footwear on the prevalence of flat foot. A survey of 2300 children. J Bone Joint Surg Br 1992; 74: 525–527 31 Robbins SE, Gouw GJ. Athletic footwear and chronic overloading: a brief review. Sports Med 1990; 9: 76–85 32 Robbins SE, Hanna AM. Running-related injury prevention through barefoot adaptations. Med Sci Sports Exerc 1987; 19: 148–156 33 Robbins S, Waked E. Hazard of deceptive advertising of athletic footwear. Br J Sports Med 1997; 31: 299–303 34 Robbins S, Waked E. Balance and vertical impact in sports: Role of shoe sole materials. Arch Phys Med Rehabil 1997; 78: 463–467
Hanson NJ et al. Oxygen Cost of Running Barefoot … Int J Sports Med
Downloaded by: Universite Laval. Copyrighted material.
Training & Testing
Training & Testing
41
42
43
44
injuries in long distance runners: A systematic review. Br J Sports Med 2007; 41: 469–480 Wilks DC, Winwood K, Gilliver SF, Kwiet A, Chatfield M, Michaelis I, Sun LW, Ferretti JL, Sargeant AJ, Felsenberg D, Rittweger J. Bone mass and geometry of the tibia and the radius of master sprinters, middle and long distance runners, race-walkers and sedentary control participants: A pQCT study. Bone 2009; 45: 91–97 Williams PT. Lower prevalence of hypertension, hypercholesterolemia, and diabetes in marathoners. Med Sci Sports Exerc 2009; 41: 523–529 Williams PT. Reduction in incident stroke risk with vigorous physical activity: Evidence from 7.7-year follow-up of the national runners’ health study. Stroke 2009; 40: 1921–1923 Young CC, Rutherford DS, Niedfeldt MW. Treatment of plantar fasciitis. Am Fam Physician 2001; 63: 467–474 , 477–478
Downloaded by: Universite Laval. Copyrighted material.
35 Saunders PU, Pyne DB, Telford RD, Hawley JA. Factors affecting running economy in trained distance runners. Sports Med 2004; 34: 465–485 36 Schneider S, Askew CD, Diehl J, Mierau A, Kleinert J, Abel T, Carnahan H, Struder HK. EEG activity and mood in health orientated runners after different exercise intensities. Physiol Behav 2009; 96: 709–716 37 Squadrone R, Gallozzi C. Biomechanical and physiological comparison of barefoot and two shod conditions in experienced barefoot runners. J Sports Med Phys Fitness 2009; 49: 6–13 38 Stacoff A, Nigg BM, Reinschmidt C, van den Bogert AJ, Lundberg A. Tibiocalcaneal kinematics of barefoot versus shod running. J Biomech 2000; 33: 1387–1395 39 Thomas J, Nelson J. Research Methods in Physical Activity (3rd ed.). Champaign, IL: Human Kinetics; 1996; 111 40 van Gent RN, Siem D, van Middelkoop M, van Os AG, Bierma-Zeinstra SM, Koes BW. Incidence and determinants of lower extremity running
Hanson NJ et al. Oxygen Cost of Running Barefoot … Int J Sports Med