Page 2 ...... âFun Learning Stagecast Creator: An Exercise in Minimal- ism and Collaboration,â Proc. IEEE Human-Centric Com- puting Languages and ...
Pair Collaboration in End-User Debugging Thippaya Chintakovid and Susan Wiedenbeck Drexel University Philadelphia, PA 19104 USA {tc79,sw53}@drexel.edu
Abstract The problem of dependability in end-user programming is an emerging area of interest. Pair collaboration in end-user software development may offer a way for end users to debug their programs more effectively. While pair programming studies—primarily of computer science students and professionals— report positive outcomes in terms of overall program quality, little is known about specific activities that pairs engage in that lead to those outcomes, or of how the previous results may pertain to end-user programmers. In this study we analyze protocols of end-user pairs debugging spreadsheets. The results suggest that end-user pairs can achieve rich reasoning, effective planning, and systematic evaluation. Furthermore, end-user pairs provide specific types of mutual support that facilitate the accomplishment of their goals.
Margaret Burnett and Valentina Grigoreanu Oregon State University Corvallis, OR 97331 USA {burnett, grigorev}@eecs.oregonstate.edu
Pair collaboration has precedents in the field of software development. It has been used by professional programmers in the Extreme Programming development methodology. Pair programming for pedagogical purposes has been adopted in university programming courses. Positive evidence about pair programming has been reported for both professional and student programmers [8, 9, 12, 13, 14]. To date pair research has not addressed end users, their tasks, and tools. Furthermore, extant studies on pair collaboration in software development focus on quantitative performance or user perceptions. There has been little qualitative research on the nature of the interactions that underpin these results. In this study we use qualitative methods to take a closer look at the cognitive and social mechanisms employed by endusers pairs. The contribution of the study is a detailed understanding of how pair collaboration supports enduser debugging in the context of spreadsheets.
1. Introduction
2. Background
End users face formidable challenges in debugging. Their programming knowledge is moderate to begin with, and their performance skills are often weak because of intermittent use. Consequently, they are likely to have difficulty comprehending code, devising test cases, and correcting bugs. Support features for enduser debugging that are built into software environments can aid end users substantially. However, human support may also be valuable in achieving effective debugging. This paper reports on a study of end users collaborating in spreadsheet debugging. The goal of the study is to understand the kinds of support that pair collaboration affords in the debugging task. Pair collaboration in end-user debugging is motivated by the field of distributed cognition within cognitive science. Distributed cognition [3, 4] views a task together with the people and artifacts that participate in it as forming a complex cognitive system. In the system, no one entity possesses all the knowledge and skill; instead it is distributed among the individuals and artifacts. Speech and actions, with feedback from artifacts, externalize the cognitive state of the system, supporting task outcomes via sharing of cognition.
Pair collaboration is a method in which two individuals work together in a role-based protocol. The participants sit together in front of a single monitor. One person is the driver who controls the mouse and keyboard and is responsible for writing code. The other person is the observer who reviews the work and gives advice and support to the driver. The participants switch roles regularly, with equal time in each role. Pair collaboration has gained popularity in both academic and industry settings. Prior research with student and professional programmers reports several benefits of pair collaboration including better defect detection and correction, higher quality programs, and more readable and functional programs [9, 13]. Student and professional programmers also report greater confidence and enjoyment in programming than when programming alone [8, 9, 13]. End-user pair programming has not yet been studied, although the pair setting has occasionally been used for other purposes. For example, there has been a pairs study using the Forms/3 spreadsheet [6]; however, the pairs were not investigated per se. They were simply used to encourage thinking aloud about infor-
Visual Languages and Human-Centric Computing (VL-HCC'06) 0-7695-2586-5/06 $20.00 © 2006
mation needs. Also, pairs developing interactive simulations were used to explore collaborative learning of end-user programming by school children [11]. The rationale given for pair collaboration is twofold [12, 13]. First, pairs encourage each other to high effort and persistence (referred to as “pair pressure”). Second, they share their domain and programming knowledge, increasing the pair’s ability to succeed compared to an individual (referred to as “pair learning”). A pair has the potential to generate and evaluate more alternative plans, as opposed to rushing to implement the first plausible idea [12]. The pair programming literature has identified several behaviors that pairs engage in to push a programming task to successful completion. The driver writes the design or code, and thus is seen as having primary control of the emergent artifact. The observer has several roles: generating alternatives, suggesting courses of action, reviewing the driver’s work (syntax, logic, typographical errors), and keeping a higher level strategic sense of how the design is evolving [13, 14]. These behaviors seem promising in supporting the efforts of end-user programmers to improve the dependability of their programs. Although end-user programming occurs in several paradigms, one of the most important and widespread is the spreadsheet paradigm. Spreadsheets are an important and very widespread end-user environment. End users of spreadsheets generally have low programming experience, which leads to challenges in programming even moderately complex spreadsheets. Indeed, studies of spreadsheet dependability have shown that spreadsheets are rife with errors [10]. This problem of dependability encourages our investigation of pair collaboration in this paradigm.
3. Methodology 3.1 Participants Twelve university students took part in the study reported here. Since our target population is spreadsheet end users, we recruited students with little or no computer programming experience. Participants worked in pairs. There were three male pairs and three female pairs. Participants either came to the study with a student they knew or were paired with another student by the researcher. Counts of the pairs’ coded verbalizations suggest that the pairs assigned by the researcher were not more constrained in their communication than pairs who knew each other.
3.2 Environment and Task The environment was the Forms/3 research spreadsheet system, which includes WYSIWYT (“What You See Is What You Test”). WYSIWYT is a collection of testing and debugging features that allow users to in-
Visual Languages and Human-Centric Computing (VL-HCC'06) 0-7695-2586-5/06 $20.00 © 2006
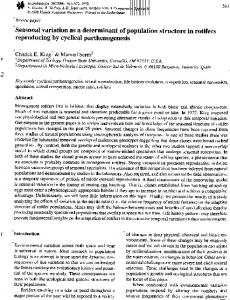
crementally “check off” or “X out” values that are correct or incorrect, respectively [2]. In WYSIWYT untested cells have red borders (light gray in this paper). See Figure 1. When users notice a correct value, they can place a checkmark (¥) in the decision box at the corner of the cell they observe to be correct. Placing a checkmark indicates a successful test and increases “testedness” of a cell according to a test adequacy criterion based on formula expression coverage. As a cell becomes more tested, the cell’s border becomes more blue (more black in this paper).
Figure 1. WYSIWYT features: checkmarks and Xmarks (in decision boxes of cells), arrows, cell border colors, cell interior colors, tooltips
Users can also place an X-mark in the cell’s decision box when they notice an incorrect value. X-marks trigger fault likelihood calculations, which cause the interiors of cell suspected of containing faults to be colored in shades along a yellow-orange continuum (shades of gray in this paper). Optional dataflow arrows, which the user can turn on and off at will, allow users to see relationships between cells. The arrows are colored to reflect testedness of specific relationships between cells and subexpressions. Also notice in Figure 1 two user feedback features: tooltips which pop up when the mouse hovers over an item and the bars at the top showing the spreadsheet’s overall testedness (top bar) and estimated bug likelihood distribution (second bar). Our ongoing experiment consists of two spreadsheets, Gradebook and Payroll, but the analysis dealt only with Gradebook. Gradebook is a typical spreadsheet for calculating student course grades. The spreadsheet has been used in several past experiments (e.g., [1]). The Gradebook spreadsheet was seeded with five faults that provided coverage of the categories in Panko’s classification system [10]: three mechanical faults, one logical fault, and one omission fault.
The participants were given the Gradebook spreadsheet, a written description of the spreadsheet, and two examples with correct values. Due to constraints of the larger ongoing study, the Gradebook and Payroll tasks were counterbalanced, so half the pairs debugged the Gradebook first and half debugged it second. The Gradebook task had a time limit of 22 minutes. The participants were instructed, “Test the…spreadsheet to see if it works correctly and correct any errors you find.”
3.3 Pair Procedures Pairs participated one at a time. First, the two individuals sat at separate computers to complete a handson tutorial on the environment. Using a sample spreadsheet, they learned how to enter input values and edit formulas. They also were introduced to and given opportunities to practice the new WYSIWYT features Next, the individuals sat side-by-side at a computer, with one monitor and one mouse. They were given instructions about pair roles and were told that they would be prompted to switch roles halfway through the task. They were told to discuss with their partner while carrying out the task. Their sessions were videotaped.
3.4 Development of the Coding Scheme The analysis focused on the content of the verbalizations supplemented by non-verbal actions visible in the videotapes [5, 7]. First, the verbalizations were transcribed and annotated with the actions visible in the video. Next, the protocols were divided into episodes based on changes of focus, usually a change from one cell to another. Initial codes were developed based on pair programming literature that suggested typical types of pair interactions [12] and an earlier pair-based study of Forms/3’s explanation system [6]. In the next step two
of the researchers applied the codes to the transcript of a pair who debugged the Gradebook, looking for: (1) evidence that the initial codes were relevant and (2) other elements in the protocol that should be coded. The transcript used was not one of the six pairs reported in this study; this transcript was held back from the study to use it for this purpose. As a result of this procedure, several codes were added and rules were developed for applying them. In the final coding scheme (Table 1), there were 13 codes organized into four categories representing the primary activities of the participants: reasoning, action planning, evaluation, and partner support. Next the two researchers applied the coding scheme independently to one protocol included in this study. Disagreements on the application of the codes were noted and the rules for application of the codes were made more precise. Subsequently, the remaining five protocols were coded independently by the two researchers. The level of agreement was calculated, after correcting simple slips in coding. Agreement was 89 percent, within accepted standards of reliability.
4. Results In this section we first report descriptive statistics of pair performance outcomes. (These statistics are presented simply to establish the context for the following protocol results; we remind readers that the experiment was not designed to support statistical analysis per se.) This provides important context for the remainder of the results. We then present results from the coded pair protocols. The protocols consist of qualitative data, mostly verbalizations. We present quantitative counts of the coded protocols, which are further informed by examples of qualitative verbalizations and pair behaviors.
Table 1. The coding scheme Code category Reasoning codes
Code name Reasoning request Reasoning provide
Action planning codes
Evaluation codes Partner support codes
Strategy question Strategy hypothesis Testing tactics Formula building Evaluation request Evaluation provide Feature/feedback question Feature/feedback explanation Logistic support request Logistic support provide Coordination activity
Visual Languages and Human-Centric Computing (VL-HCC'06) 0-7695-2586-5/06 $20.00 © 2006
Description Explicit request for help in reasoning or question asking for explanation of partner’s reasoning Statement providing help in reasoning or giving explanation of the reasoning Explicit question about what is a suitable process or what to do next Statement suggesting a hypothesized strategy or next step Statements suggesting how to carry out specific test cases Statement describing or dictating how a formula should be written Explicit request for evaluation of actions taken or review of progress Statement evaluating actions or reviewing progress Question about the meaning of the system’s visual feedback or action items Statement providing explanation of the system’s feedback or action items Explicit request or verbal suggestion for logistic support Provision of logistic support Verbalizations or actions to coordinate with partner
4.1 Summary of Pair Performance Table 2 shows performance measures of the six pairs and a ranking of the pairs (where 1 indicates highest performance), based on a combination of two indicators: seeded bugs fixed and percent testedness of the spreadsheet. None of the pairs introduced bugs that remained in the spreadsheet at the end of the task. Table 2: Pair performance Pair
Gender
P4 P5 P2 P1 P6 P3
F F M M F M
Bugs fixed (out of 5) 4 4 4 4 1 0
Percent testedness 100 90 86 77 80 40
Rank 1 2 3 4 5 6
Table 3 summarizes for each pair the use of the different debugging features, including the familiar feature of editing formulas and the new debugging features available in the WYSIWYT environment. The total number of features used by pairs ranged from 36 to 57. The mean feature usage was 43.67 and the median was 38.5. Table 3: Pairs’ use of debugging features (ordered by rank as in Table 2) Pair Gender Formula edit X-mark Check-mark Arrow P4 F 10 (27.78%) 0 26 (72.22%) 0 P5 F 21 (36.84%) 0 36 (56.14%) 4 (7.02%) P2 M 12 (31.58%) 0 23 (60.53%) 3 (7.89%) P1 M 8 (21.05%) 0 23 (60.53%) 7 (18.42%) P6 F 1 (2.56%) 0 29 (69.23%) 11 (28.21%) P3 M 1 (1.85%) 0 35 (64.81%) 18 (33.33%)
Discussion The four high-performing pairs, each of which fixed four bugs, used a combination of formula inspection, formula edits, and testing. More specifically, they relied on examining formulas and testing values to discover seeded bugs and made multiple edits in attempting to correct bugs. The videos show that the main reason for the high number of edits was an iterative style of debugging, in which pairs made small, incremental changes, usually testing each formula edit immediately. The two low-performing pairs each made only one formula edit. Instead, they concentrated on trying out different input values. Note that P6 made good use of these tests, achieving 80% testedness (Table 2), whereas P3 did not seem concerned with achieving higher testedness. Previous studies have shown ties between higher testedness and successful bug fixing [2]. Still, since neither of these pairs made many formula edits, they could not make much progress.
Visual Languages and Human-Centric Computing (VL-HCC'06) 0-7695-2586-5/06 $20.00 © 2006
The low-performing pairs used a higher number of arrows. Turning on the arrows allowed them to see relationships of cells and the testedness of the relationships, but again this did not lead to actually correcting seeded bugs. By contrast, the high-performing pairs used the arrows less often and specifically for finding difficult bugs. Five pairs used the checkmark feature systematically to push the testing forward. Finally, the X-marks, which give fault likelihood feedback for a value suspected to be wrong, went unused. This may not be surprising: in a previous study of individuals debugging the Gradebook [1], the X-mark was sparsely used, apparently because the spreadsheet was simple enough for most users to make progress without fault localization help. Additionally, pairs had the reasoning support of two individuals, which may have further reduced the perceived need of using X-marks. Recall that the two spreadsheets, Gradebook and Payroll, were counterbalanced. This provided an opportunity to look for differences when pairs had varying levels of familiarity with the environment. Pairs who debugged Gradebook first had 33 percent more coded verbalizations than pairs who did it second. This suggests that pairs debugging Gradebook first required more communication to understand the environment and task. However, the counts of the coded verbalizations were proportional regardless of the order in which pairs debugged the spreadsheet.
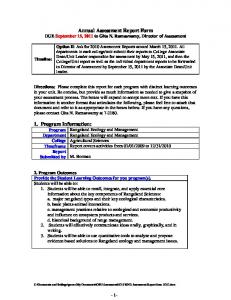
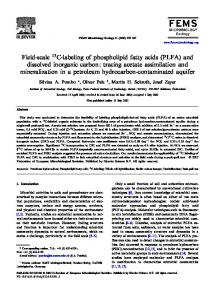
4.2 Driver and Observer Roles A total of 1356 verbalizations were assigned codes in the analysis. Recall that each individual served as both a driver and observer. The mean number of codes assigned was 45.33 (SD 18.17, n=12) for drivers and 65.42 (SD 25.75, n=12) for observers. Discussion The protocols show that drivers and observers were both strongly engaged in debugging and kept each other on track—the “pair pressure” described by Williams and Kessler [12, 13]. The term “observer” may suggest a less active role, but observers in this study were involved in the classical activities identified in pair programming: reviewing, monitoring, suggesting approaches [12], as well as providing logistic support. Although individuals in the observer role made more coded verbalizations, the driver role involved much more than editing formulas. The primary effort in debugging, shared by both observer and driver, centered on identifying bugs and figuring out how they might be fixed, a strongly cognitive activity. The driver controlled the spreadsheet, but used that control to facilitate the cognitive work, opening and closing formulas, entering and changing cell values as needed, bringing up arrows and tooltips, and placing checkmarks. Carry-
ing out these actions may explain the lower verbalizations of drivers. 40
O: Oh, go up there and change it to 40.
35
Percentage
30 25
21.91 20.05
20
Observer Driver
15 9.88 10
6.04 13.79
5
branches of formulas that needed to be tested and choosing appropriate input values for testing. For example:
12.69 7.3
6.34
0 Reasoning
Action Planning
Evaluation
Partner Support
Code categories
Figure 2: Code categories by role
4.3 Cognitive Activities Cognitive activities of pairs included reasoning, action planning, and evaluation. Reasoning requests and provision of reasoning responses together accounted for 12.38 percent of all coded verbalizations (Figure 2). Reasoning was highly focused on understanding the formulas and determining whether they corresponded to the narrative description of the problem provided in writing. Pairs’ reasoning was conversational. Typically, one partner stated his or her reasoning and asked for the partner (explicitly or implicitly) to respond. This was usually followed by more reasoning from the other partner, eventually coming to a conclusion. For example, in reasoning about a formula for choosing one of two midterm examination scores: D: …if midterm 1 is less than midterm 2, then you pick midterm 1? O: It should be if midterm 1 is greater than midterm 2, then you pick midterm 1, else midterm 2. Action planning activities were generally of the following types: strategy questions and strategy hypotheses (together accounting for 22.72 percent of all coded verbalizations), tactics for testing the spreadsheet (7.67 percent), and building formulas (5.31 percent). Regarding strategy, there were few strategy questions, but strategy hypotheses were the most common of the 13 codes. Observers were more active than drivers in stating strategy hypotheses. For example, before entering values in the input cells: D: Ok, er..you wanna make it [Quiz4] lower or ..? O: Just..yeah, make it lower. The activity of devising testing tactics concentrated on how to test all of the situations in the formulas. Pairs were jointly concerned with identifying different
Visual Languages and Human-Centric Computing (VL-HCC'06) 0-7695-2586-5/06 $20.00 © 2006
The activity of building (i.e., writing or revising) formulas was collaborative in all but simple changes. If a formula edit involved rewriting the entire formula or modifying it extensively, the observer typically dictated what to type to the driver in a step-by-step manner. The driver verbally verified the instructions in each step by repeating them out loud. Notably, the testing tactics and formula building verbalizations were fewer percentage-wise than strategy verbalizations. When pairs reached the point of actually correcting formulas and testing they were ready to push directly toward their goal with a minimum of discussion. Requests for and provision of evaluation together accounted for 17.18 percent of all coded verbalizations. Evaluation involved two related activities: evaluating a test case to determine whether a value was correct and reviewing the current state of the debugging effort in a broader sense. Evaluations of both kinds were largely spontaneous; there were few explicit requests for reviews. In the evaluation of test cases the verbalizations were most often just a few words, since the participants could verify whether a cell was correct by looking at the values in the given examples. For example: D: Midterm average is 89. That’s right. Elaboration on the evaluation occurred when a value was found to be wrong by comparison to the example. In such cases, the participants were apt to question or hypothesize why the test failed. For example, after a failed test: O: Do we have the right formula? Reviews of progress on a larger scale occurred rarely, not more than once or twice in any given protocol. In our data the observer initiated and carried out the review. For example, initiating a review: O: What else is not tested? In one case, the observer asked the researcher for a pencil. Then the observer scanned the cells systematically, taking notes as she went, to determine each cell‘s testedness status. Discussion The protocols indicate that the core of the debugging effort was determining whether a cell value was correct (evaluation), what the source of an error might be (reasoning), and what course of action to take (strategy). Developing tactics for specific tests and actually correcting formulas were less demanding. While they had to be carried out correctly to succeed in debugging,
they were more procedural in nature. Once a pair understood that they had to test all situations and that they should vary input values to achieve that goal, they had little difficulty in deciding how to approach the testing. In writing or editing formulas, syntactic and logical misunderstandings occurred, but pairs were observed to experiment to correct the formulas (e.g., sharing their knowledge, trying out hypotheses about structuring the formula code, looking at similar formulas as examples). Exceptions to this generalization are the two low-performing pairs who avoided modifying formulas.
4.4. Social Support Mechanisms Mutual support included feature and feedback questions and explanations (together accounting for 3.83 percent of all coded verbalizations), requests for and provision of logistic support (24.19 percent), and coordination activities (4.72 percent). Participants used WYSIWYT features in the tutorial, but questions and misunderstandings still arose during the task. Partners supported each other by giving explanations. For example, the following question and answer sequence about the cell border color: O: Why [did] it get purple? D: What? Oh, there’s another area you have to check. Participants largely understood the meaning of the features and feedback. The number of questions and explanations was low. Requests for and provision of logistic support were both prominent activities. The types of support included reading aloud to one’s partner the written description of the spreadsheet problem, the values from the examples, and the tooltips. Other types of logistic support were helping the partner locate a particular cell in the spreadsheet, opening a formula that the partner wanted to view, and reminding the partner to do routine tasks. For example, after a test: O: Don’t forget to put the [former] values back. The usual pattern was that the driver requested logistic support and the observer supplied it, except for manipulations of the spreadsheet which were the driver’s responsibility. The division of labor was established with little discussion. Sporadically, drivers also asked for help to locate where a particular cell was. For example, a driver asked an observer to help her locate a particular cell: D: Where’s the midterm average [cell]? O: That’s that one right there. Activities directed toward keeping the partners coordinated were prominent in all the pairs. Coordination
Visual Languages and Human-Centric Computing (VL-HCC'06) 0-7695-2586-5/06 $20.00 © 2006
took several forms. One was verbalizations suggesting how to start debugging, for example: O: What do you want…er…to look at first? Another type of coordination activity was announcing changes in focus. When the partners finished testing one cell, one of them normally stated which cell they were moving on to next. Generally, there was little discussion about it, and the participants often acted accordingly without any prompting: the driver automatically opened the cell and (sometimes) the observer read aloud the correct value of the cell in the example. Verbal clarifications or pointing were used by partners to assure they were both looking at the same cell. A further pair coordination activity was reading alternate lines of formulas and descriptions aloud and finishing each other’s verbalizations. Discussion Partner interaction and support were essential to working together. The partners talked almost continually, with only short, infrequent silent gaps. These gaps were rarely more than about 15 seconds, substantially shorter than gaps of 45-60 seconds reported in pairs programming [14]. Partners provided key logistic support that eased the effort and speeded the activities. The high percentage of requests for and provision of logistic support underline the many small subtasks and the value of having help to manage them. Coordination activities appeared to be a necessary overhead of collaboration. However, eventually most pairs established such smooth functioning that they anticipated the partner’s needs and responded to them without prompting.
4.5 Within-Pair Interactions We classified individuals in each pair by their contributions to the pair effort. The classification was qualitative and quantitative. Two of the researchers individually watched the video of each pair, rating the individuals in a pair on whether one of them largely took the lead in the debugging task or whether they made relatively equal contributions over the course of the task. The researchers agreed on all six pairs. To crosscheck the rating quantitatively, we summed three key debugging activities for each individual in a pair. The key activities were: reasoning provide, strategy hypothesis, and evaluation provide. The columns “High Partner” and “Low Partner” in Table 4 show sums of the raw counts. (Note that the high and low partners can only be compared within the pair but not between pairs, as pairs had different total code counts.) The rightmost column in Table 4 indicates which pairs had a lead partner. The quantitative results show substantial differences between the high and low partner in the pairs that are indicated as having a lead part-
ner (pairs P1, P4, and P5). Pairs P2 and P6 have small differences in the key activities between the high and low partner. These are consistent with the qualitative analysis, which categorized them as not having a lead partner. Pair P3 was qualitatively rated as not having a lead partner, but the quantitative results did not support the qualitative results clearly. This lack of confirmation of the qualitative results seems to occur because the quantitative approach missed an important subtlety: this pair had low substantive content in their verbalizations. Thus, although one partner talked more, it could not be said that the individual was leading the effort. Table 4: Pair Leadership (ordered by rank as in Table 2) Pair
Gender
P4 P5 P2 P1 P6 P3
F F M M F M
High Partner 50 64 44 95 54 86
Low Partner 20 19 35 24 43 56
Lead Partner Yes Yes No Yes No No
Discussion In pairs with a lead partner, that partner remained the prime mover whether currently in the driver or observer role. A lead partner who gave many explanations to the other partner educated the partner. For example, in pair P5, the non-lead partner initially was reluctant to reason or strategize, but she became noticeably more active with the lead partner’s explanations and modeling, another example of “pair learning” [13]. In pairs without a lead partner, the nature of the pair interactions varied. One pattern was for the current observer to take the lead, resulting in leadership changes during the task. In another pattern, partners were more equal across roles. With respect to concerns about unequal partners in pairs programming [14], our data showed no social loafing by non-lead partners.
4.6 Pair Performance Revisited Based on feature usage (Table 3), it appears that high formula edits and testing, and low use of arrows, were associated with (but not necessarily predictive of) successful debugging outcomes. But how do the patterns of pair interactions, as captured in the coded verbalizations, relate to successful debugging outcomes? To approach this question, we focused on the two highest performing pairs (P4 and P5) and the two lowest performing pairs (P3 and P6), looking for differences in their amount of verbalizations and deriving inferences about performance. Given the small number of pairs, the inferences are necessarily tentative and should be seen as hypothesis finding.
Visual Languages and Human-Centric Computing (VL-HCC'06) 0-7695-2586-5/06 $20.00 © 2006
The greatest differences in verbalizations between the low and high-performing pairs occurred in the following four codes: formula building, reasoning provide, logistic support provide, and coordination activity. These are discussed below. The low-performing pairs made substantially fewer verbalizations about formula building than the highperforming pairs (as a percentage of all coded verbalizations: low-performing M=0.18, SD=.0.25; highperforming M=8.16, SD=1.67). By contrast, the lowperforming pairs provided more reasoning statements to each other than the high-performing pairs (lowperforming M=10.08, SD=1.40; high-performing M=5.16, SD=3.40). The low-performing pairs discussed their reasoning about the formulas rather extensively compared to the high-performing pairs, but were averse to taking the next step of modifying formulas. This suggests that they were uncertain about whether the formulas were correct, consequently spent more time reasoning and discussing, and ultimately did not attempt to make changes. We noticed multiple instances in both P3 and P6 where the pair navigated away from the cell they were currently inspecting without verbalizing a clear opinion about whether the cell formula was correct or not. The high-performing pairs, P4 and P5, reasoned and discussed less, but most often came to a conclusion about the correctness of the formula and acted to change the formula, if necessary. While there may be multiple reasons why the highperforming pairs were more successful at fixing bugs, our verbal data suggest that their debugging strategy was more systematic than the low-performing pairs. By systematic we mean that they carefully followed the set of examples provided in the task description that included input cell values and calculated cell values for the correct spreadsheet. The high-performing pairs entered these input values in the spreadsheet to see whether the calculated cells corresponded to the example. This helped them identify incorrect values that might indicate a bug. The systematic use of these example materials is reflected in a higher number of logistic support provide verbalizations made by the highperforming pairs than the low-performing pairs (lowperforming M=13.94, SD=.6.00; high-performing M=20.23, SD=8.39). Systematically using the task description and examples was important. The lowperforming pair P3, for instance, did not use the examples in the task description until very late in the task. Entering their own input values rather than the example values, the pair had no idea of whether the calculated cells were correct and no idea of where to look for formula errors. Without some direction about which cells to investigate, they did not find any bugs. Since the high-performing pairs adopted a systematic and mutually agreed upon strategy, they required
less verbalization to coordinate their activities compared to the low-performing pairs (low-performing M=10.60, SD=2.76; high-performing M=5.36, SD=0.18). P4, the best-performing pair, debugged the spreadsheet by carefully following the task description and examples provided. This pair was very aware of each other’s current focus and information needs, for example, carrying out anticipatory actions such as reading a part of the task description aloud or opening a formula without the partner making a verbal request. In the low-performing pairs P3 and P6, there were recurring instances in which the members of the pairs talked at cross purposes because they failed to track what their partner was attending to and speaking about. This required repair via coordination verbalizations before the pair could move on with the task.
5. Conclusion This investigation of pair activities in collaborative debugging of spreadsheets suggests that: • Both the driver and the observer were continually involved in all other aspects of the debugging effort. There was no evidence of social loafing, even in pairs with a strong leader. • The most common cognitive activities consisted of strategy questions/hypotheses. Pairs used strategy questions and hypotheses to elicit discussion and push their debugging toward action. • Most partners adapted quickly to working in pairs and developed effective protocols to support each other. It appears that competent partner support is important to debugging success. In on-going work, we are carrying out a qualitative study of individuals and pairs in end-user debugging in order to compare the nature of their activities. This comparison may give insights about how to better support both individuals and pairs in debugging. Other future work will focus on determining whether pair collaboration in end-user debugging increases selfefficacy and performance compared to individuals.
Acknowledgments This work was supported in part by the EUSES Con-
Visual Languages and Human-Centric Computing (VL-HCC'06) 0-7695-2586-5/06 $20.00 © 2006
sortium via NSF grants CCR-0324844 and ITR0325273.
6. References [1] L. Beckwith, M. Burnett, S. Wiedenbeck, C. Cook, S. Sorte, and M. Hastings. “Effectiveness of End-User Debugging Software Features: Are There Gender Issues? Proc. CHI 2005, ACM, 2005, pp. 869-878. [2] M. Burnett, C. Cook and G. Rothermel, “End-User Software Engineering,” CACM, Vol. 47, No. 9, 2004, pp. 53-58. [3] N. V. Flor and E. L. Hutchins, “Analyzing Distributed Cognition in Software Teams,” Empirical Studies of Programmers: Fourth Workshop, Ablex, Norwood, NJ, 1991, pp. 36-59. [4] J. D. Hollan, E. Hutchins, and D. Kirsh, “Distributed Cognition: A New Foundation for Human-Computer Interaction Research,” ACM Trans. on Human-Computer Interaction, Vol. 7, No. 2, 2000, pp. 174-196. [5] B. Jordan and A. Henderson. “Interaction Analysis: Foundations and Practice,” The Journal of the Learning Sciences, Vol. 4, No. 1, 1995, pp. 39-103. [6] C. Kissinger, M. Burnett, S. Stumpf, N. Subrahmaniyan, L. Beckwith, S. Yang, and M. B. Rosson, “Supporting EndUser Debugging: What Do Users Want to Know?” Proc. Advanced Visual Interfaces, ACM, 2006, pp. 135-142. [7] K. Krippendorff. Content Analysis: An Introduction to Its Methodology, Sage Publications, Everyly Hills, CA, 1980. [8] C. McDowell, L. Werner, H. E. Bullock, J. Fernald "The impact of pair programming on student performance, perception and persistence," in Proc. Int. Conf. on Software Engineering, IEEE, 2003, pp. 602-607. [9] T. J.Nosek, “The Case for Collaborative Programming,” CACM, Vol. 41, No. 3, 1998, pp. 105-108. [10] R. Panko, “What We Know About Spreadsheet Errors,” J. of End User Computing, Vol. 10, No. 2, 1998, pp. 15-21. [11] C. Seals, M. B. Rosson, J. Carroll, T. Lewis, L. Colson, “Fun Learning Stagecast Creator: An Exercise in Minimalism and Collaboration,” Proc. IEEE Human-Centric Computing Languages and Environments, IEEE, 2002, pp. 177186. [12] L. A. Williams and R. B. Kessler, “Experiments with Industry’s ‘Pair-Programming’ Model in the Computer Science Classroom,” Computer Science Education, Vol. 11, No. 1, 2001, pp. 7-20. [13] L. Williams and R. Kessler, Pairs Programming Illuminated, Addison Wesley, Boston, MA, 2003. [14] L. A. Williams, E. Wiebe, K. Yang, M. Ferzi, and C. Miller. “In Support of Pair Programming the Introductory Computer Science Course,” Computer Science Education, Vol. 12, No. 3, 2002, pp. 197-212.