Cuadernos de Investigación Geográfica
2017
Nº 43
pp. xxx - xxx
http://doi.org/10.18172/cig.3234
ISSN 0211-6820 EISSN 1697-9540
© Universidad de La Rioja
N
VE RS IO
DEGLACIATION OF THE COLORADO ROCKY MOUNTAINS FOLLOWING THE LAST GLACIAL MAXIMUM E.M. LEONARD1*, B.J.C. LAABS2, A.D. SCHWEINSBERG3, C.M. RUSSELL1, J.P. BRINER3, N. YOUNG4 1
Department of Geology, Colorado College, Colorado Springs, CO 80903, USA.
2
E-P RIN T
Department of Geosciences, North Dakota State University, Fargo, ND 58108-6050, USA. 3
Department of Geology, University at Buffalo, Buffalo, NY 14260, USA.
4
Lamont-Doherty Earth Observatory, Columbia University, Palisades, New York 10964-8000, USA.
RA
CC
EP
TE
D.
PR
ABSTRACT. The availability of almost 180 cosmogenic-radionuclide (CRN) surface-exposure ages from moraine boulders and glacially polished bedrock surfaces makes possible an assessment of the timing and character of the local Last Glacial Maximum (LLGM) and subsequent deglaciation in the Colorado Rocky Mountains. A review of glacial chronologies and numerical modeling results indicates that although glaciers across Colorado responded broadly synchronously, apparent differences in the timing and magnitude of glacier retreat following the LLGM suggest that spatially variable regional forcing, possibly precipitation related, played a role in glacier behavior along with more spatially uniform hemispheric or global forcing. Glaciers in the five ranges examined reached their greatest LLGM extents before ~19.5 ka and abandoned their outermost LLGM moraines between ~23.5 and 19.5 ka. Detailed deglaciation chronologies are available for glaciers in four of the ranges. In the Sawatch Range and Sangre de Cristo Mountains, glaciers were near their LLGM extents at 17-16 ka, before retreating rapidly. In the San Juan Mountains and the Front Range, glaciers may have begun their post-LLGM recession earlier, although early deglaciation is indicated by only a few ages on polished bedrock that potentially contains pre-LLGM CRN inheritance, and thus may be too old. Regardless of the timing of the onset of deglaciation, the equilibrium-line rise associated with deglaciation was earlier and significantly larger in the San Juan Mountains than elsewhere in Colorado. This suggests that the San Juan Mountains, located well to the southwest of the other ranges, may have experienced enhanced precipitation during the LLGM, as did areas farther to the south and west, while LLGM conditions may have been drier in the northern and eastern Colorado ranges. A breakdown in this pattern after the LLGM, with precipitation decreasing in the south and west and increasing in the north and east, may have led to the range-to-range differences evident across Colorado. Deglaciation was nearly complete in all four ranges by 15-13 ka. While some proxy records indicate a later Younger Dryas-age cooling in the Colorado mountains, there is not clear moraine evidence of glacier readvance at that time.
PE
Deglaciación de las Montañas Rocosas de Colorado después del Último Máximo Glaciar
PA
RESUMEN. La disponibilidad de casi 180 edades de exposición cosmogénica obtenidas en bloques morrénicos y en superficies rocosas pulidas hace posible establecer la temporalidad y carácter del Último Máximo Glaciar local (UMGL) y la subsecuente deglaciación en las Montañas Rocosas de Colorado. Una revisión de las cronologías glaciares y de los resultados de la modelización numérica indica que aunque los glaciares de Colorado respondieron de forma sincrónica, las diferencias en la temporalidad y magnitud del retroceso glaciar después del UMGL sugieren que diversos factores regionales espacialmente variables, posiblemente relacionados con la precipitación, jugaron un papel en el comportamiento de los glaciares junto con factores hemisféricos o globales más uniformes
Please, cite this article as: Leonard, E.M., Laabs, B.J.C., Schweinsberg, A.D., Russell, C.M., Briner, J.P., Young, N. 2017 Deglaciation of the Colorado Rocky Mountains following the Last Glacial Maximum. Cuadernos de Investigación Geográfica 43, http://doi.org/10.18172/cig.3234.
Leonard et al.
E-P RIN T
VE RS IO
N
espacialmente. Los glaciares de las cinco cordilleras examinadas alcanzaron su mayor extensión antes de ~19.5 ka y abandonaron sus morrenas más externas entre ~23.5 y 19.5 ka. Las cronologías detalladas de la deglaciación están disponibles para los glaciares de cuatro de las cordilleras. En la Cordillera Sawatch y en las Montañas de Sangre de Cristo los glaciares estuvieron cerca de su máxima extensión durante el UMGL a 17-16 ka, antes de retroceder rápidamente. En las Montañas de San Juan y en la Front Range los glaciares pueden haber comenzado antes su recesión post-UMGL, aunque esta deglaciación temprana aparece representada por solo unas pocas edades en sustrato pulido que potencialmente contiene herencias cosmogénicas pre-UMGL. Con independencia del momento de inicio de la deglaciación, el ascenso de la línea de equilibrio asociado con la deglaciación ocurrió más tempranamente y fue significativamente mayor en las Montañas de San Juan que en cualquier otro lugar de Colorado. Esto sugiere que las Montañas de San Juan, que se localizan bien al suroeste de las otras cadenas, pueden haber experimentado un aumento de precipitación durante el UMGL, como ocurrió en áreas situadas más al sur y el oeste, mientras que las condiciones del UMGL pueden haber sido más secas en las cordilleras del norte y este de Colorado. Un desmoronamiento de este patrón después del UMGL, con descenso de la precipitación en el sur y el oeste y aumento en el norte y el este puede haber dado lugar a diferencias de una cordillera a otra en Colorado. La deglaciación fue casi completa en las cuatro cordilleras hacia 15-13 ka. Aunque algunos registros proxy indican un enfriamiento tardío al final del Younger Dryas no hay claras evidencias morrénicas de reavance glaciar en ese periodo. Key words: Last Glacial Maximum, Deglaciation, Colorado, Rocky Mountains, CRN surface-exposure dating. Palabras clave: Último Máximo Glaciar, Deglaciación, Colorado, Montañas Rocosas, datación de superficies de exposición cosmogénica. Received 2 February 2017
PR
Accepted 4 April 2017
TE
D.
*Corresponding author: Eric M. Leonard, Department of Geology, Colorado College, Colorado Springs, CO 80903, USA. E-mail address:
[email protected]
1. Introduction
RA
CC
EP
Timing and patterns of climate change during and following the Last Glacial Maximum (LGM) have been the subject of intensive study over the last several decades. Recent work has made use of new chronological methods, particularly cosmogenic-radionuclide (CRN) surface-exposure dating, to unravel glacial chronologies, and of numerical modeling to understand climatic forcings. Mid-latitude mountain glacier systems tend to be small and to have fairly short response times. Consequently, their response to climate is relatively easy to model and it is possible to utilize their histories to understand the character of climate changes to which they have responded. Similarities and differences in alpine glacier chronologies across a region may thus provide insight to the nature of climate forcing.
PA
PE
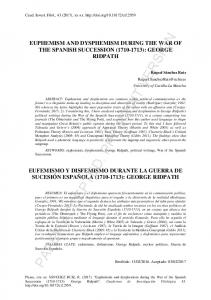
Recent studies have documented apparent synchronies and asynchronies in glacier behavior across the Rocky Mountain/Great Basin region of the western United States (Fig. 1) and have proposed explanations involving climate forcings at a variety of spatial scales, from global to subregional (Hostetler and Clark, 1997; Licciardi et al., 2001; 2004; Munroe et al., 2006; Licciardi and Pierce, 2008; Thackray, 2008; Refsnider et al., 2008; Laabs et al., 2009; Young et al., 2011; Shakun et al., 2015). In this study, we review and synthesize deglaciation chronologies and modeling studies from the southern U.S. Rocky Mountains, focusing on the state of Colorado (Fig. 1), where over the last decade a large number of CRN ages on LGM moraines and deglaciation sequences have become available, and several numerical modeling studies of deglaciation have been published. We limit our discussion to Colorado because in the adjacent portions of the Rocky Mountain crest in southern Wyoming and New Mexico there are no published LGM or deglaciation chronologies that utilize CRN methodology.
TE
D.
PR
E-P RIN T
VE RS IO
N
Deglaciation of the Colorado Rocky Mountains following the Last Glacial Maximum
EP
Figure 1. Digital terrain map of the western United States showing the state of Colorado (bold outline), adjacent states, and localities outside Colorado mentioned in text. Map adapted from Wikipedia Commons; author: Alexrk2.
RA
CC
The Colorado Rocky Mountains are the highest portion of the North American Cordillera between central Mexico and the Alaska/Yukon area, yet due to their relatively low latitude (37-41°N), they support only a few present-day niche glaciers (Graf, 1977; Krimmel, 2002; Fountain, 2006). In the late Pleistocene, however, valley glaciers and small icecap-outlet glacier complexes were common (Meierding and Birkeland, 1980; Dahms, 2004), and deposits from those glaciers have been the subject of study since the 19th century (see Richmond, 1965; Pierce, 2004; for overviews of the history of study of Pleistocene glaciation in the U.S. Rocky Mountains).
PE
1.1. CRN records of the Last Glacial Maximum and subsequent deglaciation
PA
The term “Last Glacial Maximum” is widely used but often not clearly defined. In a global context, the LGM refers to the interval ~26.5 to 19 ka (Clark et al., 2009) during which most mountain glaciers and ice sheets reached their maximum extents of the last Pleistocene glaciation, and eustatic sea level was at a minimum. Individual glaciers reached their maxima at different times during this interval or, in some cases, before or after this interval. In this paper, we refer to times of these individual glacier maxima as the “local Last Glacial Maximum” or “LLGM”. Taken literally, the LLGM refers to the absolute maximum stand of a glacier during the last Pleistocene glaciation, and probably lasted no more than a few decades at any particular glacier. More broadly, there was likely a
Leonard et al.
VE RS IO
N
period of up to several millennia when ice margins remained close to their maximum positions. In the Colorado Rocky Mountains, this interval is commonly expressed by a complex of latero-terminal moraine crests that may encompass several thousand years of moraine deposition, and may have been deposited during multiple brief maximum stands during a period of repeated fluctuations of the ice margin (Anderson et al., 2014). It is this latter, longer, interval of generally extensive ice that we refer to in this paper as the “LLGM” interval.
E-P RIN T
Moraine-boulder CRN surface-exposure ages are generally thought to indicate the timing of abandonment of a moraine (Briner et al., 2005; Benson et al.; 2005, Balco, 2011). Based on this interpretation, CRN ages on the outermost moraine crest of an LLGM complex should indicate the timing of initial retreat from the maximum ice stand, and also provide a minimum limiting age for maximum ice extent during the LLGM. CRN ages from the innermost crest of the moraine complex should indicate the time of final recession from the complex and, by implication, of the initiation of the main deglaciation interval (Schaefer et al., 2006; Putnam et al., 2013).
1.2. Late Pleistocene regional glacial chronology in the Rocky Mountains
CC
EP
TE
D.
PR
Since the pioneering work of Gosse et al. (1995) in the Wind River Range of Wyoming (Fig. 1), the number of CRN surface-exposure ages on late Pleistocene glacial features in the Rocky Mountains has increased greatly. As more ages have become available, several workers have noted apparent regional patterns in the timing of the LLGM and post-LLGM deglaciation (Licciardi et al., 2001, 2004; Licciardi and Pierce, 2008; Thackray, 2008). Licciardi and Pierce (2008) concluded that the maximum extent of ice during the last glaciation in the Yellowstone area (Fig. 1) lagged that in the Wind River Range by 4000-6000 years (~19 to 16.5 ka vs. ~24 to 22 ka). They pointed out, however, that the apparent difference in timing of the LLGM might be due to selective moraine preservation. Although Yellowstone glaciers may have been close to their maximum extent during the several thousand years preceding their ~19-16.5 ka maxima, the final, possibly relatively small, advances to that maximum position might have removed evidence of previous nearly-as-great ice extent. Studies in the Uinta Mountains of northern Utah (Fig. 1) have suggested that glaciers in that range were also at their maximum extents as many as 4000 years later than glaciers in both the Wind River Range and in the Colorado Rocky Mountains (Munroe et al., 2006; Refsnider et al., 2008). Laabs et al. (2009) found that the timing of the end of the LLGM varied across the Uinta Mountains, with earlier glacier retreat (approximately coincident with that in the Wind River Range and Colorado) in valleys on the northern and eastern sides of the range, but later retreat in southern and western valleys. Many of these studies suggested that ages documenting the timing of the LLGM and initiation of post-LLGM deglaciation in Colorado were uniformly old, similar to those reported for the Wind River Range. However, more recent work has suggested that timing of LLGM maximum stands in Colorado was quite variable, and that the initiation of post-LLGM deglaciation was later than previously thought and may have been approximately coincident with late deglaciation reported in the Yellowstone area and northern Utah (Young et al., 2011; Laabs et al., 2011).
RA
1.3. Possible causes of asynchronous timing of the LLGM in the Rocky Mountains
PA
PE
Observed asynchronies in the timing of the LLGM and the onset of post-LLGM deglaciation in the Rocky Mountain region have been attributed to several possible causes. These include both regional and more local climate controls, particularly changing LLGM and deglaciation precipitation patterns, as well as differences in glacier response times and hypsometry. Global and regional climate models have long suggested that at the time of the global LGM (usually defined in modeling experiments as ~21 ka) precipitation was reduced relative to present in the northwest United States and the northern Rocky Mountains, and increased relative to present in the southwest United States and the southern Rocky Mountains (Thompson et al., 1993; Bartlein et al., 1998; Thompson and Anderson, 2000; Braconnot et al., 2007). In many models this pattern is related to a southward displacement of the mean winter position of the Pacific jet stream across western North America during the LGM, so that the main winter storm track passed south of the California Sierra Nevada (Fig. 1) rather than to the north as it does today (Kutzbach and Wright, 1985; Kutzbach and Guetter, 1986; Kutzbach and
Deglaciation of the Colorado Rocky Mountains following the Last Glacial Maximum
E-P RIN T
VE RS IO
N
Ruddiman, 1993). Alternatively, Licciardi et al. (2004) attributed decreased moisture during the LGM in the Yellowstone region, and in the northern Rocky Mountains and northwest United States generally, to the development of Laurentide Ice Sheet-generated anticyclonic circulation, which would weaken westerly moisture flow in the region along the ice sheet’s southern margin (Hostetler and Clark, 1997; Bartlein et al., 1998; Hostetler and Bartlein, 1999). Both models suggest that glacier extent in the northern Rocky Mountains may have been limited by moisture starvation at the time of the global LGM. Rather than retreating synchronously at the end of the global LGM, local mountain glaciers could have advanced as winter precipitation patterns changed in response to a northward return of the mean position of the jet stream and the associated winter storm track and/or to a weakening of ice-sheet-induced anticyclonic circulation, returning more moist conditions to the northern Rocky Mountains. Several recent studies have disputed the notion that the mean position of the winter jet stream along the Pacific coast was displaced far to the south during the global LGM (Lyle et al., 2012; Oster et al., 2015). However, most available proxy data do indicate a pattern of reduced LGM precipitation in the north and enhanced precipitation in the south (Thompson et al. 1993; Oster et al., 2015). On a subregional scale, this picture is complicated by possible influence of local moisture sources, particularly Pleistocene Lake Bonneville (Fig. 1), which may have served as a significant moisture source for glaciers in the Wasatch Range and Uinta Mountains, and whose depth and surface-area variations were not necessarily coincident with global climate variations (Munroe et al., 2006; Laabs et al., 2009, 2011).
PR
While apparent regional patterns of asynchrony may require explanation in terms of regional climate patterns as discussed above, Young et al. (2011) argued that factors related to glacier dynamics might also have contributed to asynchronous glacier behavior. They proposed differences in valley gradient and glacier hypsometry as a possible causes of asynchrony, topics also discussed by Ward et al. (2009).
1.4. Timing of deglaciation in the Rocky Mountain region
1.5. Goals of this review
EP
TE
D.
Young at al. (2011) argued that whereas the timing of the LLGM was asynchronous across the western United States, with glaciers reaching their maximum stands at different times during and following the global LGM interval, the timing of the subsequent deglaciation was broadly synchronous, with major ice-margin recession taking place between ~15 and 13 ka. When CRN exposure ages are recalculated with more recent production rates and scaling (see section 2.1), the interval of rapid deglaciation proposed by Young et al. (2011) takes place between ~16 and 14 ka.
RA
CC
In this paper, we review recent developments in our understanding of late Pleistocene glacial chronology and climate in the Colorado Rocky Mountains, focusing on the interval of deglaciation following the LLGM. We address three sets of questions. First, when did the LLGM end and the deglaciation interval begin, and was that transition synchronous across the Colorado Rocky Mountains? Second, what was the chronology of deglaciation, what were the magnitudes of climate change that drove it, and were these changes synchronous and of similar magnitude across Colorado? Third, how does this record of deglaciation inform our understanding of climatic controls on late Pleistocene glaciation in the Rocky Mountains?
PA
PE
We base our discussion of chronology on nearly 180 CRN surface-exposure ages now available from LLGM or younger glacial features in the Colorado Rocky Mountains (Table 1). These ages were almost all produced since Pierce (2004) published the most recent comprehensive review of Rocky Mountain glaciation and glacier-based paleoclimatology. More than 100 of the ages are on LLGM moraine boulders, 55 on glacially polished bedrock upvalley from LLGM moraines, and another 20 on recessional-moraine boulders and upvalley erratic boulders (Table 1). The majority are 10 Be ages, with smaller numbers of 36Cl and 26Al ages. Our discussion of magnitudes of climate change during deglaciation is based on numerical paleoglacier modeling completed over the last decade (Ward et al., 2009; Dühnforth and Anderson, 2011; Schweinsberg et al., 2016; Leonard et al., 2017).
Leonard et al.
Table 1. Available CRN chronological data and model output constraining LLGM and deglaciation glacial chronology and climate Number of deglaciation CRN ages
LLG glacier modeling
Deglaciation glacier modeling
N
Number of LLGM CRN agesa
Sources
VE RS IO
Range and valley (location symbol in Figure 2)
PR
E-P RIN T
San Juan Mountains Animas River (A) 1 7 Yes Yes 7, 10 Continental Reservoir (B) 3 2 Rio Grande/Hogback Mt. (C) 12 2 Park Range Roaring Fork/Red Canyon (D) 9 1 Sawatch/East Elk Range Pine Creek (E) 12 2 Yes 4,11 Clear Creek (F) 5 1 Yes 11 Lake Creek (G) 16 7 Yes Yes 9, 10, 11, 12 Taylor River (H) 8 Yes 5 Texas Creek (I) 2 Yes 5 Sangre de Cristo Willow Creek (J) 11 11 Yes Yes 8 South Crestone Creek (K) 3 Yes 8 South Colony Creek (L) 7 8 Front Range Middle Boulder Creek (M) 4 18 Yes Yes 13 North Boulder Creek (N) 6 10 Yes Yes 6, 10 North St. Vrain Creek (O) 2 1 Chicago Lakes (P) 9 3 Butler Gulch (Q) 12 3 a All ages are on moraine boulders except for the Animas River valley age, which is a 10Be depth-profile age on an LLGM outwash terrace.
TE
D.
Sources: 1. Benson et al., 2004 – 2. Benson et al., 2005 – 3. Benson et al., 2007 – 4. Briner, 2009 – 5. Brugger, 2007 – 6. Dühnforth and Anderson, 2011 – 7. Guido et al., 2007 – 8. Leonard et al., 2017 – 9. Schweinsberg et al., 2016 – 10. Ward et al., 2011 – 11. Young et al., 2011 – 12. Unpublished data.
2. Methods
2.1. CRN Surface-Exposure Ages—Recalculation and Interpretation
PA
PE
RA
CC
EP
The purpose of this paper is not (with a very few exceptions) to present new data, but to review, synthesize, and interpret previously published data. The CRN ages we discuss were published in multiple reports over a span of more than a decade, and were calculated using different production rates and scaling schemes. In order to compare the ages to one another, to the available radiocarbon ages, and to global climate history, it was necessary to recalculate the exposure ages to a single up-todate production rate/scaling scheme. Following recent work in the Colorado Rocky Mountains (Schweinsberg et al., 2016; Leonard et al., 2017) we report all 10Be and 26Al exposure ages recalculated using the recent Lifton et al. (2015) calibration of 10Be and 26Al production at Promontory Point in northern Utah. The age, latitude, and altitude of the calibration site are similar to those of the Colorado sample sites, and thus provide an appropriate regional production rate for calculating Colorado 10Be and 26Al ages. Ages were computed using this calibration model and the timedependent "Lm" scaling model, as implemented in the original CRONUS-Earth online exposure-age calculator version 3.0 (Balco et al., 2008). For comparison, we also recalculated cosmogenic 10Be and 26Al ages using the updated, globally averaged production rate with Lm scaling (originally reported by Borchers et al., 2015) available in the same calculator. For all samples and sites reported here, the difference between cosmogenic ages computed with the globally averaged production rate and the calibrated production rate from the Promontory Point site is less than 0.5 kyr. The average percent difference among samples is 0.5%. Recalculation procedures and a complete western U.S. data set, including all of the published 10Be and 26Al ages we utilize in this paper, are included in Laabs et al. (in preparation). We report recalculated 10Be and 26Al ages in the text and figures, but also include some original published ages in italics to facilitate comparison to earlier publications. We have not
Deglaciation of the Colorado Rocky Mountains following the Last Glacial Maximum
been able to obtain all of the necessary sample data to recalculate most of the previously published Cl ages, and therefore we present the originally reported 36Cl ages. In seven instances where both 36 Cl and 10Be ages have been determined for a single boulder (Benson et al., 2004; Brugger, 2007) the difference between the original 36Cl age and the recalculated 10Be age varies greatly sample-to-sample, but on average the 36Cl ages are about 7.5% younger than the recalculated 10Be ages.
VE RS IO
N
36
2.1.1. Interpretation of moraine-boulder CRN surface-exposure ages
E-P RIN T
Interpretation of suites of CRN ages from moraine boulders is not always straightforward. Most workers agree that ages represent the time of moraine abandonment due to ice-margin recession. Considerable uncertainty exists regarding the interpretation of suites of samples with large age ranges, and it can be difficult to decide whether mean, maximum or minimum sample age best represents the timing of abandonment of the moraine. In this review, we report the mean of surface-exposure ages on individual features, eliminating ages considered to be outliers by the original authors.
PR
We report individual CRN surface-exposure age uncertainties as 1 external error, which includes both analytical uncertainty and production-model uncertainties. We report external error because of the wide range of sample latitudes and altitudes, and because we compare the 10Be and 26Al ages to 36Cl and radiocarbon ages, as well as to ice-core records. In estimating uncertainty for mean CRN exposure ages, we eliminate boulder ages considered as outliers by the original authors, and calculate the arithmetic mean and 1 standard deviation of the remaining ages. Following Shakun et al. (2015), we assume a 2.5% uncertainty related to scaling the production rate. The two uncertainties are summed in quadrature to produce an estimate of uncertainty of the reported mean age. To insure consistency across studies, for studies where authors have presented multiple interpretations of CRN ages depending on post-depositional erosion and shielding assumptions (e.g., Benson et al., 2004, 2005, 2007; Brugger, 2007), we utilize the values reported assuming zero-erosion/zero-shielding histories.
D.
2.1.2 Interpretation of polished-bedrock CRN surface-exposure ages
PE
RA
CC
EP
TE
Several studies in the Rocky Mountains have made use of upvalley polished-bedrock CRN ages to reconstruct deglaciation chronologies, premised on the assumption that these ages represent the time at which retreating ice margins uncovered the sample sites (Gosse et al., 1995; Guido et al., 2007; Ward et al. 2009; Dühnforth and Anderson, 2011; Young et al., 2011, Leonard et al., 2017). Most of these studies have found inherited pre-LLGM 10Be inventories in some samples of glacially scoured bedrock (Guido et al., 2007; Ward et al., 2009; Dühnforth and Anderson, 2011; Leonard et al., 2017). We exclude from our analysis any samples considered by the original authors to show compelling evidence of inheritance. Ward et al. (2009) noted that readvances during an overall period of recession may complicate interpretation of deglaciation history from bedrock CRN ages, as multiple periods of exposure and possible subglacial erosion during intervening periods of ice cover can influence the accumulated CRN inventory. Except where the original workers identified a possible ice readvance during overall recession (e.g., Ward et al., 2009), as a first estimate we assume that bedrock ages reflect the timing of a single uncovering event and use them to assess the general pattern of recession. We recognize that this approach may mask a more detailed pattern of multiple retreatreadvance cycles within the overall deglaciation period. We report individual bedrock CRN ages with 1 external uncertainty.
2.1.3 Dating the inception of deglaciation
PA
Ideally, dating the initiation of post-LLGM deglaciation would involve both precise dating of the time of ice abandonment of the innermost moraine of an LLGM complex and dating of ice marginal recession past some point a significant distance upvalley from the complex. This is not everywhere possible with the data set available for the Colorado Rocky Mountains, as many studies using CRN ages to constrain the timing of the LLGM have focused on sampling the outermost LLGM moraine, with the aim of dating the maximum stand—or more precisely determining when ice began
Leonard et al.
N
to retreat from its maximum position. In a few studies, multiple crests of the LLGM complex have been dated, providing a closer constraint on the initiation of post-LLGM recession.
VE RS IO
2.2 Paleoclimate from glacier modeling
E-P RIN T
Many studies in Colorado have attempted to derive paleoclimatic information from the location and maximum extent of LLGM glaciers. Some have used glacier equilibrium-line-altitude(ELA-) based approaches (Meierding, 1982; Leonard, 1984, 1989, 2007; Brugger and Goldstein, 1999; Brugger 2006, 2010; Refsnider et al., 2009). Others have employed a variety of numericalmodeling approaches (Brugger, 2006, 2010; Ward, 2009; Dühnforth and Anderson, 2011; Schweinsberg et al., 2016; Leonard et al., 2017). Modeling studies that have used patterns of ice recession to reconstruct the timing, magnitudes, and rates of change during the deglaciation interval (Ward, 2009; Dühnforth and Anderson, 2011; Schweinsberg et al., 2016; Leonard et al., 2017) are the focus of our discussion.
3. Sources of information on chronology and climate of the LLGM and subsequent deglaciation in the Colorado mountains
PE
RA
CC
EP
TE
D.
PR
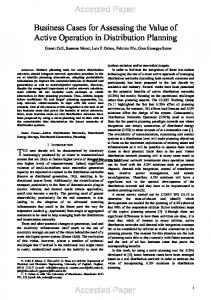
Late Pleistocene CRN surface-exposure ages are available from seventeen valleys in five mountain ranges spanning much of the glaciated area of Colorado (Fig. 2, Table 1). In fourteen valleys boulders have been dated on one or more LLGM moraine crests and in nine valleys upvalley polishedbedrock samples and/or recessional- or readvance-moraine boulders have been dated. Table 1 also indicates the valleys in which numerical glacier-modeling studies have been undertaken and provide information on climate during the LLGM and/or the subsequent deglaciation.
PA
Figure 2. Digital terrain map of the state of Colorado showing mountain ranges and study sites discussed in the text. A – Animas River; B – Continental Reservoir; C – Hogback Mountain; D – Roaring Fork/Red Canyon; E – Pine Creek; F – Clear Creek; G – Lake Creek; H – Taylor River; I – Texas Creek; J – Willow Creek; K – South Crestone Creek; L – South Colony Creek; M – Middle Boulder Creek; N – North Boulder Creek; O – North Fork St. Vrain River; P – Chicago Lakes; Q – Butler Gulch; R – Sky Pond.
Deglaciation of the Colorado Rocky Mountains following the Last Glacial Maximum
3.1. San Juan Mountains
VE RS IO
N
The San Juan Mountains of southwestern Colorado (Fig. 2) were extensively glaciated during the late Pleistocene, with about 5000 km2 of glacier ice at the LLGM (Atwood and Mather, 1932; Leonard, 1984). The rugged western portion of the range was occupied primarily by valley glacier systems, the largest of which was the ~90 km-long Animas River glacier on the southwest flank of the range (Atwood and Mather, 1932; Guido, 2007). The somewhat-lower-relief eastern and southeastern portions of the range were occupied by two large icecap-outlet-transection glacier complexes of about 1000-km2 extent each (Atwood and Mather, 1932; Leonard, 1984).
E-P RIN T
Guido et al. (2007) developed a detailed 10Be deglaciation chronology for the Animas River glacier (Fig 2, site A), dating the abandonment of a downvalley outwash terrace associated with the LLGM moraine and seven glacially polished bedrock outcrops along a transect up the length of the paleoglacier. Ward et al. (2009) used this chronology to constrain a 2-D numerical mass-balance and flow model (Kessler et al., 2006) of the glacier through the deglaciation interval to provide insights to ice dynamics and ELA change. Benson et al. (2005) reported fifteen 36Cl moraine-boulder surfaceexposure ages from the LLGM outlet glaciers at Continental Reservoir and Hogback Mountain on the east side of the range (Fig. 2, sites B and C).
3.2. Park Range
D.
PR
The Park Range was the northwesternmost region of extensive LLGM glaciation in Colorado (Fig. 2). Its low-relief southern portion was occupied at the LLGM by a small ice cap that straddled the Continental Divide (Atwood, 1937; Madole 1980). Farther north, with higher relief, valley glaciers (typically 10-15 km in length) descended both flanks of the range. Benson (2004) obtained CRN surface-exposure ages from six boulders on the LLGM moraine complex (36Cl ages on all six, 10Be ages on three) of the Roaring Fork/Red Canyon valley glacier on the east side of the range (Fig.2, site D). No upvalley CRN ages are available in this valley or elsewhere in the range, although radiocarbon dating of basal lacustrine sediment provides a minimum age for deglaciation of the small ice cap along the range crest about 20 km south of Roaring Fork/Red Canyon valleys (Madole, 1980).
TE
3.3. Sawatch Range and Eastern Elk Mountains
PA
PE
RA
CC
EP
The Sawatch Range and the Elk Mountains encompass a large region of high, rugged terrain in the central portion of Colorado (Fig. 2). LLGM valley glaciers, up to 30-35 km long, descended most valleys in both ranges (Brugger, 2010). In the Sawatch Range there is evidence of cross-range ice flow in many passes traversing the Continental Divide, and Ruleman (2016) has suggested that an ice cap covered the central portions of the range. Recent studies have used CRN surface-exposure ages to develop LLGM and deglaciation chronologies for three adjacent valleys along the eastern flank of the range (Briner, 2009; Young et al., 2011; Schweinsberg et al., 2016). In Pine Creek valley (Fig. 2, site E) twelve boulders and pebbles from the main LLGM moraine crest and two upvalley polishedbedrock surfaces have been dated using 10Be (Briner, 2009; Young et al., 2011), and in Clear Creek valley (Fig. 2, site F) five moraine boulders and one upvalley polished-bedrock surface have been dated (Young et al., 2011). In Lake Creek valley (Fig. 2, site G) Schweinsberg et al. (2016) reported fourteen new 10Be boulder surface-exposure ages on the two outermost LLGM moraines, expanding on an earlier data set consisting of two 10Be ages (Ward et al., 2009—from Schildgen, 2000) on those features. Young et al. (2011) also reported three polished-bedrock 10Be ages along an upvalley transect spanning the lower 25 km of the 33 km-long glaciated section of the Lake Creek valley. In this paper, we include four additional unpublished 10Be polished-bedrock exposure ages from the uppermost reaches of the valley. Schweinsberg et al. (2016) used the moraine and polished-bedrock chronology developed by Young et al. (2011) to constrain a 2-D numerical energy/mass balance and flow model (Plummer and Phillips, 2003) of the Lake Creek glacier at the LLGM and during deglaciation, providing insights into LLGM and post-LLGM deglaciation climate. On the west side of the Sawatch Range, in the area where it merges into the Elk Mountains farther west, Brugger (2007) dated LLGM moraine complexes in the Taylor River (five 10Be ages on
Leonard et al.
VE RS IO
N
moraine boulders; 36Cl ages on three of the same boulders) and Texas Creek (two 10Be ages) drainages (Fig. 2, sites H and I, respectively). The Taylor River glacier was the main outlet glacier of a small (~215 km2) upland icefield, while Texas Creek glacier was an independent valley glacier. Brugger (2006, 2010) used a 2-D degree-day model to infer LLGM climate in the western Sawatch Range and southern Elk Mountains, but did not attempt to model deglaciation.
3.4 Sangre de Cristo Mountains
E-P RIN T
The Sangre de Cristo Mountains are the southeasternmost high-alpine range in Colorado (Fig. 2). During the LLGM most drainages in the range hosted small valley glaciers, typically 5-10 km long. There was little, if any, cross-divide ice flow and no icecaps developed in the range (Refsnider et al., 2011). Leonard et al. (2017) dated a total of 21 moraine boulders in three valleys using 10Be surfaceexposure dating: Willow and South Crestone Creek valleys on the west side of the range (Fig. 2, sites J and K, respectively) and South Colony Creek valley on the east (Fig. 2, site L). Sampling was concentrated in the Willow Creek drainage, where multiple LLGM moraine crests were dated. Leonard et al. (2017) also reported eleven upvalley polished-bedrock 10Be ages which they used to reconstruct the post-LLGM deglaciation of the Willow Creek valley, and employed a 2-D linked energy/mass balance and flow model (Plummer and Phillips, 2003) to investigate climate conditions associated with LLGM glaciation and post-LLGM deglaciation of the Willow Creek valley. They used the same model to investigate LLGM conditions at South Crestone Creek glacier. Brugger et al. (2009) used a 2-D degree-day model to investigate LLGM climate in the Blanca Massif, about 40 km south of Willow Creek in the Sangre de Cristo Mountains.
PR
3.5. Front Range
D.
The Front Range, the northeasternmost Colorado range (Fig. 2), has long been the subject of paleoglacier investigations (Ray 1940; Richmond, 1960; Madole, 1969; Benedict, 1973). During the late Pleistocene a transection-glacier complex formed in northern part of the range (Madole et al., 1998), but farther south (including the areas discussed in this section) glaciation was limited to independent valley glaciers, most with lengths of 12-20 km (Madole et al., 1998).
CC
EP
TE
In Middle Boulder Creek valley (Fig. 2, site M) four LLGM moraine-boulder surfaceexposure ages are available including one 10Be (Ward et al., 2009), one 26Al (Schildgen, 2000), and two 36Cl ages (Benson et al., 2005). Ward et al. (2009) reported eighteen 10Be ages from upvalley polished bedrock in the drainage. They used these ages and a radiocarbon age from basal sediment in a tarn lake high in the drainage (Davis et al., 1992), to reconstruct a detailed deglaciation chronology, and employed a 2-D mass-balance and flow model (Kessler et al., 2006) to investigate patterns of post-LLGM deglaciation and associated ELA change.
Be and 36Cl ages are available for a single boulder on the LLGM moraine of the North St. Vrain glacier, on the eastern flank of the Front Range about 10 km north of North Boulder Creek (Fig 2, site O—Benson et al., 2004). Farther south in the Front Range, Benson (2007) reported nine 10Be boulder ages from post-LLGM moraines in the Chicago Lakes basin (Fig. 2, site P) and twelve from Butler Gulch (Fig. 2, site Q). In both of these areas no ages are available for the LLGM ice limits, which are many kilometers downvalley from the dated moraines.
PA
PE
10
RA
In North Boulder Creek valley (Fig. 2 site N), Dühnforth and Anderson (2011) undertook a similar geochronologic and modeling study. They obtained five LLGM moraine-boulder 10Be ages and ten upvalley polished-bedrock 10Be ages, and also applied the Kessler et al. (2006) 2-D mass balance and flow model to investigate LLGM glaciation and post-LLGM deglaciation.
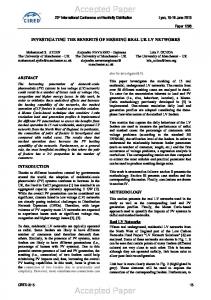
4. Chronology of the LLGM and the initiation of deglaciation in Colorado Figure 3 plots all currently available LLGM CRN surface-exposure ages from the Colorado ranges discussed in the previous section. Moraine-boulder ages are indicated by filled circles; black for recalculated 10Be and 26Al ages; blue for originally reported 36Cl ages. In general, the ages are
Deglaciation of the Colorado Rocky Mountains following the Last Glacial Maximum
RA
CC
EP
TE
D.
PR
E-P RIN T
VE RS IO
N
plotted as the mean age of all samples from an individual moraine, excluding samples identified by the original workers as outliers. Plotted uncertainty ranges were determined as described in section 2.1.1. We note that three moraines were plotted differently. In Pine Creek valley in the Sawatch Range (E in Figs. 2 and 3) Briner (2009) found two clusters of 10Be ages on the main LLGM lateral moraine, which he interpreted to represent the timing of ice abandonment following two periods of LLGM moraine occupation of similar extent. The two populations are plotted separately in Figure 3. Similarly, the outermost LLGM moraine at Willow Creek in the Sangre de Cristo Mountains (Figs. 2 and 3, site J) contains two statistically and spatially distinct sets of 10Be boulder exposure ages, three ages are older and located on the distal portion of the moraine, the remaining six ages are younger and located on the proximal portion of the moraine (Leonard et al., 2017). The two groups of ages are plotted separately in Figure 3. Finally, 10Be and 36Cl ages are available for only a single boulder on the LLGM moraine at North St. Vrain Creek in the Front Range (Figs. 2 and 3, site O) and are plotted separately, with error bars representing 1 the external uncertainties. Additionally, a 10Be depthprofile age on glacial outwash in the Animas River valley in the San Juan Mountains, believed to date the initial post-LLGM recession of the glacier upvalley (Guido et al., 2007), is plotted with an open black circle in Figure 3 (site A).
PA
PE
Figure 3. LLGM moraine-boulder 10Be (black circles) and 36Cl (blue circles) ages, plotted by mountain range and valley. One 26Al moraine-boulder age is included with the 10Be ages at Middle Boulder Creek (site M). Open black circle is an LLGM outwash-terrace 10Be profile age (Guido et al., 2007). Red diamonds indicate 10Be surface-exposure ages on the most downvalley dated polished-bedrock outcrop(s) in each valley. Source studies are listed in Table 1, and localities are keyed to letters in Figure 2. Exposure ages considered outliers by the original authors are not plotted. Plotted ages for moraine boulders are moraine means ± uncertainty calculated as discussed in text section 2.1.1. Plotted bedrock-exposure ages are individual sample values ±1 external uncertainty. 10Be and 26Al ages have been recalculated using the Promontory Point Lm production model. 36Cl ages are those reported by original authors, using production models that likely yield ages that are young compared to the recalculated 10Be and 26Al ages. Where 10Be/26Al and 36Cl ages are both from a single feature, they are plotted one above the other along a single vertical line (e.g., No. St. Vrain, site O).
Leonard et al.
VE RS IO
N
The first upvalley polished bedrock ages (all 10Be) from all valleys in which those are available are also plotted in Figure 3, with red diamonds. Ages identified by the original authors as including inheritance are not included. In both Pine Creek and Willow Creek valleys (Figs. 2 and 3, sites E and J) two closely spaced samples have been dated from the first upvalley sites, and both are shown in Figure 3. Individual bedrock ages are plotted with 1 external uncertainty. Polished– bedrock and recessional-moraine ages from farther upvalley are not reported in Figure 3, but are included in subsequent figures. Figure 3 indicates that LLGM moraines were deposited and subsequently abandoned over a relatively long time interval throughout Colorado. Clusters of moraine-boulder CRN ages indicate that in every range except the Sangre de Cristo Mountains ice retreated from an early set of moraines sometime between about 23 ka and 20 ka. In the Sangre de Cristo Mountains recession from the oldest LLGM moraines began shortly after 20 ka.
PR
E-P RIN T
Timing of the final abandonment of the LLGM moraine complex and the initiation of the main post-LLGM glaciation is well constrained in only a few valleys. In Pine Creek valley in the Sawatch Range (Figs. 2 and 3, site E), the youngest cluster of moraine CRN ages (16.9 ± 0.6 ka; n = 6) and the upvalley polished bedrock ages (16.7 ± 0.8 and 16.5 ± 0.7 ka) closely bracket the timing of morainecomplex abandonment and initial ice recession that resulted in the loss of nearly one fourth of LLGM glacier length (Briner, 2009, Young et al., 2011). Similarly, moraine ages of 16.3 ± 0.5 ka (n=6) and 16.3 ± 0.8 ka (n=2) and upvalley polished bedrock ages of 16.4 ± 0.8 and 17.3 ± 1.2 ka closely constrain the timing of initiation of post-LLGM deglaciation in Willow Creek in the Sangre de Cristo Mountains (Figures 2 and 3, site J; Leonard et al., 2017). In other valleys in these two ranges where moraine ages and/or upvalley bedrock ages are available, the ages do not so closely bracket the initiation of deglaciation, but are consistent with initial retreat from innermost moraines of the LLGM complex occurring ~17 to ~16 ka.
RA
CC
EP
TE
D.
By contrast, upvalley polished-bedrock ages from both the Animas River glacier in the San Juan Mountains (Figures 2 and 3, site A) and Middle Boulder Creek glacier in the Front Range (Figures 2 and 3, site M) suggest that abandonment of the LLGM complex and subsequent deglaciation may have begun earlier, between ~21 and 19 ka (Guido et al., 2007; Ward et al., 2009). It is important to note, however, that the inference of early deglaciation of the Animas River valley is based on a single bedrock age, which could be too old if it contains an inherited pre-LLGM 10Be inventory due to limited erosion. Bedrock ages farther upvalley (see section 5.2 below) would be consistent with a model involving later rapid post-17 ka deglaciation. In Middle Boulder Creek valley, three CRN ages from bedrock farther upvalley from the age shown in Figure 3 indicate that significant deglaciation had occurred by 18-17 ka, reducing the possibility that inheritance is biasing the deglaciation chronology there. Other 10Be ages, on both moraine boulders and polished bedrock in the San Juan Mountains and the Front Range do not closely constrain the timing of the initiation of deglaciation. 36Cl ages from LLGM moraines at Hogback Mountains on the eastern side of the San Juan Mountains (Fig. 3, site C) suggest that post-LLGM recession may have begun there as late as 17.5 ka (Benson et al., 2005). Those ages are not, however, recalculated with more recent production rates, and are likely too young compared to the recalculated 10Be ages.
5. Deglaciation chronology and climate
PA
PE
In five of the valleys discussed above, Animas River valley in the San Juan Mountains, Lake Creek valley in the Sawatch Range, Willow Creek valley in the Sangre de Cristo Mountains, and Middle and North Boulder Creek valleys in the Front Range, deglaciation chronologies have been developed based on CRN surface-exposure ages of multiple polished-bedrock surfaces, recessionalmoraine boulders, and upvalley erratics (Guido, 2007; Ward et al., 2009; Dühnforth and Anderson, 2011, Young et al., 2011, Leonard et al., 2017). While some samples in at least four of the five valleys show evidence of inheritance in the 10Be inventory, the use of multiple samples generally allows identification of problematic samples and their elimination in reconstructing chronologies. In addition, in all five valleys, numerical glacier models have been used to assess deglaciation dynamics and, at least indirectly, changing climate during the deglaciation interval (Ward et al., 2009; Dühnforth and Anderson, 2011, Schweinsberg et al., 2016; Leonard et al., 2017).
PE
RA
CC
EP
TE
D.
PR
E-P RIN T
VE RS IO
N
Deglaciation of the Colorado Rocky Mountains following the Last Glacial Maximum
PA
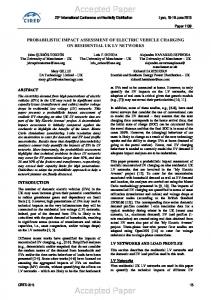
Figure 4. Moraine and upvalley polished-bedrock 10Be ages from all valleys in which upvalley CRN ages are available. Ages are plotted by normalized glacier length at the time the site was inferred to have been exposed during post-LLGM deglaciation. Source studies are listed in Table 1. Ages that were considered outliers by the original authors are not plotted. Panel A includes all data statewide, using the same color and symbol coding as panels B through E. Panel B plots ages from Animas River valley in the San Juan Mountains. Panel C plots ages from three valleys in the Sawatch Range. Panel D plots ages from Willow Creek valley in the Sangre de Cristo Mountains. Panel E plots ages from four valleys the Front Range, and includes a basal lacustrine 14C age from the uppermost portion of Middle Boulder Creek valley.
Leonard et al.
5.1. Chronology and magnitude of glacier margin recession through the deglaciation interval
VE RS IO
N
LLGM moraine-boulder CRN ages and upvalley polished-bedrock and erratic-boulder CRN ages are plotted in Figure 4 for all valleys in which upvalley ages are available. Ages are plotted by normalized horizontal position in the valley [=distance from cirque headwall to sample site/distance from cirque headwall to LLGM terminus; following Young et al., 2011. All of the distances were remeasured in this study to insure methodological consistency]. Panel A in figure 4 includes all available ages, panels B, C, D, and E show ages from individual ranges—San Juan, Sawatch, Sangre de Cristo, and the Front Range respectively. Panels A and E include a basal lacustrine radiocarbon age (12.7 ± 0.8 cal yr BP) from Lake Dorothy at the head of the Middle Boulder Creek valley in the Front Range (Davis et al., 1992) that is a minimum limiting age of nearly complete deglaciation of the valley. CRN samples identified by the original workers as affected by inheritance are not included in the figure, nor are 36Cl moraine-boulder ages.
EP
TE
D.
PR
E-P RIN T
Deglaciation ages span a broad time interval, with downvalley ages placing the initiation of significant recession between ~20 ka and ~16ka, and deglaciation essentially completed in nearly all valleys by ~15-13 ka (Fig. 4). The bottom panels in Figure 4 indicate that there were, however, significant range-to-range difference in the timing of deglaciation and the duration of the deglaciation interval. In the Animas River valley of the San Juan Mountains (Fig. 4B) and in Middle Boulder Creek valley in the Front Range (Fig. 4E), deglaciation appears to have initiated as early as ~20 ka (Guido et al., 2007; Ward et al., 2009) although, as is discussed above, it is possible that the early bedrock exposure ages in these valleys reflect 10Be inheritance, rather than early deglaciation. Bedrock CRN ages in the Animas River valley suggest that deglaciation of the San Juan Mountains progressed at an approximately constant rate (Guido et al., 2007; Ward et al., 2009) with nearly complete deglaciation by ~14-13 ka. The Front Range record (Fig. 4E) is more complex. In the Middle Boulder Creek drainage (Fig. 4E, open symbols), two tributary valleys –referred to as the “main” and “south” valleys by Ward et al. (2009)–appear to have retreated asynchronously. Following apparent early deglaciation of the lower portion of the main valley (Fig. 4E, open circles), the southern tributary (Fig. 4E, open diamonds) was largely deglaciated by 18-17 ka, whereas the upper main valley was not deglaciated until after ~15 ka. Ward et al. (2009) attributed this difference to valley hypsometry. Based on CRN ages in the two valleys and numerical glacier modeling, Ward et al. (2009) concluded that after an initial post-LLGM period of ice recession, a standstill or limited readvance of ice took place between ~17 and ~15 ka (original published age range was ~16 to ~14 ka), followed by a rapid final phase of deglaciation. Bedrock CRN ages and a basal lacustrine radiocarbon age (Fig. 4E, open triangle) from the uppermost portion of the main valley (Davis et al., 1992), indicate that deglaciation there was nearly completed by ~14.5-13 ka. In North Boulder Creek valley (Fig. 4E, closed circles) the early pattern of deglaciation is not well constrained, as bedrock outcrops are limited to the upper portion of the valley, where all ages are 15.5 ka or younger. Deglaciation there appears to have been nearly completed by ~13 ka.
PE
RA
CC
In contrast to the valleys in the San Juan Mountains and Front Range, major deglaciation in the Sawatch Range (Fig. 4C) and Sangre de Cristo (Fig. 4D) valleys appears not to have initiated until ~17-16 ka (Young et al., 2011, Leonard et al., 2017). This was followed in both ranges by an interval of rapid ice recession that resulted in nearly complete deglaciation by ~15-14 ka. In the Lake Creek valley of the Sawatch Range there is an age reversal between the younger two valley-bottom CRN exposure ages and the four cirque ages farther upvalley. As a result, there are two possible interpretations for the timing of nearly complete deglaciation there: (1) as early as ~15 ka or (2) ~14 ka or later. These two interpretations lead to different conclusions about rates of ice-marginal retreat, and of ELA and climate change, as will be discussed section 5.2 below.
PA
The five valleys just described were largely ice-free by ~15-13 ka with no clear evidence of glacier readvance during the Younger Dryas interval (~12.8 - 11.5 ka). In the uppermost portion of Butler Gulch in the Front Range (Fig. 2, site Q; Fig 4E), eight of twelve moraine boulders yielded a cluster of 10Be exposure ages (Benson et al., 2007) with a recalculated mean age of 12.5 ± 0.6 ka. The four other ages, however, were significantly younger outliers, with a range of recalculated 10Be ages from 8.7±0.4 to 6.1 ± 0.4 ka, suggesting caution in the interpretation of this moraine as a Younger Dryas feature. The sedimentary record from proglacial Sky Pond in the northern Front Range (Fig. 2, Site R; Menounos and Reasoner, 1997), and several pollen studies (Reasoner and Jordy, 2000;
Deglaciation of the Colorado Rocky Mountains following the Last Glacial Maximum
5.2. ELA and climate change during deglaciation
VE RS IO
N
Jimenez-Moreno et al., 2011; Briles et al., 2012) do suggest Younger Dryas cooling in the Colorado Rocky Mountains, as does a study of playa-lacustrine sediment (Yuan et al., 2013) in the San Luis Valley of southern Colorado (Fig. 2). Any ELA lowering associated with Younger Dryas does not, however, appear to have been sufficient to have caused significant glacier reformation in the five valleys discussed in detail here.
E-P RIN T
In all five valleys where CRN-dated deglaciation sequences are available, numerical models of deglaciation have also been developed, constrained by the chronologies. Modeling has been based on two different coupled 2-D mass-balance and ice-flow models. The Animas River, Middle Boulder Creek, and North Boulder Creek paleoglaciers (Ward et al., 2009; Dühnforth and Anderson, 2011) were studied with modified versions of the Kessler et al. (2006) model that calculates distributed glacier mass balance from either an assumed mass balance vs. altitude relationship (Ward et al., 2009) or a degree-day model (Dühnforth and Anderson, 2011). Work on the Lake Creek (Schweinsberg et al., 2016; unpublished data) and Willow Creek (Leonard et al., 2017) paleoglaciers utilized the model of Plummer and Phillips (2003) that determines mass balance based on distributed monthly energy and accumulation/ablation calculations. The flow components of the two models differ primarily in their treatment of basal sliding. Model output in both cases includes equilibrium-line altitude for glaciers in mass-balance equilibrium at a given extent, and in some instances, has been inverted to provide estimates of temperature and/or precipitation changes.
EP
TE
D.
PR
Figure 5 plots the post-LLGM ELA rise against time in the five valleys described above. We derive the ELA verses time data plots for the Animas River and Middle Boulder Creek glaciers from Ward et al. (2009, Figs. 10 and 13). Values for North Boulder Creek glacier are from Dühnforth and Anderson (2011), for Lake Creek glacier from Schweinsberg et al. (2016) and subsequent unpublished work, and for Willow Creek glacier from Leonard et al. (2017). Most striking in Figure 5 is that the ELA evolution of the Animas River glacier (blue circles) in the San Juan Mountains is quite different from that of the four other glaciers. The ELA of the Animas River glacier appears to have risen to about 500 m above its LLGM position by 19-18 ka, although the timing of this initial rise is uncertain due to the possibility of 10Be inheritance. Farther upvalley, however, three bedrock exposure ages at different sites indicate that ELA had risen a total of 660-820 m by ~16 ka, and inheritance is less of a potential problem with these multiple age determinations. The ELA continued to rise, at a perhaps lower rate, to a total of ~900 m post-LLGM rise by 14-13 ka, when the drainage was almost completely deglaciated (Guido et al., 2007). It is not known how much, if any, post 14-13 ka ELA rise occurred. The initial 500 m rise in post-LLGM ELA was accompanied by a rather small magnitude of terminal recession (Fig. 4B), probably reflecting paleoglacier hypsometry.
PE
RA
CC
In Middle Boulder Creek valley, the initial post-LLGM ELA rise may have been synchronous with that in the San Juan Mountains, but progressed more slowly (Fig 5, purple circles). Ward et al. (2009) present two interpretations of Middle Boulder Creek valley ELA history, both of which are shown in Figure 5 (purple circles). By ~17 ka ELA had risen by 150-220 m, but the ELA did not continue to rise and may have dropped back to about 150 m above the LLGM ELA during a possible readvance between 17 and 15 ka (original ages 16 and 14 ka). The ELA rose sharply during the subsequent final stage of deglaciation, but the amount and timing of the rise is difficult to constrain. The initiation of ELA rise in North Boulder Creek valley is also not well constrained. Dühnforth and Anderson (2011) present two slightly different ELA histories for that valley based on two different modeling approaches, both shown in Figure 5 (purple diamonds). ELA of the North Boulder paleoglacier had risen by 250-350 m above its LLGM position by ~15 ka and to 400-450 m above the LLGM position by ~13 ka, with another ~300 m occurring after ~13 ka.
PA
In the Willow Creek valley of the Sangre de Cristo Mountains, there was no significant rise in ELA between the LLGM and 16.3 ± 0.6 ka (Fig. 5, green circles). After 16.3 ka the ELA rose by about ~240 m by 14.2 ± 0.4 ka (Leonard et al., 2017). The amount and rate of post ~14 ka rise is not known, as Willow Creek valley was nearly completely deglaciated at that time.
E-P RIN T
VE RS IO
N
Leonard et al.
PR
Figure 5. CRN surface-exposure ages plotted against post-LLGM glacier equilibrium-line altitude (ELA) rise for the five valleys in which numerical models of deglaciation have been conducted. Symbols are color-coded by range as in figure 4. Multiple interpretations of ELA history for individual glaciers are discussed in text section 5.2. Error bars reflect 1 external uncertainty on 10Be ages used to calibrate the ELA models at Animas River, Lake Creek, and Willow Creek. ELA values for the Middle and North Boulder Creek glaciers are not tied to specific 10Be ages.
CC
EP
TE
D.
In Lake Creek valley in the Sawatch Range (Schweinsberg et al. 2016; unpublished data), ELA rise began with the abandonment of the main LLGM moraines at ~21.2-21.1 ka (Fig. 5, red symbols). However, by 15.8 ± 0.7 ka ELA had risen only ~85 m. The rate and magnitude of subsequent ELA rise depends on interpretation of the upvalley bedrock CRN exposure ages, and two interpretations are shown in Figure 5. If the youngest valley-bottom exposure age is used to constrain the timing of deglaciation (Fig. 5, closed red circle), total post-LLGM ELA rise in the valley would have been ~215 m by 14.3 ± 0.6 ka. This would have been followed by an additional rise of at least 130 m, although the timing of that subsequent rise is not known. Alternatively, if the older cirque ages are used to constrain the timing of deglaciation (Fig. 5, open red circle), total post-LLGM ELA rise in the valley would have been ~345 m by 14.9 ± 0.6 ka, indicating a rapid rise during the previous millennium. The magnitude of post 14.9 ± 0.6 ka rise is not constrained in this interpretation.
PA
PE
RA
Dühnforth and Anderson (2011), Schweinsberg et al. (2016), and Leonard et al. (2017) have used deglaciation model results to estimate the post-LLGM rise in temperature that would have been necessary to deglaciate North Boulder Creek, Lake Creek and Willow Creek valleys, respectively, assuming that deglaciation was driven by temperature increase alone and that no change occurred in precipitation through the deglaciation interval. Leonard et al. (2017) also considered the range of combined temperature and precipitation changes that could have driven deglaciation at Willow Creek. Assuming no change in precipitation, post-LLGM temperatures at North Boulder Creek would have risen by ~2.0° C by ~15 ka (original age ~14 ka) and by an additional ~1.0° C by ~13 ka (original age ~12 ka), with a final 1.5 - 2.8° C temperature increase necessary to reach modern conditions (Dühnforth and Anderson, 2011). Total LLGM-to-modern temperature increase would have been 4.55.8° C. At Willow Creek in the Sangre de Cristo Mountains, modeling indicates that, assuming no precipitation change, ~2.5 °C of temperature increase from LLGM conditions would have taken place by ~14.0 ka, and another ~2.5 °C to reach modern conditions--a total LLGM-to-modern temperature increase of about 5.0° C (Leonard et al., 2017). Modeling at neighboring South Crestone Creek indicates a similar LLGM-to-modern rise of ~5.1° C (Leonard et al., 2017). If significant precipitation increase or decrease occurred during deglaciation, the magnitudes of associated temperature changes
Deglaciation of the Colorado Rocky Mountains following the Last Glacial Maximum
VE RS IO
N
in these valleys would have been different (Leonard et al., 2017). At Lake Creek, the timing of temperature change during deglaciation depends on interpretation of the polished-bedrock exposureage sequence as discussed in section 5.1. Assuming no change in precipitation, total LLGM-to-present temperature rise would have been about 5.4 °C, of which about 0. 8 °C would have occurred by 15.8 ± 0.7 ka (Schweinsberg et al., 2016; unpublished data). Assuming that the valley-bottom ages are correct, another ~0.5 °C temperature increase would have occurred by 14.3 ± 0.6 ka, and subsequent temperature rise would have been approximately 4.1 °C. An alternative interpretation, supported by bedrock-exposure ages from the higher-altitude cirque floors, suggests that about 3.1° C post-LLGM temperature rise would have occurred by about 14.9±0.6 ka and an additional ~2.3° C to present day.
E-P RIN T
In summary, a significant post-LLGM ELA rise may have been well underway as early as 1918 ka in the San Juan Mountains, and by ~16 ka ELA had risen 660-820 m. A total documented ELA rise of about 900 m occurred by 14-13 ka. Any subsequent ELA rise cannot be documented. In the Front Range ELA rise may also have begun early, but the initial magnitude was much smaller, totaling only about 400 m by 14-13 ka. In the Sangre de Cristo and Sawatch ranges, significant ELA rise does not appear to have taken place until about 16 ka, with a total documented rise of only 200-350 m by 15-14 ka. As in the Front Range, subsequent ELA-rise history is not known.
PR
Ward et al. (2009) did not attempt to quantify the temperature changes that would have been associated with post-LLGM ELA rise of the Animas River glacier in the San Juan Mountains. Modeling in the other three ranges suggests that, assuming no changes in precipitation, deglaciation would have involved a ~4.5-6 ° C total post-LLGM temperature rise, but the timing and rates of inferred temperature change during the deglaciation interval differ somewhat range-to-range. It is worth noting that other approaches to assessing LLGM climate in the Colorado Mountains, including ELA-based approaches (Leonard, 1989, 2007; Brugger and Goldstein, 1999; Brugger, 2006; Refsnider et al., 2007) and some degree-day models (Brugger, 2007, 2010, Brugger et al., 2009), have indicated a greater total LGM-to-present temperature increase than do the coupled mass/energy balance and flow models discussed here, typically ~7° C or slightly more.
D.
6. Discussion
RA
CC
EP
TE
CRN surface-exposure ages indicate that in the five ranges discussed in this review, and at most individual glaciers studied in those ranges, maximum ice extent of the LLGM interval occurred before ~19.5 ka. Glaciers in the Sangre de Cristo Mountains appear to have retreated from their maximum extents somewhat later than glaciers in other ranges, although the timing of their preceding maximum stand there is not known. In both the Sangre de Cristo Mountains and the Sawatch Range there is evidence that glacier margins were close to their maximum LLGM stands as late as ~17-16 ka. By contrast, available evidence suggests that at least some glaciers in the San Juan Mountains and Front Range may have retreated significantly from their LLGM positions between ~21 and ~19 ka and by ~17-16 ka were considerably reduced from their LLGM extents. By ~16 ka, ELA in the San Juan Mountains had risen 660-820 m from its LLGM position, a much larger rise than has been documented by that time in the other ranges. Glacier retreat was underway in all five valleys by 17-16 ka, and appears to have been steady in all except Middle Boulder Creek valley (and possibly North Boulder Creek valley), where a standstill or limited readvance may have taken place between 17 ka and 15 ka, preceding a rapid final recession after 15 ka. Deglaciation in all valleys was nearly complete by 15-13 ka.
PA
PE
Building on work by Licciardi et al. (2001, 2004), Munroe et al. (2006), and Refsnider et al. (2008), Ward et al. (2009) suggested that regionally there may have been two periods of nearmaximum ice extent during the LLGM interval; a first ~23-21 ka (original ages ~21-20 ka), a second ~18-17ka (original ages ~17-16 ka). They suggested that in the northern Rocky Mountains and the Lake Bonneville basin, ice extent during the latter time interval was generally greater than its extent during the earlier interval, and thus is recorded by young outermost LLGM moraines in those areas. They proposed that the later phase was commonly less extensive than the earlier phase in areas farther south, which is why many of the outermost moraines preserved in these areas date from the earlier period. Our compilation of ages from the Colorado Rocky Mountains fits this model fairly well, with evidence of an early LLGM phase throughout the region and evidence of a second period of nearly as
Leonard et al.
VE RS IO
N
extensive ice several thousand years later in some ranges. With the possible exception of Willow Creek in the Sangre de Cristo Mountains, there is no valley yet studied in Colorado where there is compelling evidence that an ice readvance associated with the later period was extensive enough to remove all geomorphic evidence of any earlier LLGM ice extent.
E-P RIN T
Explanations for patterns of deglaciation in the Colorado Rocky Mountains may be sought in global, hemispheric (North Atlantic-related), and/or regional forcings. Young et al. (2011) concluded that the main recession phase in Colorado and throughout the western United States was coincident with the North Atlantic Bølling/Allerød warm interval (~14.7-12.7 ka). However, recalculation of exposure ages with more recent production models indicates that, although the final phase of deglaciation in Colorado, particularly in the Front Range, may have taken place during the Bølling/Allerød interval, deglaciation was underway across the state well before the onset of Bølling/Allerød warming (Fig. 6A and C). Shakun et al. (2015) suggested that deglaciation in the western United States was forced primarily by the post-LGM rise in atmospheric CO2 concentration that began ~18-17.5 ka (Schaefer at al., 2006; Shakun et al., 2012, 2015; Parrenin et al., 2013). This rise in CO2 corresponds more closely to the deglaciation interval in Colorado (Fig. 6A and B), although significant deglaciation may have begun somewhat earlier in the San Juan and Front ranges and slightly later in the Sawatch and Sangre de Cristo ranges.
TE
D.
PR
Possible significant retreats of the Animas River paleoglacier in the San Juan Mountains and the Middle Boulder Creek paleoglacier in the Front Range before ~19 ka are not explained by changes in CO2 concentration, which did not begin until ~18-17.5 ka (Schaefer at al., 2006; Shakun et al, 2012, 2015; Parrenin et al., 2013). Shakun et al. (2015) noted evidence of early (pre-18 ka) deglaciation in the mountains of western North America, which they attributed to insolation forcing. Early deglaciation may also have been affected by regional precipitation changes. The Ft. Stanton Cave speleothem record indicates that the main drying event in southern New Mexico (Fig. 1) took place between ~22.6 and ~20.0 ka (Asmerom et al., 2010). At Cave of the Bells in Arizona (Fig. 1), maximum winter precipitation occurred ~22 ka, followed by a gradual precipitation decrease (Wagner et al., 2010), although at this site and elsewhere in southeastern Arizona (Pigati et al., 2009) the main post-LGM drying occurred much later, ~15 ka. It should be remembered, however, that the inference of early (pre-19 ka) retreat in the Animas and Middle Boulder valleys is based largely on a single polished bedrock exposure age in each and we cannot eliminate the possibility that those ages reflect 10 Be inheritance rather than early deglaciation.
PA
PE
RA
CC
EP
Whatever the timing of the onset of post-LLGM deglaciation in the San Juan Mountains, multiple bedrock CRN surface-exposure ages, coupled with numerical modeling, indicate that the magnitude of post-LLGM ELA rise that occurred there by ~16 ka was much greater than that in other Colorado ranges (Fig 5). It seems likely that this difference reflects regional- or local-scale forcing, rather than hemispheric or global mechanisms, and may involve precipitation forcing as suggested by previous studies in the Rocky Mountain region (Licciardi et al., 2001, 2004; Munroe et al., 2006; Licciardi and Pierce, 2008; Thackray, 2008; Laabs et al., 2009). Both climate-model output and proxy records for the LGM compiled by Oster et al. (2015) show a northwest-southeast-trending boundary across the northern Great Basin (Fig. 1) between drier-than-modern condition to the north and east, and wetter-than-modern condition to the south and west, with the Colorado Rocky Mountains close to, but probably largely northeast of, the boundary. The San Juan Mountains, and especially their southwest flank, where the Animas River glacier was located, are the farthest southwest of the Colorado ranges. The Animas River glacier was 180-300 km west or southwest of other modeled glaciers discussed in this paper. It is possible that at the time of the LLGM, the Animas River glacier experienced significantly more precipitation relative to present than did glaciers further to the east and northeast, and thus had a more depressed ELA. The substantial rise in post-LLGM ELA in the southwestern San Juan Mountains may then reflect a combination of region-wide warming associated with post 18-17.5 ka atmospheric CO2 increase that affected all of the Colorado glaciers, and postLGM drying in the southern Great Basin region, which would have affected the western San Juan Mountains much more than other Colorado ranges.
CC
EP
TE
D.
PR
E-P RIN T
VE RS IO
N
Deglaciation of the Colorado Rocky Mountains following the Last Glacial Maximum
PE
RA
Figure 6. Comparison of the deglaciation record in the Colorado Rocky Mountains with global climate records—25-10 ka. (A) Normalized lengths of Colorado glaciers. See Figure 4 for color and symbol coding; (B) Atmospheric CO2 from West Antarctic Ice Sheet Divide Ice Core (WDC) – (Marcott et al., 2014); (C) 18O record from North Greenland Ice Core Project (NGRIP) core (Andersen et al., 2006; Rasmussen et al., 2006; Shakun et al., 2012). Blue shading indicates the Bølling/Allerød warm interval. Vertical dashed lines are at 20 and 15 ka.
7. Summary
PA
CRN surface-exposure ages are now available for LLGM moraines in five Colorado ranges, and detailed CRN-based deglaciation chronologies are available in four of these ranges. Moraineboulder ages on outermost LLGM moraines indicate that maximum ice extent during the last glaciation in Colorado was generally reached before ~19.5 ka. In the Sangre de Cristo and Sawatch ranges, there is evidence of a later period of nearly equivalent ice extent ~17-16 ka, with the main deglaciation occurring rapidly after that time. By contrast, in the San Juan and Front ranges significant deglaciation appears to have begun somewhat earlier, and in the Front Range deglaciation may have
Leonard et al.
VE RS IO
N
been interrupted by a standstill or limited readvance during the 17-15 ka interval. The start of overall deglaciation appears to be closely related in time to the post-LGM global rise in atmospheric CO2 concentration that began ~18 to 17.5 ka, but too early to correlate to Bølling/Allerød warming, suggesting that deglaciation in the Colorado Rocky Mountains was more likely a response to global greenhouse-gas forcing than to northern hemisphere/North Atlantic forcing. Valleys in all four ranges were almost completely ice free by ~15-13 ka. Evidence for a small Younger Dryas-age glacial readvance in the state remains equivocal.
E-P RIN T
By ~16 ka, the ELA had risen much more in the western San Juan Mountains than elsewhere in the state. This anomalous early ELA rise likely reflected regional- or local-scale forcing, and may have been related to a decrease in moisture availability as an LLGM pattern of higher-than-modern precipitation to the south and west in the Great Basin region and lower than-than-modern precipitation to the north and east began to break down, leading to a switch to more negative glacier mass balances in the western San Juan Mountains. In ranges farther to the east and north, which likely experienced drier conditions during the LLGM, a breakdown of this pattern would have had a much less pronounced effect on glacier mass balance.
Acknowledgements
We thank Joe Licciardi and Keith Brugger for their many insights concerning CRN chronology, glacier modeling, and paleoclimate. The Colorado College Geology Department Patricia J. Buster Fund provided support for one author (CR).
PR
References
D.
Andersen, K.K., Svensson, A., Johnsen, S.J., Rasmussen, S.O., Bigler, M., Röthlisberger, R., Ruth, U., SiggaardAndersen, M.L., Steffensen, J.P., Dahl-Jensen, D., Vinther, B.M., Clausen, H.B. 2006. The Greenland ice core chronology 2006, 15-42ka. Part 1: Constructing the time scale. Quaternary Science Reviews 25, 3246-3257. http://doi.org/10.1016/j.quascirev.2006.08.002. Anderson, L.S., Roe G.H., Anderson, R.S. 2014. The effects of interannual climate variability on the moraine record. Geology 42, 55-58. http://doi.org/10.1130/G34791.1.
TE
Asmerom, Y., Polyak, V. J., Burns, S. J. 2010. Variable winter moisture in the southwestern United States linked to rapid glacial climate shifts. Nature Geoscience 3, 114-117. http://doi.org/10.1038/NGEO754.
EP
Atwood Jr., W. W. 1937. Records of Pleistocene glaciers in the Medicine Bow and Park Ranges. Journal of Geology 45, 113-140. Atwood, W.W., Mather, K.F. 1932. Physiography and Quaternary geology of the San Juan Mountains, Colorado. U.S. Geological Survey Professional Paper 166.
CC
Balco, G. 2011. Contributions and unrealized potential contributions of cosmogenic-nuclide exposure dating to glacier chronology, 1990-2010. Quaternary Science Reviews 30, 3-27. http://doi.org/10.1016/j.quascirev.2010.11.003.
RA
Balco, G., Stone, J., Lifton, N. Dunai, T. 2008. A complete and easily accessible means of calculating surface exposure ages or erosion rates from 10Be and 26Al measurements. Quaternary Geochronology 3, 174195. http://doi.org/10.1016/j.quageo.2007.12.001.
PE
Bartlein, P.J., Anderson, K.H., Anderson, P.M., Edwards, M.E., Mock, C.J., Thompson, R.S., Webb, R.S., Webb, T. III, Whitlock, C. 1998. Paleoclimatic simulations for North America over the past 21,000 years: features of the simulated climate and comparisons with paleoenvironmental data. Quaternary Science Reviews 17, 549-585. http://doi.org/10.1016/SO277-3791(98)00012-2.
PA
Benedict, J.B. 1973. Chronology of cirque glaciation, Colorado Front Range. Quaternary Research 3, 584-599. Benson, L., Madole, R., Phillips, W., Landis, G., Thomas, T., Kubik, P. 2004. The probable importance of snow and sediment shielding on cosmogenic ages of north-central Colorado Pinedale and pre-Pinedale moraines. Quaternary Science Reviews 23, 193-206. http://doi.org/10.1016/j.quascirev.2003.07.002.
Deglaciation of the Colorado Rocky Mountains following the Last Glacial Maximum
N
Benson, L., Madole, R., Landis, G., Gosse, J. 2005. New data for Late Pleistocene Pinedale alpine glaciation from southwestern Colorado. Quaternary Science Reviews 24, 49-65. http://doi.org/10.1016/j.quascirev.2004.07.018.
VE RS IO
Benson, L., Madole, R., Kubik, P, McDonald, R. 2007. Surface-exposure ages of Front Range moraines that may have formed during the Younger Dryas, 8.2 cal ka, and Little Ice Age events. Quaternary Science Reviews 26, 1638-1649. http://doi.org/10.1016/j.quascirev.2007.02.015. Borchers, B., Marrero, S., Balco, G., Caffee, M., Goehring, B., Lifton, N., Nishiizumi, K., Phillips, F., Schaefer, J., Stone, J. 2016. Geological calibration of spallation production rates in the CRONUS-Earth project. Quaternary Geochronology, 31, 188-198. http://doi.org/10.1016/j.quageo.2015.01.009. Braconnot, P., Otto-Bliesner, B., Harrison, S., Joussaume, S, Peterchmitt, J.-Y., Abe-Ouchi, A., Crucifix, M. , Driesschaert, E., Fichefet, Th., Hewitt, C. D., Kageyama, M., Kitoh, A., Laîné, A., Loutre, M.-F., Marti, O., Merkel, U., Ramstein, G., Valdes, P., Weber, L. ,Yu, Y., Zhao, Y. 2007. Results of PMIP2 coupled simulations of the mid-Holocene and Last Glacial Maximum - Part 1: experiments and large-scale features. Climate of the Past 3, 261-277. http://www.clim-past net/3/261/2007.
E-P RIN T
Briles, C. E., Whitlock, C., Meltzer, D. J. 2012. Last glacial-interglacial environments in the southern Rocky Mountains, USA and implications for Younger Dryas-age human occupation. Quaternary Research 77, 96-103. http://doi.org/10.1016/yqres2011.10.002. Briner, J.P. 2009. Moraine pebbles and boulders yield indistinguishable 10Be ages: a case study from Colorado, USA: Quaternary Geochronology 4, 299-305. http://doi.org/10.1016/j.quageo.2009.02.010. Briner, J.P., Kaufman, D.S., Manley, W.F., Finkel, R.C., Caffee, M.W. 2005. Cosmogenic exposure dating of late Pleistocene moraine stabilization in Alaska. Geological Society of America Bulletin 117, 11081120. http://doi.org/10.1130/B25649.1.
PR
Brugger, K.A. 2006. Late Pleistocene climate inferred from the reconstruction of the Taylor River glacier complex, southern Sawatch Range, Colorado. Geomorphology 75, 318-329. http://doi.org/10.1016/j.geomorph.2005.07.020.
D.
Brugger, K.A. 2007. Cosmogenic 10Be and 36Cl ages from Late Pleistocene terminal moraine complexes in the Taylor River drainage basin, central Colorado, USA. Quaternary Science Reviews 26, 494-499. http://doi.org/10.1016/j.quascirev.2006.09.006.
TE
Brugger, K.A. 2010. Climate in the southern Sawatch Range and Elk Mountains, Colorado, USA, during the Last Glacial Maximum: inferences using a simple degree-day model. Arctic, Antarctic and Alpine Research 42, 164-178. http://doi.org/10.1657/1938-4246-42.2.164.
EP
Brugger, K.A., Goldstein, B.S., 1999. Paleoglacier reconstruction and late-Pleistocene equilibrium-line altitudes, southern Sawatch Range, Colorado. In: D.M. Mickelson, J.W. Attig (Eds.), Glacial Processes Past and Present. Geological Society of America Special Paper 337, 103-112. Brugger, K.A., Refsnider, K.A., Leonard, E.M. 2009. Late Pleistocene climate on the Blanca Massif, Sangre de Cristo Mountains, Colorado. Geological Society of America Abstracts with Programs 41, 640.
CC
Clark, P.U., Dyke, A.S., Shakun, J.D., Carlson, A.E., Clark, J., Wohlfarth, B., Mitrovica, J.X., Hostetler, S.W., McCabe, A.M. 2009. The Last Glacial Maximum. Science 325, 710-714. http://doi.org/10.1126/science.1172873.
RA
Dahms, D. E. 2004. Glacial limits in the middle and southern Rocky Mountains, USA, south of the Yellowstone Ice Cap. In: J. Ehlers, P.L. Gibbard (Eds.), Quaternary Glaciations—extent and chronology, part II, Developments in Quaternary Sciences 2. Elsevier, Amsterdam, pp. 275-288.
PE
Davis, P. T., Birkeland, P.W., Caine, N., Rodbell, D.T. 1992. New radiocarbon ages from cirques in Colorado Front Range. Geological Society of America Abstracts with Programs 24, 347. Dühnforth, M., Anderson, R. S. 2011. Reconstructing the glacial history of green lakes valley, North Boulder Creek, Colorado Front Range. Arctic, Antarctic, and Alpine Research, 43 (4), 527-542. http://doi.org/10.1657/1938-4246-43.4.527.
PA
Fountain, A.G. 2006. Glaciers online: Glaciers of the http://glaciers research.pdx.edu (last access 28/12/2016).
American
West.
Available
online
at:
Gosse, J. C., Klein, J., Evenson, E. B., Lawn, B., Middleton, R. 1995. Beryllium-10 dating of the duration and retreat of the last Pinedale glacial sequence. Science 268, 1329-1329. http://doi.org/10.1126/science268.5215.1329.
Leonard et al. Graf, W.L. 1977. The distribution of glaciers in the Rocky Mountains of the United States. Journal of Glaciology 18, 325-328.
VE RS IO
N
Guido, Z.G., Ward, D.J., Anderson, R.S. 2007. Pacing the post-Last Glacial Maximum demise of the Animas Valley glacier and the San Juan Mountain ice cap, Colorado. Geology 35, 739-742. http://doi.org/10.1130/G23596A.1. Hostetler, S.W., Clark, P.U., 1997. Climatic controls of western U.S. glaciers at the last glacial maximum. Quaternary Science Reviews 16, 505-511. http://doi.org/10.1016/S0277-3791(96)00116-3. Hostetler, S.W., Bartlein, P.J. 1999. Simulation of the potential responses of regional climate and surface processes in western North America to a canonical Heinrich event. In P.U. Clark, R.S. Webb, L.D. Keigwin (Eds.), Mechanisms of global climate change at millennial timescales, American Geophysical Union Geophysical Monograph 12, 313-327.
E-P RIN T
Jiménez-Moreno, G., Fawcett, P.J., Anderson, R.S. 2008. Millennial-and centennial-scale vegetation and climate changes during the late Pleistocene and Holocene from northern New Mexico (USA). Quaternary Science Reviews 27, 1442-1452. http://doi.org/10.1016/j.quascirev.2008.04.004. Jiménez-Moreno, G., Anderson, R. S., Atudorei, V., Toney, J. L. 2011. A high-resolution record of climate, vegetation, and fire in the mixed conifer forest of northern Colorado, USA. Geological Society of America Bulletin 123, 240-254. http://doi.org/10.1130/B30240.1. Kessler, M.A., Anderson, R.S., Stock, G. (2006), Modeling topographic and climatic control of east-west asymmetry in Sierra Nevada Glacier length during the Last Glacial Maximum. Journal of Geophysical Research, 111, F02002. http://doi.org/10.1029/2005JF000365. .
PR
Krimmel, R.M. 2002. Glaciers of the conterminous United States: Glaciers of the Western United States. U.S. Geological Survey Professional Paper 13856-J-2. In: R.S. Williams, J.G. Ferrigno (Eds.), Satellite image atlas of glaciers of the world: North America, U.S. Geological Survey Professional Paper 1386J, pp. J329-J381. Kutzbach, J.E., Guetter, P.J. 1986. The influence of changing orbital parameters and surface boundary conditions on climate simulations for the past 18,000 years. Journal of Atmospheric Sciences 43, 1726-1759.
D.
Kutzbach, J.E., Ruddiman, W.F. 1993, Model description, external forcing, and surface boundary conditions. In: H.E. Wright, Jr, J.E. Kutzbach, T. Webb III, W.F. Ruddiman, F.A. Street-Perrott, P.J. Bartlein (Eds.), Global Climates since the last glacial maximum. University of Minnesota Press, Minneapolis, pp. 1223.
TE
Kutzbach, J. E., Wright, H. E. 1985. Simulation of the climate of 18,000 years BP: results for the North American/North Atlantic/European sector and comparison with the geologic record of North America. Quaternary Science Reviews 4, 147-187.
EP
Laabs, B. J. C., Plummer, M. A., Mickelson, D. M. 2006. Climate during the Last Glacial Maximum in the Wasatch and southern Uinta Mountains inferred from glacier modeling. Geomorphology 75, 300-317. http://doi.org/10.1016/j.geomorph.2005.07.026.
CC
Laabs, B.J.C., Refsnider, K.A., Munroe, J.S., Mickelson, D.M., Applegate, P.M., Singer, B.S., and Caffee, M.W. 2009. Latest Pleistocene glacial chronology of the Uinta Mountains: support for moisture-driven asynchrony of the last deglaciation: Quaternary Science Reviews 28, 1171-1187. http://doi.org/10.1016/j.quascirev.2008.12.012.
RA
Laabs, B.J.C., Marchetti, D.W., Munroe, J.S., Refsnider, K.A., Gosse, J.C., Lips, E.W., Becker, R.A., Mickelson, D.D., Singer, B. S. 2011. Chronology of latest Pleistocene mountain glaciation in the western Wasatch Mountains, Utah, USA. Quaternary Research 76, 272-284. http://doi.org/10.1016/j.yqres.2011.06.016.
PA
PE
Laabs, B.J.C., Licciardi, J.M., Marchetti, D.W., Leonard, E.M., Munroe, J.S. (in preparation). Cosmogenic 10Be chronology of Pleistocene moraines in the western United States: a synthesis of glacial chronologies and assessment of updated production rates on inferences of paleoclimate. To be submitted to Quaternary Science Reviews, May 2017. Leonard, E.M. 1984. Late Pleistocene equilibrium-line altitudes and modern snow accumulation patterns, San Juan Mountains, Colorado, U.S.A. Arctic and Alpine Research 16, 65-76. Leonard, E.M. 1989. Climatic change in the Colorado Rocky Mountains: estimates based on modern climate at late Pleistocene equilibrium lines. Arctic and Alpine Research 21, 245-255.
Deglaciation of the Colorado Rocky Mountains following the Last Glacial Maximum
N
Leonard, E.M. 2007. Modeled patterns of Late Pleistocene glacier inception and growth in the Southern and Central Rocky Mountains, USA: sensitivity to climate change and paleoclimatic implications. Quaternary Science Reviews 26: 2152-2166. http://doi.org/10.1016/j.quascirev.2007.02.013.
VE RS IO
Leonard, E.M., Laabs, B.J.C., Kroner, R.K., Plummer, M.A., Brugger, K.A., Refsnider, K.A., Spiess, V.M., Caffee, M.W. 2017. Late Pleistocene glaciation and deglaciation in the Crestone Peaks area, Colorado Sangre de Cristo Range – chronology and paleoclimate. Quaternary Science Reviews 158, 127-144. http://doi.org/10.1016/jquascirev.2016.11.024. Licciardi, J.M., Pierce, K.L. 2008. Cosmogenic exposure-age chronologies of Pinedale and Bull Lake glaciations in greater Yellowstone and the Teton Range, USA: Quaternary Science Reviews 27, 814-831. http://doi.org/10.1016/j.quascirev.2007.12.005. Licciardi, J.M., Clark, P.U., Brook, E.J., Pierce, K.L., Kurz, M.D., Elmore, D., Sharma, P. 2001. Cosmogenic 3 He and 10Be chronologies of the late Pinedale northern Yellowstone ice cap, Montana, USA. Geology 29, 1095-1098.
E-P RIN T
Licciardi, J.M., Clark, P.U., Brook, E.J., Elmore, D., Sharma, P. 2004. Variable responses of western U.S. glaciers during the last deglaciation. Geology 32, 81-84. http://doi.org/10.1130/G19868.1. Lifton, N., Caffee, M., Finkel, R., Marrero, S., Nishiizumi, K., Phillips, F.M., Goehring, B., Gosse, J., Stone, J., Schaefer, J., Theriault, B., Jull, A.J.T., Fifield, K.,2015. In situ cosmogenic nuclide production rate calibration for the CRONUS-Earth project from Lake Bonneville, Utah, shoreline features. Quaternary Geochronology 26, 56-69. http://doi.org/10.1016/j.quageo.2014.11.002. Lyle, M., Heusser, L., Ravelo, C., Yamamoto, M., Barron, J., Diffenbaugh, N.S., Herbert, T., Andreasen, D. 2012. Out of the tropics: the Pacific, Great Basin Lakes, and Late Pleistocene water cycle in the western United States. Science 337, 1629-1633. http://doi.org/10.1126/science.1218390.
PR
Madole, R.F. 1969. Pinedale and Bull Lake Glaciation in upper St. Vrain drainage basin, Boulder County, Colorado. Arctic and Alpine Research 1, 279-287. Madole, R.F. 1980. Time of Pinedale deglaciation in north-central Colorado: Further considerations. Geology 8, 118-122.
D.
Madole, R.F. 1998. Pleistocene glaciation in the upper Platte River drainage basin, Colorado. U.S. Geological Survey Geological Investigations Series map I-2644.
TE
Marcott, S.A., Bauska, T.K., Buizert, C., Steig, E.J., Rosen, J.L., Cuffey, K.M., Fudge, T.J., Severinghaus, J.P., Ahn, J., Kalk, M.L, McConnell, J.R., Sowers, T., Taylor, K.C., White, J.W.C., Brook, E.J. 2014. Centennial-scale changes in the global carbon cycle during the last deglaciation. Nature, 514, 616-619. http://doi.org/10.1038/nature13799.
EP
Meierding, T.C., Birkeland, P.W. 1980. Quaternary glaciation of Colorado. In: H.C. Kent, K.W. Porter (Eds.), Colorado Geology. pp. 165-173. Meierding, T.C. 1982. Late Pleistocene glacial equilibrium-line altitudes in the Colorado Front Range: a comparison of methods. Quaternary Research 18, 289-310.
CC
Menounos, B., Reasoner, M. A., 1997. Evidence for cirque glaciation in the Colorado Front Range during the Younger Dryas chronozone. Quaternary Research 48, 38-47. http://doi.org/10.1006/qres.1997.1902.
RA
Munroe, J.S., Laabs, B.J.C., Shakun, J.D., Singer, B.S., Mickelson, D.M., Refsnider, K.A., Caffee, M.W., 2006. Latest Pleistocene advance of alpine glaciers in the southwestern Uinta Mountains, Utah, USA: Evidence for the influence of local moisture sources. Geology 34, 841-844. http://doi.org/10.1130/G22681.1.
PE
Oster, J.L., Ibarra, D.E., Winnick, M.J., Maher, K. 2015. Steering of westerly storms over western North America at the Last Glacial Maximum. Nature Geoscience 8, 201-205. http://doi.org/10.1038/NGEO2365.
PA
Parrenin, F., Masson-Delmotte, V., Köhler, P., Raynaud, D., Paillard, D., Schwander, J., Barbante, C., Landais, A., Wegner, A., Jouzel, J. 2013. Science 339, 1060-1063. http://doi.org/10.1126/science.1226368. Pierce, K.L. 2004. Pleistocene glaciations of the Rocky Mountains. In: A.R. Gillespie, S.C. Porter, B.F. Atwater (Eds.), The Quaternary Period in the United States. Elsevier, Amsterdam, pp. 63-76. Pigati, J. S., Bright, J. E., Shanahan, T. M., Mahan, S. A. 2009. Late Pleistocene paleohydrology near the boundary of the Sonoran and Chihuahuan Deserts, southeastern Arizona, USA. Quaternary Science Reviews 28, 286-300. http://doi.org/10.1016/j.quascirev.2008.09.022.
Leonard et al.
N
Plummer, M.A., Phillips, F.M. 2003. A 2-D numerical model of snow/ice energy balance and ice flow for paleoclimatic interpretation of glacial geomorphic features. Quaternary Science Reviews 22, 13891406. http://doi.org/10.1016/S0277-3791(03)00081-7.
VE RS IO
Putnam, A.E., Schaefer, J.M., Denton, G.H., Barrell, D.J.A., Birkel, S.D., Andersen, B.G., Kaplan, M.R., Finkel, R.C., Schwartz, R., Doughty, A.M., 2013. The Last Glacial Maximum at 44S documented by a 10Be moraine chronology at Lake Ohau, Southern Alps of New Zealand. Quaternary Science Reviews 62, 114-141. http://doi.org/10.1016/j.quascirev.2012.10.034. Rasmussen, S.O., Andersen, K.K., Svensson, A.M., Steffensen, J.P., Vinther, B.M., Clausen, H.B., Siggaard‐Andersen, M.L., Johnsen, S.J., Larsen, L.B., Dahl‐Jensen, D., Bigler, M., Röthlesberger, R., Fischer, H., Gotto-Azuma, K., Hansson, M.E., Ruth, U. 2006. A new Greenland ice core chronology for the last glacial termination. Journal of Geophysical Research 111, D06102. http://doi.org/10.1029/2005JD006079. Ray, L.L. 1940. Glacial chronology of the southern Rocky Mountains. Geological Society of America Bulletin 51, 1851-1918.
E-P RIN T
Reasoner, M. A., Jodry, M. A. 2000. Rapid response of alpine timberline vegetation to the Younger Dryas climate oscillation in the Colorado Rocky Mountains, USA. Geology 28, 51-54. http://doi.org/10.1130/0091-7613(2000)282.0.CO;2. Refsnider, K.A., Laabs, B.J.C., Plummer, M.A., Mickelson, D.M., Singer, B.S., Caffee, M.W. 2008. Last Glacial Maximum climate inferences from cosmogenic dating and glacier modeling of the western Uinta ice field, Uinta Mountains, Utah. Quaternary Research 69, 130-144. http://doi.org/10.1016/j.yqres.2007.10.014 .
PR
Refsnider, K.A., Brugger, K.A., Leonard, E.M., McCalpin, J.P., Armstrong, P.P. 2009. Last glacial maximum equilibrium-line altitude trends and precipitation patterns in the Sangre de Cristo Mountains, southern Colorado, USA. Boreas 38, 663-678. http://doi.org/10.1111/j.1502-3885.2009.00097.x. Richmond, G. M., 1960. Glaciation of the east slope of Rocky Mountain National Park, Colorado. Geological Society of America Bulletin 71, 1371-1382.
D.
Richmond, G. M. 1965. Glaciation of the Rocky Mountains. In: H.E. Wright, Jr, D.G. Frey (Eds.), The Quaternary of the United States. Princeton University Press, Princeton, NJ, pp. 217-230.
TE
Ruleman, C.A., Hudson, A.M. 2016. The Central Colorado Icefield, a mechanism for inception of regional exhumation and deep-canyon incision during the Pleistocene? Geological Society of America Abstracts with Programs 48.
EP
Schaefer, J.M., Denton, G.H. , Barrell, D.J.A., Ivy-Oaks, S., Kubik, P.W., Anderson, B.G., Phillips, F.M., Lowell, T.V., Schlüchter, C. 2006. Near-synchronous interhemispheric termination of the Last Glacial Maximum at mid-latitudes. Science 312, 1510-1513. http://doi.org/10.1126/science.1122872. Schildgen, T. 2000. Fire and Ice: Geomorphic history of Middle Boulder Canyon as determined by isotopic dating techniques, Colorado Front Range. B.S. Thesis, Williams College, Williamstown, MA, 73 pp.
RA
CC
Schweinsberg, A.D., Briner, J.P., Shroba, R.R., Licciardi, J.M., Leonard, E.M., Brugger, K.A., and Russell, C.M. 2016. Pinedale glacial history of the upper Arkansas River valley: New moraine chronologies, modeling results, and geologic mapping. In: S.M. Keller, M.L. Morgan (Eds.), Unfolding the Geology of the West, Geological Society of America Field Guide 44, pp. 335-353. http://doi.org/10.1130/2016.0044(14). Shakun, J.D., Clark, P.U., He, F., Marcott, S.A., Mix, A.C., Liu, Z., Otto-Bliesner, B., Schmittner, A., Bard, E. 2012. Global warming preceded by increasing carbon dioxide concentrations during the last deglaciation. Nature 484, 49-55. http://doi.org/10.1038/nature10915.
PE
Shakun, J.D., Clark, P.U., He, F., Lifton, N.A., Liu, Z., Otto-Bliesner, B.L. 2015. Regional and global forcing of glacier retreat during the last deglaciation. Nature Communications 6, 8059. http://doi.org/10.1038/ncomms9059.
PA
Thackray, G.D., 2008, Varied climatic and topographic influences on Late Pleistocene mountain glaciation in the western United States: Journal of Quaternary Science 23, 671-681. http://doi.org/10.1002/jqs.1210. Thompson, R.S., Anderson, K.H., 2000. Biomes of western North America at 18,000, 6000, and 0 14C yr BP reconstructed from pollen and packrat midden data. Journal of Biogeography 27, 555-584. http://www.jstor.org/stable/2656210.
Deglaciation of the Colorado Rocky Mountains following the Last Glacial Maximum
N
Thompson, R.S., Whitlock, C., Bartlein, P.J., Harrison, S.P., Spaulding, W.G., 1993. Climatic changes in the western United States since 18 000 yr B.P. In: H.E. Wright, Jr, J.E. Kutzbach, T. Webb III, W.F. Ruddiman, F.A. Street-Perrott, P.J. Bartlein (Eds.), Global climates since the last glacial maximum. University of Minnesota Press, Minneapolis, Minnesota, pp. 468-513.
VE RS IO
Wagner, J. D., Cole, J. E., Beck, J. W., Patchett, P. J., Henderson, G. M., Barnett, H. R. 2010. Moisture variability in the southwestern United States linked to abrupt glacial climate change. Nature Geoscience 3, 110-113. http://doi.org/10.1038/NGEO707. Ward, D. W., Anderson, R.S., Briner, J.P., Guido., Z.S. 2009. Numerical modeling of cosmogenic deglaciation records, Front Range and San Juan Mountains, Colorado. Journal of Geophysical Research–Earth Surface 114:F01026. http://doi.org/10.1029/2008JF001057. Young, N.E., Briner, J.P., Leonard, E.M., Licciardi, J.M., Lee. K. 2011. Assessing climatic and non-climatic forcing of Pinedale glaciation and deglaciation in the western United States Geology 39, 171-174. http://doi.org/10.1130/G31527.1.
PA
PE
RA
CC
EP
TE
D.
PR
E-P RIN T
Yuan, F., Koran, M. R., Valdez, A. 2013. Late Glacial and Holocene record of climatic change in the southern Rocky Mountains from sediments in San Luis Lake, Colorado, USA. Palaeogeography, Palaeoclimatology, Palaeoecology 392, 146-160. http://doi.org/10.1016/j.paleo2013.09.016.