1
ABATEMENT MEASURES TO REDUCE AMMONIA
2
EMISSIONS FROM OPEN-LOT FEEDYARDS AND DAIRIES
3
D. B. Parker, N. A. Cole, B. H. Baek, J. A. Koziel, M. B. Rhoades,
4
Z. Perschbacher-Buser, L. W. Greene, P. Sambana and J. M. Sweeten
5 6 7 8 9 10 11 12 13 14 15
The authors are David B. Parker, Associate Professor, Marty Rhoades and Zena Perschbacher-Buser, Research Associates, and Prabhakararao Sambana, MS Student, West Texas A&M University, Canyon, TX; N. Andy Cole, Research Animal Scientist, USDA-ARS, Bushland, Texas; B. H. Baek, Research Associate, L.Wayne Greene, Professor, and J.M. Sweeten, Resident Director, Texas A&M Research and Extension Center, Amarillo, TX; and Jacek A. Koziel, Assistant Professor, Iowa State University, Ames, IA.
Corresponding author: David B. Parker, West Texas A&M University, Box 60998, Canyon, TX 79015; phone: 806-6515281; fax: 806-651-2504; e-mail:
[email protected].
Abstract. Reduction of ammonia emissions from animal feeding operations is important from the
16
perspective of environmental policy and its impact on agriculture. Control measures for the abatement of
17
ammonia from open-lot beef cattle feedyards and dairies can be grouped into pre-excretion and post-excretion
18
strategies. Pre-excretion strategies include developing nutritional strategies to improve the utilization of crude
19
protein (CP). Decreasing CP from 13% to 11.5% at the end of the feeding period did not affect animal
20
performance, but the N:P concentration in the manure was unchanged. Decreasing CP from 13% to 10%
21
increased the N:P concentration in the manure, but adversely affected dry matter intake and gain efficiency.
22
Post-excretion strategies include the use of urease inhibitors and other additives to control ammonium
23
concentrations and manure pH. Additives such as alum which alter manure pH were shown to decrease ammonia
24
emissions by up to 98% in laboratory studies, but cost as much as $63 per animal unit per year. Urease
25
inhibitors have been shown to conserve urea in the manure and reduce ammonia emissions in the laboratory, but
26
based on recent research their effectiveness and economics in the field is still questionable. This paper further
27
discusses the factors affecting ammonia emission rates and effectiveness and economics of pre-excretion and
28
post-excretion BMPs for reducing ammonia emissions from animal feeding operations.
29
Keywords. ammonia, feedyard, dairy, manure, emissions, urease inhibitor, cattle
1
30 31
INTRODUCTION Beef cattle producers face many challenges as the result of increased public concerns regarding
32
effects of agricultural practices on the environment. Excessive nutrients accumulate in beef cattle
33
feedlots when imports of elemental nutrients in purchased feeds are greater than nutrient exports in
34
beef cattle products. Significant amounts of nitrogen can be volatilized from manure on the feedlot
35
surface. Scientists have estimated that as much as 50% of feed N is lost as ammonia (Bierman et al.,
36
1999).
37
Nitrogen loss into the atmosphere results in lower N:P ratios, leads to less-desirable fertilizer
38
value of manure, and contributes to air quality concerns. The need to decrease the emissions of
39
ammonia and other gases produced by livestock and their waste products has grown in recent years. As
40
a result of data indicating that these gases have the potential to contribute to the greenhouse effect, acid
41
rain, and/or stratospheric ozone depletion, many European countries already have regulations limiting
42
ammonia emissions from concentrated animal feeding operations. Moreover, emissions of ammonia
43
and oxides of N and S have been implicated as potential contributors to fugitive dust emissions,
44
especially PM-10 and PM-2.5 particulates (Morse, 1996a; Morse, 1996b).
45
The nitrogen excreted in the feces is composed of undigested feed residues, microbial cells,
46
endogenous secretions, and sloughed cells from the gastrointestinal tract. Once excreted, most of these
47
nitrogenous residues are degraded slowly and therefore release ammonia-N into the atmosphere at a
48
slow rate. In contrast, urinary N is composed primarily of urea (CO(NH2)2), which is rapidly
49
hydrolyzed to ammonium and carbon dioxide by microbes in the feces and soil (Mason, 2004). The
50
conversion of urea to ammonium is an enzymatic process, and is catalyzed by the urease enzyme
51
which is present in feces and soil.
52
Ammonia volatilization is a complex process which is generally related to four factors: 1)
53
ammonium concentration in the manure and atmosphere, 2) temperature of the manure, 3) pH of the
54
manure, and 4) turbulent transport or wind exchange (Harper et al., 2004; Sommer and Hutchings,
55
1995). Scientists working on control measures have typically focused on reducing ammonium
2
56
concentrations, controlling pH, and reducing the exposed area and air exchange over the emitting area
57
(Sommer and Hutchings, 1995).
58
These control measures can be grouped into two primary management strategies: 1) pre-excretion
59
strategies such as altering animal diets, and 2) post-excretion strategies such as altering pH or applying
60
surface additives. Pre-excretion strategists would ask the question "What can we do to reduce the
61
nitrogen excreted in the manure?" while post-excretion strategists would ask "What can we do to
62
reduce ammonia emissions once the manure hits the ground?" Both of these strategies will be
63
discussed in detail with reference to recent research.
64
PRE-EXCRETION STRATEGIES
65
Cattle consume nitrogen in the form of crude protein (CP), and convert it into body tissue or
66
byproduct waste (urine and feces). A logical method for controlling the amount of volatized ammonia
67
is to develop nutritional strategies to improve the utilization of CP. Excess N is passed through the
68
animal and excreted in the feces and urine. Reducing these dietary excesses might be the easiest way to
69
reduce nutrients in the manure. In an ideal world, cattle would be fed the exact amount of nutrients that
70
their bodies require for optimum growth. However, because of inherent variation in cattle and feed
71
ingredients, this may not be altogether possible. Nevertheless, identifying methods for altering and
72
controlling inputs is a current focus of research (NRC, 2000).
73
It is common industry practice for beef cattle to be fed a constant CP concentration (routinely
74
approximately 13 to 13.5%) throughout the entire feeding period (Galyean and Gleghorn, 2000).
75
However, nutrient requirements change as the cattle grow, resulting in animals receiving less than
76
optimum CP early in the feeding period and greater than optimum CP late in the feeding period
77
(Gleghorn et al., 2004). Changing the diet (i.e. the CP concentration) during the feeding period to more
78
closely meet the nutritional requirement is a concept called 'phase feeding.' Studies with cattle fed
79
finishing diets based on dry-rolled corn suggest that CP concentration can be reduced to less than 11%
80
during the latter portion of the feeding period without adversely affecting animal performance
3
81
(Erickson et al., 2001). However, when cattle are fed more fermentable finishing diets based on
82
steam-flaked grains, decreasing dietary CP concentrations could potentially lead to an increase in
83
digestive disturbances (Cole, 2003).
84
Vasconcelos et al. (2004a, 2004b) evaluated the effects of phase feeding on the performance of
85
beef steers fed steam flaked corn based diets (Table 1). All cattle were fed a 90% concentrate finishing
86
diet that contained 13% CP until they weighed approximately 477 kg. At that time, the diet was either
87
maintained at 13% CP or switched to 11.5% CP or 10% CP. Decreasing dietary CP to 11.5% did not
88
affect performance; however, decreasing the CP to 10% adversely affected dry matter intake and gain
89
efficiency. Decreasing dietary CP to 11.5% did not significantly affect the N:P ratio of pen surface
90
manure but decreasing dietary CP to 10% increased (P < 0.05) the manure N:P ratio.
91
In a larger study, with more extensively processed steam flaked corn, Gleghorn et al. (2005,
92
unpublished data) noted similar overall results. However, they also noted that switching diets during
93
the last 56 days on feed caused a decrease in dry matter intake (P 120 41.04 d 5.60 d 177.6 c 15.6 27.7 45.0 c
SEM 1.19 0.11 10.4 0.88 2.14 2.17
114 115 116
Nitrogen excretion can also be shifted away from the urine via feeding a protein source with a
117
lower ruminal degradability. Increasing the urea concentration of the diet can increase urinary N
118
excretion and thus increase ammonia losses (Cole et al., 2005).
119
POST-EXCRETION STRATEGIES
120
Several post-excretion applied chemical amendments and additives have been studied to reduce
121
ammonia emissions (Cole et al., 1999). In open lot feedyards and dairies, temperature and turbulent
122
transport (i.e. wind) are difficult to control, making the controlling of ammonium concentration and pH
5
123
the best means available for controlling post-excretion ammonia volatilization. Additives rely on
124
several modes of action to control pH and ammonium concentration.
125
CONTROL OF PH
126
The ammonium concentration in manure is dependent on the rate of hydrolysis of urea
127
(CO(NH2)2). Urea is initially converted to ammonium carbonate (Eq. 1), then to ammonium ions,
128
carbon dioxide gas, and water (Eq. 2). The hydrolysis reaction consumes H+, increasing the pH
129
(Sawyer and McCarty, 1978). The resultant increase in pH then drives the ammonium-ammonia
130
balance (Eq. 3) to the right, increasing ammonia volatilization.
} ⇒
urease enzyme
131
CO( NH 2 ) 2 + 2H 2 O
132
( NH 4 ) 2 CO 3 + 2H + ⇒ 2 NH 4 + CO 2 ↑ + H 2 O
133
NH 4 + OH − ⇔ NH 3 ↑ + H 2 O
134
( NH 4 ) 2 CO 3
[1]
+
[2]
+
[3]
Ammonium predominates at lower pH while ammonia gas predominates at high pH. At a pH of
135
approximately 9.5, equal amounts of ammonia and ammonium are present. Nearly 10 times more
136
ammonia is present when the pH is 8.0 than when the pH is 7.0. Thus, decreasing the pH has been
137
shown to reduce ammonia losses (Harmsen and Kolenbrander, 1965).
138
Chemical amendments such as alum and calcium chloride reduce ammonia emissions by
139
decreasing pH and through cation exchange. Hydrolysis of the Al ion in alum frees three H ions,
140
decreasing pH and reducing ammonia emissions. Through cation exchange, hydrogen ions are released
141
and replaced by aluminum or calcium ions, again resulting in decreased pH and reduced ammonia
142
emissions.
143
3+
+
Kithome et al. (1999) evaluated the efficacy of the chemical amendments CaCl2, CaSO4, MgCl2,
144
MgSO4, and Al2(SO4)3 (alum) for reducing ammonia emissions from composted poultry manure.
145
Mixing 20% CaCl2 with compost reduced ammonia emissions by 90%, whereas 20% alum reduced
146
ammonia emissions by 26%. However, CaSO4 and MgSO4 were ineffective in reducing ammonia
6
147
emissions. Moore et al. (1995) reported that alum significantly reduced ammonia volatilization from
148
poultry manure. The direct addition of sulfuric acid to cow and pig slurries has also been shown to
149
reduce ammonia volatilization (Stevens et al., 1989).
150
In a laboratory experiment, Shi et al. (2001) evaluated several amendments which used pH
151
adjustment for the control of ammonia emissions from simulated open-lot feedyards (Table 3, Figure
152
1). Alum was effective at reducing ammonia emissions by as much as 98%. There was a strong
153
curvilinear relationship between pH and ammonia emissions, with ammonia emissions increasing
154
rapidly between pH 6 and 8 (Figure 2).
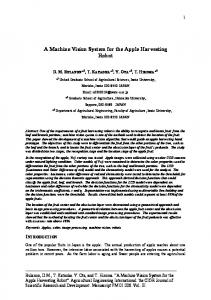
155 156 157
Figure 1. Photograph of the ammonia emission apparatus consisting of Tupperware® air emission chambers and acid traps connected to a vacuum pump.
158
159 160 161
CONTROL OF AMMONIUM CONCENTRATION Ammonia emissions can be decreased by altering the carbon/nitrogen ratio of the pen surface. Subair et al. (1999) evaluated the ability of paper products added to liquid hog manure to reduce
7
162
ammonia emissions, and found that ammonia volatilization was reduced from 29% to 47% by
163
increasing the carbon/nitrogen ratio of the liquid hog manure.
164 165 166 167
Table 3. Total ammonia-N volatilized from simulated open-lot beef cattle feedyard surfaces over a 21-day period in the laboratory (adapted from Shi et al., 2001). Each mean was calculated from three replications. Costs include materials and shipping, but do not include spreading costs. Treatment
Mean NH3-N Emisson Rate (µg m-2 min-1) 14 a
% Reduction as Compared to Control NA
Cost if Applied Every 21 Days ($ animal unit-1 yr-1)
Final pH
Blank (soil only) 6.83 Control (soil-manure, 3307 e NA 7.55 no amendment) Alum (4500 kg/ha) 281 a 91.5 5.98 Alum (9000 kg/ha) 56 a 98.3 4.20 Calcium chloride 952 bc 26.4 6.99 (4500 kg/ha) Calcium chloride 743 b 22.5 6.85 (9000 kg/ha) Brown humate 1071 bcd 32.4 7.06 (9000 kg/ha) Black humate 1314 d 39.8 7.10 (9000 kg/ha) NBPT (1 kg/ha) 1186 cd 35.9 7.52 NBPT (2 kg/ha) 1138 cd 34.4 7.58 Means in a column without common letters are significantly different using Tukey’s HSD test (P