Developmental Science 12:3 (2009), pp 438– 445
DOI: 10.1111/j.1467-7687.2008.00784.x
PAPER Blackwell Publishing Ltd
The development of change blindness: children’s attentional priorities whilst viewing naturalistic scenes S. Fletcher-Watson, J.M. Collis, J.M. Findlay and S.R. Leekam Department of Psychology, University of Durham, Durham, UK
Abstract Change blindness describes the surprising difficulty of detecting large changes in visual scenes when changes occur during a visual disruption. In order to study the developmental course of this phenomenon, a modified version of the flicker paradigm, based on Rensink, O’Regan & Clark (1997), was given to three groups of children aged 6–12 years and to a group of adults. This paradigm tested the ability to detect single colour, presence/absence and location changes of both high and low semantic importance in a complex scene. Semantically important changes were detected more quickly and accurately than less semantically important changes, by all age groups, indicating that children had the same attentional priorities as adults. Older children achieved more efficient and accurate detection of changes than younger children and reached almost adult level at 10–12 years old. These improvements parallel age-related developments in attention and visual perception.
Introduction Change blindness is the phenomenon whereby a perceiver fails to detect changes in a visual display from one view to the next, when the views are separated by any event that creates a brief disruption (Rensink, O’Regan & Clark, 1997). Disruptions may result from a saccade, an eye blink, a cut or pan in a motion picture, a flashed blank screen or even a series of ‘mudsplashes’ occluding only parts of the image (Simons, 2000). Rensink et al. (1997) proposed that these disruptions mask the transient motion signals that usually accompany a change and would ordinarily draw our attention to the location of that change. As a consequence, focused attention is required at the site of change for detection to occur. Change-detection ability is therefore an index of attention to a particular scene component. Investigating change detection can reveal the attentional priorities of different groups. For example, Werner & Theis (2000) found that experts in American football showed a detection advantage for changes to scenes depicting American football games, whereas novices in the sport showed no such ability. Applying the same principle to different age groups, we can ask whether children show the same change-detection abilities as adults. Change-blindness studies with children can reveal two aspects of attentional development: first, whether their attentional system is susceptible to the ‘blinding’ effects of visual disruptions in the same way as adults; and, second, whether they show the same high-level influence on selection for attention as adults. The current study aims to address both of these questions.
Perhaps surprisingly, only one study has been reported in which change blindness was investigated in typically developing children. Shore, Burack, Miller, Joseph & Enns (2006) recently investigated change blindness in children viewing simple images of isolated objects. This study found a developmental trend for increasing success at the change-blindness task. Three types of change were included in the study. Changes in which object parts were deleted, or in which their colour was changed showed a developmental trend that was stronger than that occurring with changes in object orientation. Shore et al. suggested that this may reflect reverse hierarchy theory (Ahissar & Hochstein, 2004), whereby conscious access to whole perceptual items occurs earlier, both in relation to immediate visual processing and during the course of development, than that to item parts. Shore et al.’s study reveals that children are subject to the usual effects of presentation in a change-detection paradigm, and that their immature attentional system may be particularly susceptible to a difficulty in noticing changes to object parts. However, because the stimuli used in their paper did not present realistic scenes, the results cannot tell us whether children prioritize for focused attention the same aspects of a scene as adults. The current study complements that of Shore et al. by investigating developmental trends in change blindness using coherent scenes. The study is a partial replication of Rensink et al.’s (1997) experiment, using a modified version of Rensink’s flicker paradigm. Rensink et al. compared the ability to detect changes having high semantic significance, as determined by a pre-test, with that to detect those having low significance. Adults detected
Address for correspondence: S. Fletcher-Watson, Institute of Health and Society, Newcastle University, Sir James Spence Institute, Royal Victoria Infirmary, Newcastle upon Tyne NE1 4LP, UK; e-mail:
[email protected] © 2009 The Authors. Journal compilation © 2009 Blackwell Publishing Ltd, 9600 Garsington Road, Oxford OX4 2DQ, UK and 350 Main Street, Malden, MA 02148, USA.
The development of change blindness
semantically important changes more readily than less important changes. In replicating this study with children we can investigate whether children show the same prioritization as adults for semantically important items. The current study also represents an opportunity to replicate two of Shore et al.’s findings in coherent stimuli. First, Shore et al. found an improvement in changedetection ability with age. Our stimuli are naturalistic representations of a real-world visual experience, and this could have the effect of making change detection more difficult, because of the increased stimulus complexity, or easier, because of the link to reality. In either case we would expect to see a developmental improvement in change detection, but the use of realistic scenes could also have the effect of increasing or decreasing the gap between the oldest children’s and adult performance. Rensink et al. included changes that involved withinobject manipulations (colour changes) and those involving whole-object changes (deletion/appearance or location changes). These changes were not balanced for ease of detection but nevertheless offer a means of measurement of the development of change-detection abilities for different types of change. Thus the use of this stimulus set allowed us to discover whether the differential development trend for different types of change noted by Shore et al. (2006) would be replicated with changes in coherent scenes. An alternative possibility is that children in our study would not find changes to whole items easier to detect than changes to parts of an object, because presenting items in a complex scene means that there is reduced opportunity to perceive them as single perceptual entities. In sum, the current study offers an opportunity to investigate three questions of interest. First, will children show change-detection improvement with age for changes embedded within naturalistic scenes? Second, will children show an influence of high-level interest on attention, such that changes to items of central interest are detected more quickly than changes to marginal-interest items? Third, is there evidence for variable detection ability for whole-object versus object-part changes in children, when those objects are part of a complex scene?
Method Subjects Ninety-four children from four schools located in Malvern, Worcestershire completed the change-blindness task, with an age range of 6 years 0 months to 12 years 9 months. Children were divided into three age groups for analysis: the 6–8-year-old group (N = 36, mean age = 7.2 years, SD = 8 months), the 8–10-year-old group (N = 28, mean age = 9.3 years, SD = 7.4 months) and the 10–12-year-old group (N = 30, mean age = 11.5 years, SD = 10 months). Consent was obtained from the parent/caregiver, and each child gave assent before being © 2009 The Authors. Journal compilation © 2009 Blackwell Publishing Ltd.
439
tested. The gender distribution across the entire sample was 50.9% male. Within the groups, the 6–8-year-olds were 55.6% male, the 8–10-year-olds were 50% male and the 10–12-year-olds were 46.7% male. In addition, 20 undergraduate students were recruited from Durham University, with an age range of 19 to 22 years, and were tested as a comparison adult group. This group was 50% male. Each participant’s visual acuity and colour vision were tested to ensure that these could not account for a failure to see any changes. Apparatus and materials The experimental stimuli were exactly those used by Rensink et al. (1997),1 consisting of 48 pairs of colour pictures of real-world scenes. Each pair consists of two pictures, identical apart from a single difference in the colour, presence/absence or location of a particular object or area. In each category, changes were either of high semantic importance (central interest) or of low semantic importance (marginal interest). The level of interest of scene items was determined arbitrarily, in the original study in which these images were used (Rensink et al., 1997), by five naïve adult observers who provided a verbal description of each scene. Aspects of a scene were defined as central when mentioned by three or more observers, whereas marginal areas were mentioned by no-one. These definitions were adopted for the current study. The image pairs were separated into six change conditions: central colour, marginal colour, central location, marginal location, central presence/absence and marginal presence/absence, with eight trials in each condition. The changes were roughly equated for area, intensity, colour and location in the image. However, on average, marginal changes were 20% larger in area than central changes (Rensink et al., 1997). Six additional image-pairs were developed as practice trials. The images were displayed on a 15-inch colour monitor on a Toshiba Satellite A30 laptop computer in full colour. Images were all the same size (500 × 700 pixels) and were presented on a white background. Stimuli were presented in a ‘flicker’ paradigm using a specially written program to control the image display durations and record response times for each trial (see Figure 1). Stimuli were presented in a random order that was the same for half of the participants (order 1). The other half of participants saw the same stimuli in the reverse order (order 2). There was no blocking of stimuli according to either level of interest or change type. Several pilots, carried out on children with a range of ages between 6 and 12, indicated that the optimum presentation speed of the ‘flicker’ for testing children in this age range was an image display time of 360 ms with 1 We thank Professor Rensink for granting permission for use of this material.
440
S. Fletcher-Watson et al.
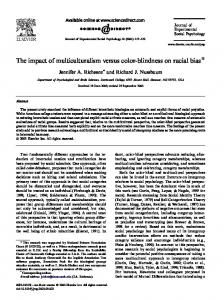
Figure 1 Illustration of the sequence of events within a single trial. The figure depicts a stimulus used in a practice trial. This image is comparable in style, content, colour and complexity to the experimental scenes presented.
a blank inter-trial interval of 120 ms and a maximum duration of 45 alternations for each trial.2 This prevented ceiling effects (when the inter-trial interval was too short), floor effects (when image display time or maximum duration were too short) and boredom (when all durations were too long). Design This study has a mixed design. The within-participants variables were type of change (colour, presence/absence, location) and level of interest (central versus marginal). The between-subjects factor was age, namely three groups of children and a group of adults. The two dependent variables were response time and accuracy in detecting the change. Participants were randomly assigned to one of two fixed experimental orders. The first order was created by randomizing stimuli (order 1) and the second order consisted of the exact reverse order (order 2). Procedure Each participant was tested individually in a quiet room at their school or university, with minimal distractions. Before the test commenced, visual acuity was tested using a Snellen Chart and colour vision was assessed using the Ishihara plate test (Ishihara, 1971). The experimental order presented was also noted. Participants were then asked to sit down approximately 50 cm from the computer screen. The experimenter gave a brief overview of the experiment and informed the participant of the three change types possible (colour, location and presence/absence). Participants were instructed to search for a change between images ‘flashed’ up on the computer and to press the space bar when they saw 2
In contrast, Rensink et al. (1997) used a 240-ms image display time with 80-ms inter-trial intervals. © 2009 The Authors. Journal compilation © 2009 Blackwell Publishing Ltd.
a change, as quickly as possible. They should then briefly verbally describe what change had occurred, and they could also point at the screen to identify the change location (the image remained on the screen for this purpose, until the participant advanced to the next trial). Participants were told that a change would occur on every trial and were encouraged to keep searching for differences between the images until the pictures stopped ‘flashing’. Six practice trials were presented, to allow the participant to become familiar with the task. The practice trials were followed by the 48 experimental trials. Following the verbal response at the end of each trial, the experimenter noted down on a record sheet whether the participant had correctly located the change or not. Short breaks in the task were provided after every 12 trials. Verbal feedback was given throughout the task when a participant incorrectly identified or failed to locate a change. Participants were then thanked and debriefed. In total, the session took approximately 20 minutes.
Results Exclusion of errors On some occasions, participants accidentally pressed the space bar, prematurely terminating a trial unintentionally. These error responses were excluded from all response-time and accuracy analyses. The number of error responses made and excluded did not differ among age groups, level of interest (central versus marginal) or type of change (colour, location, appearance/disappearance). In total, 1.5% of trials were excluded in this way. Exclusion of outliers Of the 94 child participants tested, nine were omitted from statistical analyses – four owing to deficient colour vision as measured by the Ishihara plate test and five
The development of change blindness
441
owing to especially slow or inaccurate performance across conditions, relative to their own group’s mean scores. All of these five outliers had scores 3 or more standard deviations away from the mean. Two were participants from the 6–8-year-old group, two were from the 8–10year-old group and one was from the 10–12-year-old group. Outlying participants were excluded because they may have failed to understand the task instructions or failed to focus on the task at hand. For the remaining 105 participants (85 children and 20 adults), visual acuity, coded according to the best eye, did not fall below an acceptable level (6/9) for any participant. Figure 2 The interaction between age group and level of interest for percentage correct responses. It can be seen that the effect of level of interest was greatest for the youngest group of children, although from about 8 years old, all participant groups show a similarly sized effect of level of interest.
Order effects Trials were presented to participants in one of two random orders and there was one interaction involving order. For response-time data, there was a three-way interaction between level of interest, change type and order F(2, 194) = 7.07, p = .001. This occurred because in order 2 only, participants tended to have faster response times to marginal presence/absence changes relative to other marginal changes. It is not thought that this order effect is of theoretical significance.
fewer correct responses than each of the older groups (all p < .001). In addition, the 8–10-year-old group made significantly fewer correct responses than the adult group ( p < .001). This indicates an improvement in change-detection ability with age, which tails off at the age of about 11 years, as this group of children did not differ from the adults. The second question was whether children would show evidence of high-level direction of attention according to the interest level of scene items. A significant main effect of level of interest, F(1, 202) = 191.44, p < .001, such that central-interest changes produced more correct responses than marginal-interest changes, indicates that all participants showed enhanced change detection for items of central interest. There was also an age by level of interest interaction, F(3, 202) = 14.34, p < .001, showing that the effect of level of interest on accuracy (such that marginal changes are detected less accurately than central changes) was greatest in the youngest participants (see Figure 2). This indicates that children are even more susceptible to the effects of high-level interest on attention than adults. A third question was whether there would be evidence for differential detection of changes to whole objects
Analysis of accuracy data Accuracy data by group are presented in Table 1. These were calculated after removal of key-press errors from the data, as recorded above. The remaining incorrect responses occurred when a participant either identified the wrong item as changing or failed to identify any change before trial termination. A repeated-measures ANOVA (level of interest by change type by age group) was performed on percentage of correct responses. This ANOVA is interpreted in terms of the three questions laid out in the Introduction. The first was, do children show improvements in change detection with age, for changes embedded within a naturalistic scene? There were significant differences in the percentage of correct responses between the age groups, F(3, 101) = 32.00, p < .001. Planned comparisons indicated that the 6–8-year-old group made significantly
Table 1 Group accuracy and response latencies by change type. Means are shown with standard deviations in brackets Percentage correct means Colour
6–8 yrs 8–10 yrs 10–12 yrs Adult (19–22 yrs)
Presence/Absence
Response times (ms) Location
Colour
Presence/Absence
Location
Central
Marginal
Central
Marginal
Central
Marginal
Central
Marginal
Central
Marginal
Central
Marginal
97.8% (1.5) 98.2% (1.5) 99.1% (1.3) 99.7% (0.8)
97.3% (2.2) 98.5% (1.6) 98.8% (1.5) 99.4% (1.4)
98.5% (1.6) 98.7% (1.3) 99.1% (1.3) 99.6% (0.9)
95.5% (2.4) 96.9% (2.2) 97.9% (1.9) 99.3% (1.4)
99.8% (0.6) 99.8% (0.6) 99.8% (0.5) 99.9% (0.5)
92.2% (2.7) 95.7% (2.5) 96.8% (2.7) 96.6% (2.5)
5436 (3015) 5426 (2910) 4238 (2098) 3272 (1278)
12503 (4368) 9578 (3045) 8061 (3146) 7077 (2684)
8091 (2879) 6157 (2223) 5656 (3045) 3880 (1769)
13378 (5264) 10353 (4482) 9318 (2952) 8604 (3263)
4285 (2039) 3272 (1027) 2778 (1030) 2973 (1415)
14845 (5239) 14532 (4632) 12151 (4142) 9374 (3435)
© 2009 The Authors. Journal compilation © 2009 Blackwell Publishing Ltd.
442
S. Fletcher-Watson et al.
Figure 3 Illustration of the two-way interaction between change type and level of interest, and of the three-way interaction between age group, level of interest and change type, for percentage correct responses. Part (a) (left) shows that all child groups show the best performance for location changes, and poorer performance for changes to presence/absence, and particularly colour. However this variation of accuracy according to change type decreases with age, such that adult performance is equally high for all change types. Part (b) (right) shows a slightly greater effect of change type across all ages, compared with the central condition depicted in part (a). However, in this condition the relative position of the different change types is reversed: location changes are detected most poorly, whereas changes to presence/absence and particularly colour are more accurately spotted.
(presence/absence and location changes) versus object parts (colour changes). There is evidence for enhanced detection of whole-object changes in the central-interest condition only. A significant interaction of change type and level of interest, F(2, 202) = 94.92, p < .001, showed that the pattern of accuracy across different types of change was different for each level of interest. For central-interest changes, location changes were detected most accurately, followed by presence/absence and finally colour changes. However, for marginal changes, exactly the opposite order applied (see Figure 3), showing that in this condition changes to object parts were detected more accurately than whole-object changes. There was also a main effect of change type, F(2, 202) = 22.03, p < .001, with colour changes being more accurately detected than presence/absence changes, which were in turn more accurately detected than location changes (all p < .001). This indicates that across both levels of interest, and contrary to expectations, wholeobject changes were detected more poorly than changes to object parts. This finding is accompanied by an age by change-type interaction, F(6, 202) = 2.49, p = .024, indicating that the 6–8-year-old group and the adult group both showed particularly poor accuracy for location changes compared with the other two groups (see Figure 4). This interaction also does not provide evidence of enhanced detection of whole-object changes. In addition, there was a three-way interaction between level of interest, change type and age group, F(6, 202) = 5.92, p < .001. This resulted from the fact that all three child groups showed the two-way interaction of change type and level of interest described above, such that their accuracy pattern across three change types was reversed for central- and marginal-interest changes. By contrast, the adult data showed a very high level of accuracy for all changes, except marginal location changes (see Figure 3). © 2009 The Authors. Journal compilation © 2009 Blackwell Publishing Ltd.
Figure 4 The interaction between age group and change type for percentage correct responses. The figure shows a consistent improvement in change-detection accuracy across age groups for all change types, with two exceptions. Both the youngest group of children and the adult group show a marked drop in accuracy for changes to location only.
This ceiling-level response for most stimuli may have masked any evidence of such an effect in the adult group. It is also possible that adult accuracy at or near ceiling drove many of the age effects reported above. Therefore, the analysis of accuracy was repeated with the adult group excluded. This analysis replicated all the main effects and interactions reported above, at the same or similar levels of significance. The only exception was that the interaction of age group and change type became somewhat weaker when adult data were excluded from the analysis, although it was still significant, F(4, 164) = 2.51, p = .044. This is because now only the 6–8-year-old group differs from the other two child groups, in showing particularly poor accuracy for location changes, whereas before the adult group also showed this pattern, strengthening the interaction.
The development of change blindness
443
Analysis of reaction-time data Reaction-time data were analysed, to reinforce the findings from the analysis of accuracy data. The mean reaction times for each change condition, for each age group, are shown in Table 1. The first point to note is that the data show no evidence that a speed–accuracy trade-off is taking place. Conditions producing the highest accuracy tend also to entail the shortest response times and vice versa. In addition, as accuracy improves with age so too does response time. Only correct responses were used in reaction-time analyses, as in Rensink et al. (1997). A repeated-measures ANOVA was performed on change type, level of interest and age group. Once more, this ANOVA is interpreted in the context of the three questions posed in this paper. The first was whether we would find evidence of age-related improvements in change-detection ability. A main effect of age group, F(3, 101) = 56.44, p < .001, followed by planned comparisons, revealed a developmental trend for more rapid change detection with age. The 6–8-yearold group was slower than all other groups overall (all p < .001). The 8–10-year-old group was slower than both older groups (both p < .006), and the 10–12-year-old group and the adults did not significantly differ in overall response time. This finding replicates the accuracy data in revealing that change detection does improve with age but reaches adult levels at about 11 years old. The second question of interest was whether children and adults alike would show evidence of an influence of high-level interest on attentional focus. A main effect of level of interest, F(1, 202) = 928.36, p < .001, showed that central changes were detected faster than marginal changes. There was also an interaction of level of interest by age group, F(3, 202) = 15.68, p < .001. As with the accuracy data, these data reveal that interest level has an effect on change detection, and that this effect is greatest in the youngest participants. The third question of interest was whether there would be enhanced change detection for changes to whole objects over changes to part of an object. A main effect of change type, F(2, 202) = 22.96, p < .001, revealed that colour changes were detected more quickly than presence/absence changes, which were in turn detected more quickly than location changes (all p < .05). This replicates the accuracy data and contradicts the expectation that whole-object changes would be easier to detect. In this case, the finding is not qualified by an interaction with level of interest. Nevertheless, there was again a three-way interaction of level of interest, change type and age group, F(6, 202) = 2.81, p = .012. This three-way interaction is slightly different from that seen in the accuracy data. All three child groups show the fastest response times to marginal changes for colour, slower responses to presence/absence and the slowest response time to location changes, and this mimics the results from the accuracy data. However, this time, central colour and location changes are both © 2009 The Authors. Journal compilation © 2009 Blackwell Publishing Ltd.
Figure 5 Illustration of the three-way interaction between age group, level of interest and change type, for response time. Part (a) (top) shows the response time to change types in the central condition. As in the analysis of accuracy (see Figure 3), location changes are detected most easily, with colour and presence/ absence changes less rapidly detected. Again, the adult group shows very little variation in response time for different change types. Part (b) (bottom) shows response time to change types in the marginal condition. As in the analysis of accuracy data, the pattern is reversed compared to the central condition. Location changes are now detected most slowly, and colour changes most rapidly. Once more, the adults show very little difference between response times for the different change types.
detected more quickly than presence/absence changes. The adults show fast response times to all change types and levels of interest, with very little variation between different types of change (see Figure 5). Once more, the bulk of the evidence suggests that changes to object parts (i.e. colour changes) are in fact detected most rapidly, contrary to expectations. The absence of this pattern in the adult data is attributed to performance at ceiling in this group. Transformation of response-time data Response-time data distributions were analysed for signs of non-normality before all reported analyses, and all variables were found to be normally distributed, with one exception. A high positive kurtosis value was found
444
S. Fletcher-Watson et al.
for response times to central location changes only (7.29), indicating that these data were not normally distributed, confirmed by a Kolmogorov–Smirinov test, KSz = 1.38, p = .04. In order to meet the assumptions of an ANOVA, all variables entered must be normally distributed. However, this means transforming response-time variables for all six conditions in the same way, despite the fact that only one is non-normal, reducing variability in the data. To deal with this issue, response times were analysed twice – once (above) using the original measures and once using response times that had been subject to a log-transform, which eliminated kurtosis. This second analysis yielded results that directly replicated the analysis above except on two counts. First, the significant level of interest by age interaction was not found in the transformed data ( p = .96), indicating that this interaction was largely driven by variability in the data set. Second, the transformed data gave rise to a new interaction between level of interest and change type. Central-interest changes are detected most rapidly when they are location changes, with colour and presence/ absence changes identified more slowly. For marginalinterest changes, location changes are detected most slowly and presence/absence and colour changes are detected more rapidly. This interaction, which corresponds to that found in the accuracy data, was presumably masked by the non-normality of the central location data in the untransformed data set. Summary Our data reinforce the work of Shore et al. (2000) in showing a developmental trend for improved change detection with age. This is evident both in increased accuracy and in faster response times. The trend levels off at around 11 years old, such that these children do not significantly differ from adults. Second, analyses reveal that level of interest has an impact on change detection at all ages, and that its effects are greatest among younger children. Third, data do not show the expected effect whereby changes to a whole object (location and presence/absence) are more easily spotted than changes to part of an object (colour changes). In fact, overall, colour changes are the easiest to detect. This interpretation is complicated by the fact that, in the central condition only, colour changes are detected poorly. Furthermore, the adult data show very little variation between change types.
Discussion This study aimed to investigate whether change blindness is present in children aged 6 to 12 years and to identify any age-related trends in the ability to detect change in complex scenes. The experiment replicated the work of Shore et al. (2006) in using three categories of change type, but extended it to investigate change detection for © 2009 The Authors. Journal compilation © 2009 Blackwell Publishing Ltd.
objects presented within naturalistic scenes. The study also made a new assessment of whether children hold attentional biases similar to those of adults, by examining responses to changes of differing semantic importance within a complex scene. It was also possible to examine whether our stimuli would provide evidence for enhanced detection of changes to whole over parts of objects. Analysis of the change-blindness task revealed age-related effects whereby children’s response time and accuracy improve with age, reaching adult levels by 10–12 years old. The 10–12-year-old group did not significantly differ from the adult group on any measure of accuracy or response time, and in fact even the performance of the 8–10-year-old group did not always differ from that of the adults. It is possible that to some extent this improvement with age reflects faster reaction times, but as response times to this task, across all participants, never dropped below 1.3 seconds and were often longer than 10 seconds, it is thought that developmental changes in reaction time had a minimal influence in this task. Our result contrasts with the findings of Shore et al. (2006), who found significant differences when comparing adults with all child groups of similar ages to our sample. It is not possible to compare results directly between these two studies owing to the different presentation formats used, but the lack of a difference between the response times of adults and children aged approximately 11 years in our study suggests that the use of complex, naturalistic stimuli in the task may have a positive effect on child responses. This could be because realistic stimuli mimic more closely the circumstances of real life. This interpretation is reinforced by Shore et al.’s finding that changes to realistic photographs were detected more easily than changes to line-drawings. Our study went a step further by using naturalistic scenes, and as a result children may have been able to apply real-life experience to the task more readily, or they may simply have been more comfortable and less anxious about the experiment, leading to improved performance. There were, however, indications of some differences between all the children and the adults in the interactions between age group, level of interest and type of change. These interactions were produced by children’s responses varying between different types of change, whereas the adult group showed very similar levels of accuracy and detection speed to all change types, within a particular level of interest. In fact, adult data could be interpreted as being largely at ceiling, with the exception of a marked depression in adult accuracy for marginal location changes only (the category that children found hardest as well). This indicates that the type of change being presented had an effect on child responses but not so much on adult responses. However, the conclusion of Shore et al. (2006) that certain change types are inherently easier to detect than others needs qualifying, as the effect of change type on response found here was not consistent between the two levels of interest. Certainly,
The development of change blindness
our data do not support the predictions of reverse hierarchy theory, that changes to whole objects should be consistently more readily detected than changes to parts, as in the marginal condition part-object changes were the most accurately and rapidly detected. Semantically important (central) changes were detected more readily than less semantically important (marginal) changes, across all ages, for each change type. This pattern has been thought to occur because attention is preferentially drawn to high-interest objects in a scene, allowing changes located on these objects to be detected rapidly and accurately (Rensink et al., 1997). The fact that children showed an enhanced ability to detect changes in ‘central importance’ areas, originally defined by adults, suggests that they have the same attentional biases and priorities as adults and, moreover, that these biases direct their visual attention to important parts of a scene. In fact this pattern was at its strongest in the youngest group of children, aged approximately 7 years, who showed a particularly large effect of level of interest on their responses. However, an alternative explanation is that ‘centralinterest’ items, as defined by participants in Rensink et al.’s (1997) original study, are in fact merely physically salient in the scene, rather than semantically important. This interpretation arises from work comparing changedetection rates to inverted or upright scenes in two different presentation styles (Shore & Klein, 2000). This interpretation would suggest that our data show that children and adults find the same items in a scene physically salient, but not necessarily semantically important. Interestingly, during the current experiment children of all ages often reported being able to sense that a change was occurring, although participants failed to pin-point exactly what was changing. This effect, termed ‘mindsight’, has also been identified in adults (Rensink, 2004). This finding supports the proposal by O’Regan (2001) that natural viewing makes a distinction between a transient signal, providing information that a change is occurring, and internal representations, providing information on what is changing. The presence of mindsight in children therefore implies that, although they may not have the change-detection skills of adults, they are adopting the same systems for detecting change. Change-detection abilities found here and elsewhere (Shore et al., 2006; Joseph et al., 2004) parallel young children’s developing attentional abilities (Trick & Enns, 1998) and executive functions (Zelazo & Muller, 2002). However, change-blindness findings alone cannot establish whether an underlying mechanism of visual attention and scene perception is developing with age or whether performance differences may be explained by other factors relevant to the task. Future research on visual attention and perception will be useful for the study of the developmental course of change blindness, for example in discovering which visual, executive or attentional skills contribute most to the improvements in change detection with age. In addition, change-detection abilities can be used as an investigative tool, for instance to track © 2009 The Authors. Journal compilation © 2009 Blackwell Publishing Ltd.
445
developmental variations in attention (Tse, 2004) or to compare typically and atypically developing groups (e.g. Fletcher-Watson, Leekam, Turner & Moxon, 2006). In conclusion, the findings reported in this study show that 6–12-year-old children use the same attentional priorities as adults when viewing a naturalistic scene. Like adults, they are sensitive to the effects of the semantic importance of a changing item in the scene. However, change detection does improve across this age range. The ability to detect changes is more efficient and accurate for older children, but by the age of 11 children have practically reached adult level, and it is likely that after this age there is little or no further improvement, at least when viewing naturalistic scenes.
References Ahissar, M., & Hochstein, S. (2004). The reverse hierarchy theory of visual perceptual learning. Trends in Cognitive Sciences, 8, 457–463. Fletcher-Watson, S., Leekam, S.R., Turner, M.A, & Moxon, L. (2006). Do people with autistic spectrum disorders show normal selection for attention? Evidence from change blindness. British Journal of Psychology, 97 (4), 537–554. Ishihara, S. (1971). Tests for colour-blindness. Tokyo: Kanehara Shuppan. Joseph, S., Burack, J., Shore, D., & Enns, J. (2004). Similar patterns of change detection between children with autism and typically developing children. PhD thesis, McGill University. O’Regan, J.K. (2001). Thoughts on change blindness. In L.R. Harris & M. Jenkin (Eds.), Vision and Attention (pp. 281– 302). New York: Springer. Rensink, R.A. (2004). Visual sensing without seeing. Psychological Science, 15 (1), 27–32. Rensink, R.A., O’Regan, J.K., & Clark, J.J. (1997). To see or not to see: the need for attention to perceive changes in scenes. Psychological Science, 8, 368–373. Shore, D.I., & Klein, R.M. (2000). The effects of scene inversion on change blindness. The Journal of General Psychology, 127 (1), 27–43 Shore, D.I., Burack, J.A., Miller, D., Joseph, S., & Enns, J.T. (2006). The development of change detection. Developmental Science, 9 (5), 490–497 Simons, D.J. (2000). Current approaches to change blindness. Visual Cognition, 7 (1/2/3), 1–15. Trick, L.M., & Enns, J.T. (1998). Lifespan changes in attention: the visual search task. Cognitive Development, 13, 369–386. Tse, P.U. (2004). Mapping visual attention with change blindness: new directions for a new method. Cognitive Science, 28, 241–258. Wener, S., & Thies, B. (2000). Is ‘change blindness’ attenuated by domain-specific expertise? An expert–novice comparison of change detection in football images. Visual Cognition, 7 (1/2/3), 163–173 Zelazo, P.D., & Muller, U. (2002). Executive function in typical and atypical development. In U. Goswami (Ed.), Handbook of childhood cognitive development (pp. 445–469). Oxford: Blackwell. Received: 6 June 2007 Accepted: 11 April 2008