Behavior and Social Issues, 13, 69-81 (2004). © Mitchalina Kenney, Chris Ninness, Robin Rumph, and Anna Bradfield. Readers of this article may copy it without the copyright owner’s permission, if the author and publisher are acknowledged in the copy and the copy is used for educational, not-forprofit purposes.
PARADOXICAL PATTERNS IN THE MEASUREMENT OF HYPERACTIVITY1 Mitchalina Kenney, Chris Ninness, Robin Rumph, and Anna Bradfield2 Stephen F. Austin State University Holly Cost University of Montavallo
ABSTRACT: The use of rating scales rather than direct observation procedures to identify various behavior problems is a popular trend in the public school system. We compared a popular rating scale with a direct observation system to measure “hyperactive behaviors” in a classroom setting. The subjects were 30 seventh grade students chosen at random from heterogeneously grouped students at a public middle school. A Pearson product-moment correlation was used to determine the magnitude and direction of the correlation between the data obtained by way of direct observations and the rating scale. Reliability coefficients were obtained, and a regression equation and coefficient of determination were calculated. A statistically significant but relatively low correlation was obtained between behaviors recorded by way of the direct observation instrument and the behavior rating scale. Interestingly, a strong negative correlation was found between the level of hyperactivity obtained on the rating scale and the rating scale reliability coefficients.
Behavior analysts who work in the public school system are under increasing pressure to employ rating (Likert) scales in their assessment strategies. In fact, behavior rating scales have become one of the most popular types of assessment instruments in determining the extent and frequency of a wide range of maladaptive behaviors exhibited by children (Achenbach & Edelbrock, 1983; Gresham, & Elliot 1990; Quay & Peterson, 1983; Shaywitz & Shaywitz, 1988; Sparrow, Balla & Cicchetti, 1984). Most of these instruments were developed with the intention of employing them at various times during the school semester to summarize informal observations of problem behaviors (e.g., Katz, Kellerman, & Siegel, 1980). McConaughy and Ritter (1995) have praised the use of rating scales as a “best practice” in the assessment of emotional and behavioral disorders. In fact, many academic reviewers and professionals have pointed to the advantages of the time-efficient, low-effort simplicity of these instruments, (Barkley, 1987; 1
This paper was originally published in Volume 12; due to a production error, however, one figure was missing, and another printed twice. These errors are corrected in this version. 2 This research was conducted as part of a thesis submitted in partial fulfillment of the requirements for the M.A. degree in School Psychology at Stephen F. Austin State University, 2000. Correspondence concerning this article should be addressed to Chris Ninness, School & Behavioral Psychology Program, Stephen F. Austin State University, Nacogdoches, TX, 75965. (
[email protected]).
69
KENNEY ET AL.
Knoff, 1995; Ross & Ross, 1982; Whalen & Henker, 1976). Rating scales have been used to describe and quantify a wide range of problem behaviors including the characteristics representing Attention Deficit Hyperactivity Disorder (McCarney 1995), and it has been reported that the consensus of agreement among raters gets stronger as more profiles on student hyperactivity are performed (see Hinshaw, 1987, for a discussion). Irrespective of the types of behaviors under consideration, rating scales remain one of the most frequently employed tools in the psychologist’s, diagnostician’s, counselor’s, and teacher’s assessment armamentarium (Lahey et al., 1988). Nevertheless, Sattler (1992) points out that rating scales may not correspond with data obtained by way of direct observations. He suggests that the internal consistency and interrater reliability are important features of behavior rating scales, and he has concerns about the adequacy of these measures. Sattler is not alone in his concern; Quay and Peterson (1987) looked at the Revised Behavior Problem Checklist and found that several studies demonstrated a general lack of interrater agreement between the ratings of teachers with parents and teachers with other teachers (cf. Simpson, 1989-1990; Simpson, 1991). Likewise, Elliot, Busse, and Gresham (1993) forwarded the notion that while interrater reliability is a desirable psychometric quality for rating scales, it may be difficult to establish. The Behavior Assessment System for Children (BASC) is one example of a popular rating scale. The BASC manual (1998) reports three types of reliability data for its Teacher Rating Scales: test-retest, interrater and internal consistency. Interrater reliabilities for the Preschool Level Hyperactivity Scale are reported to be at 0.81; however, these reliability measures are obtained by correction estimates based on statistical strategies for interpolating reliability coefficients. Such “estimating procedures” are employed when the original data are severely restricted in range (Guilford, 1954). These procedures allow the researcher to anticipate how high a test’s interrater correlation might be if more adequate data were obtained. Prior to statistical correction, the interrater reliability coefficient for the four pairs of raters on the preschool hyperactivity subscale was .52; however, the “correction formula” raised this to .81. The validity of this procedure requires fulfilling the critical assumptions of linearity and homoscedasticity, but the BASC manual provides no evidence that these assumptions have been addressed. Indeed, the BASC manual indicates that the published interrater reliabilities, “may be somewhat inflated, because they result from correction of extreme restriction of range in the raw data” (p. 104). An alternative (or complementary) system for collecting reliable information on a wide range of student behaviors in natural settings is direct observation in real time. Rather than rating problem behaviors post hoc, persons making direct observations simply record and graph the frequency, magnitude, duration, or latency of target behaviors as they occur in real time (Salvia & Ysseldyke, 1995). Historically, direct observation and recording has been viewed by behavioral school psychologists as a sensitive and reliable system for measuring a wide range of classroom behaviors (e.g., Alessi & Kaye, 1983). Independent of the specific direct observation format, it is unusual for published studies in applied behavior
70
PARADOXICAL PATTERNS IN MEASUREMENT
analysis to obtain over-all interrater reliabilities below .80 (Ninness, Glenn, & Ellis, 1993). Several current direct observation systems have been computerized to facilitate recording target behavior and generating graphic representations of problem behaviors within specific environmental conditions, (e.g., Braaten & Merbler, 1998; Martin, 1993; Ninness, McCuller, & Ozene, 1999). Many of these systems allow observers to conduct functional assessments in conjunction with direct observations. To the extent that maladaptive behaviors can be systematically identified as occurring at higher probability within particular contexts, such direct observation systems constitute one type of functional assessment (e.g., Broussard & Northup, 1995, 1997; Cooper, Wacker, Sasso, Reimers, & Donn, 1992; Dunlap, Kern-Dumlap, Clarke, & Robbins, 1991; Horner, 1994). The goal of functional/ descriptive assessments is to reliably identify particular conditions that interact with and sustain maladaptive behaviors (Iwata, Dorsey, Slifer, Bauman, & Richman, 1982). Accessing this information by direct observation allows school personnel to develop treatment plans for specific maladaptive behaviors (see Broussard & Northup, 1995, 1997, for a discussion). Regardless of which instruments are employed, it is frequently suggested that there is a distinct advantage to obtaining more information about the identification of problem behaviors in terms of the “perceptions and attitudes” of observers, children’s characteristics, setting or situational demands, and constraints (e.g., Keogh & Bernheimer, 1998). It has been recommended that a multimethod approach be used when evaluating children’s behavior (Achenbach, McConaughy, & Howell, 1987). Yet, “the most popular method of behavioral assessment is currently the behavior rating scale to be completed by parents or teachers” (Lett & Kamphaus, 1992, p. 3), and these scales are most often employed to the exclusion of direct observation systems. The use of rating scales, independent of direct observations of student behavior, may not provide an adequately reliable measure of a student’s problem behavior. Due to the impact that rating scales have on the lives of children, it is essential to know how rating scale outcomes compare with direct observation of behaviors as they occur in real time. Unfortunately, rating scales to the exclusion of direct observations are becoming one of the more common sources of evidence used in determining if a student should be labeled as emotionally disturbed or diagnosed as hyperactive (see Ninness, McCuller, and Ozenne, 2000, for a discussion). The consequences are profound. At stake is the prospect of a student’s immediate placement in a more restrictive environment and/or treatment with various medications. Clearly, rating scales are less labor intensive than direct observations. And, the growing acceptance of these instruments in the measurement of problem behaviors many expedite the work of many school psychologists, counselors, and diagnosticians. But it may be unwise to allow our children’s academic placement and/or medical treatment to be expedited by bureaucratic and procedural demands. Presently, however, there is insufficient evidence to support this perspective. The following study correlated measures of hyperactivity obtained by way of a rating scale and a direct observation system. Reliability data were collected for
71
KENNEY ET AL.
both systems. If the rating scale and direct observation outcomes correspond and both are found to be reliable, school psychologist, diagnosticians, counselors, and teachers can employ whichever instrument is suited to their orientation and the student needs. On the other hand, if they do not correspond and if one instrument is found to be more or less reliable than the other, the diagnostic personnel might be advised to reconsider their assessment options. The following study correlated measures of hyperactivity obtained by way of a rating scale and a direct observation system. Reliability data were collected for both systems. METHOD Participants, Setting, and Apparatus Following informed consent from students and parents, 30 seventh-grade students from a middle school served as participants. All observations were conducted in the students’ regular classrooms during regular school hours. Student participants were selected at random from 130 heterogeneously grouped students after signed consent was obtained. The BASC is a behavior rating system that consists of two rating scales (parent and teacher) of children’s observable behavior, a self-report personality inventory, a structured developmental history, and a student observation system. The teacher rating scales consist of 131 items and are available for three age levels including preschool (4-5), child (6-11), and adolescent (12-18). The BASC contains the following five composite scales: Externalizing Problems, Internalizing Problems, School Problems, Other Problems, and Adaptive Skills. The Externalizing Problems subscale includes 26 items that are descriptive of “hyperactive” behavior patterns. However, not all of these items on the hyperactivity subscale relate to behaviors in the classroom context, and these were not included in the present analysis. Within the hyperactivity subscale, we selected 13 of 26 items that were most easily observed and that could be operationally defined for the classroom context. These items were answered by the teacher by circling one of four descriptors of the frequency of the targeted behavior. Functional Observation of Classrooms and Learners (FOCAL Point) is a computerized functional assessment program designed to facilitate direct observations of target behaviors in natural settings (Ninness, McCuller, & Ozenne, 2000). Rather than analogs, this type of functional/descriptive assessment relies exclusively on in vivo direct observations of target behaviors in natural settings. Using computer-interactive recording systems, target behaviors are recorded as they occur within particular classroom conditions. Graphs, showing the levels of target behavior that emerge under particular environmental conditions, can be developed by moving data to a spreadsheet. Design The first portion of the data analysis examined reliability coefficients obtained during direct observation with FOCAL Point and the BASC rating system. This
72
PARADOXICAL PATTERNS IN MEASUREMENT
was conducted by calculating occurrence, nonoccurrence, and overall reliability for 25 of the 90 observations. The second portion of analysis addressed the correlation and regressions when comparing student hyperactivity as measured on the BASC and as obtained via direct observation with FOCAL Point software. Pearson correlations between teacher ratings were conducted. Finally, a review of the association between the teacher ratings of student hyperactivity and reliability measures was obtained on the BASC. Procedure Thirty seventh-grade students were selected at random for the study. Two of their teachers were asked to rate each child’s behavior using the 13 of the 26 questions from the BASC Hyperactivity subscale. Other items on the Hyperactivity scale (e.g., “touches everything while shopping”) or on the Attention Problems scale (e.g., “listens to directions”) were judged to be too obscure in meaning or to occur too rarely in the classroom context to be included in an operational definition of hyperactive behavior for direct observation in the classrooms of this middle school population. Prior to BASC data collection, the researcher consulted with the teachers regarding the purpose of the study and its requirements. After the partial Hyperactivity Subscale was completed on the BASC, the data were entered into the BASC computer-scoring program. Each student had two BASC rating scales completed by two separate teachers who had the student in their class for at least 90 minutes per day. To obtain inter-rater reliabilities, one teacher was designated as primary and the other as secondary. Each teacher was asked to respond to the 13 items relating to hyperactivity as exhibited in the classroom context. The teacher responded by circling “never,” “sometimes,” “often” or “almost always” to each question. These were scored and totaled across the 13 relevant items on the hyperactivity scale. Once completed, the examiner entered the answers into the BASC computer scoring system for results reported in the form of a standard score. Interrater reliability coefficients were calculated between the two teachers’ ratings. Direct observation data were collected by the first author and two observers who were trained in direct observation and recording procedures using FOCAL Point software. All students were observed from an unobtrusive location in the classroom, and behavioral data were recorded using portable laptop computers. Teachers were instructed to answer any questions regarding the observers with the statement of, “She is experimenting with a new computer program for the school district.” One-third of the classroom observations were scored for reliability. In order to maintain consistency between instruments, the same target behaviors identified on the BASC as hyperactive were incorporated into the operational definition of hyperactive behavior/s for direct observation. Behaviors were only identified as hyperactive if they included activities that were likely to be identified in the classroom context. The observer(s) recorded these targeted behaviors as having
73
KENNEY ET AL.
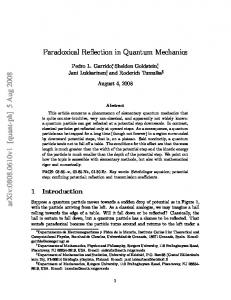
occurred if they conspicuously interfered with the student staying on task on an interval-by-interval basis (30-s partial-interval recordings). For direct observations on FOCAL Point, observers completed three, 15-min partial-interval observations for each student within one week. These were collected in the students’ classroom settings with no series observations being conducted in any one classroom. An overall reliability coefficient was calculated by tallying the number of intervals in which both observers agreed that the targeted behavior did or did not occur. This value was divided by the total number of intervals and multiplied by one hundred to obtain a reliability coefficient percentage. Interobserver agreement was calculated for 28 percent of the observations made. Following data collection, correlations between direct observations made with FOCAL Point and ratings made with the BASC were graphed via Microsoft Excel®, and statistical calculations were conducted via www.lcsdg.com/psychStats on-line statistical software (Ninness, 1999). RESULTS Using the direct observation system, high to moderate interobserver reliability measures were obtained for the 25 reliability sessions. Mean interobserver agreements were: overall, 98%; nonoccurrence, 97.9%; and occurrence, 72.6%. The mean reliability coefficient based on independent teacher ratings on the BASC was calculated at .53. A Pearson product-moment correlation between direct observations data and ratings scale data yielded a positive coefficient of 0.389. Figure 1 shows that for those students exhibiting little or no hyperactive behavior during observation, strong correspondence exists between the ratings from their teachers and the observations made in the classrooms. Conversely, when high to moderate rates of hyperactivity were recorded on either instrument, a large degree of scatter appears along the regression line. Data in Figure 1 suggests a tendency for directly observed hyperactivity levels to increase in conjunction with teacher ratings on the x-axis, yet the data are widely scattered throughout most of the upper and right quadrants of the scatterplot. This part of the graph represents the most critical area of association between high teacher ratings of student over-activity and high levels of hyperactive behavior identified during direct observations. It is in this part of the graph that the data show the most inconsistency between overt student hyperactivity and teacher ratings of that target behavior. Figure 1 also shows the least squares regression line as it passes through the data according to the derived linear equation, Y = 0.463X – 4.285. The standard error of the slope was found to be .207. In order to test the null hypothesis that the true slope is zero, we calculated the ratio of the obtained slope to its standard error. This provided a t-test statistic of 0.463/.207 = 2.23 showing statistical significance (P = .034). Thus, the coefficient for the BASC rating scale is significantly different from zero, and this provides some evidence that BASC outcomes are related to overt behavior as measured through direct observations; nonetheless, the confi-
74
PARADOXICAL PATTERNS IN MEASUREMENT
Figure 1. Correlation between teacher ratings and direct observations of student hyperactivity.
Figure 2. Correlation between levels of teacher agreement and levels of hyperactivity identified on the BASC.
75
KENNEY ET AL.
dence interval around the slope is very wide. Specifically, 95% of the time the true slope will lie somewhere between .038 and .887. The coefficient of determination, .151, shows that only about 15% of the variation in overt hyperactivity can be “explained” by teacher ratings on the BASC. Thus, even though the association between ratings and behavior could not have occurred simply by chance, it only accounts for a very small portion of the behavior change one might observe during direct observations of these students. Figure 2 displays a paradoxical pattern between increased teacher ratings of hyperactivity as measured by the BASC and BASC reliability coefficients. Ironically, our outcomes suggest that BASC reliabilities dropped with increasing levels of identified problem behaviors. Specifically, a negative correlation of -.682 was found between the number of problem behaviors observed and the interrater reliability of the teachers (P = .00001). The X-axis shows student hyperactivity as rated by the primary teacher using the BASC. The Y-axis shows the percent of agreement (inter-rater reliabilities) between teachers who scored these students regarding their in-class behavior. This data suggests that when teachers rated individual students as being relatively ontask and appropriate, near perfect agreement was obtained. Paradoxically, for students rated as showing higher levels of hyperactivity, inter-rater reliabilities between teachers dropped to near zero. Clearly, at the mid to upper levels of scale these teachers had drastically different interpretations of the same student’s behavior. The over-all distribution shows a negative correlation between magnitude of student hyperactivity and level of agreement between teachers who rated these students. As noted above, the mean reliability coefficient based on independent teacher ratings on the BASC was calculated at .53; however, it has been pointed out that the more categories that exist in a rating scale, the more difficult it is to obtain high percentages of reliability (Sattler, 1992). Moreover, this type of agreement does not take into account the possibility that different raters may show similar patterns but different absolute scoring outcomes when rating a particular individual’s behavior. Thus, Sattler recommends the use of Pearson correlations to identify patterns of agreements among observers. Figure 3 displays the Pearson correlation between separate teachers on BASC items that rate “hyperactive” behavior of students in the classroom setting. In this study, two teachers were asked to rate each child’s behavior using 13 of the 26 questions from the BASC Hyperactivity subscale. The Pearson product-moment correlation between separate teachers ratings of the same students yielded a positive coefficient of 0.4758. Figure 3 shows the same scatter of data points within Figure1. The data indicates that for those students rated as showing little or no hyperactive behavior, strong correspondence existed between the teacher ratings on the BASC, but when teachers indicated high to moderate ratings of student hyperactivity, a large degree of scatter emerged along the regression line. As in Figure 1, it is in this part of the graph that the data show the most inconsistency between teacher ratings of the students’ behavior.
76
PARADOXICAL PATTERNS IN MEASUREMENT
Figure 3. Correlation between two sets of teachers on items referencing in-class hyperactivity. DISCUSSION The purpose of the present study was to obtain reliabilities and analyze the relationship between teacher ratings of student hyperactive behavior and direct observation of that behavior. These results indicate that direct observation and rating scales may provide very different interpretations of levels of student hyperactivity in a classroom. Irrespective of the type of interrater reliability system employed, rating scale reliabilities dropped with increasing levels of teacher identified hyperactive behaviors. There may be good reason to be skeptical of the projected reliabilities based on formulae that estimate how high reliability coefficients might be (Guilford, 1954). The BASC manual reports a “corrected” interrater reliability score of .81 on the hyperactivity scale in the preschool category; notwithstanding, prior to the “correction procedure,” the interrater reliability is .52. And, this value is the only calculated interrater reliability coefficient for the hyperactivity subscale. As noted above, it is based on four pairs of raters on the preschool hyperactivity subscale. Unfortunately, no normative data for adolescents was gathered or reported by the BASC manual to use as a comparison with the present study. The protocol from the present study used fewer items than the complete hyperactivity subscale on the BASC. In this study, only 13 items of 26 available items on the Hyperactivity Subscale were employed, and this undoubtedly biases any attempt to measure the instrument’s potential reliability across all items on the BASC. Then again, only 13 items on this subscale were the most specifically descriptive of the types of hyperactive behaviors (performed by adolescents) that could be seen by a teacher (or any direct observer) in a regular education
77
KENNEY ET AL.
classroom context. As previously noted, our data show a moderately low interrater agreement score of .53 and a Pearson correlation between teacher/raters of only 0.4758 for 13 of the 26 items on this section of the instrument. These reliabilities are fairly close to the BASC manual’s published reliability values of .52 (prior to applying the correction formula). More importantly, BASC reliabilities for these 13 items dropped with higher teacher ratings of student hyperactivity. A negative correlation of -.682 was obtained between the BASC hyperactivity scores and the interrater reliability of the teachers who rated these students. Figure 2 shows that when teachers rated individual students as being relatively on-task and appropriate, they demonstrated almost perfect agreement, yet with increasing levels of rated hyperactivity, the levels of agreement gradually dropped to near zero and ultimately generated a negative correlation between magnitude of student hyperactivity and level of agreement between teachers who rated the students’ behavior. This negative correlation of -.682 suggests that high hyperactive ratings on the BASC Hyperactivity Subscale are associated with lower rating scale reliabilities. Here, we see a pattern in which higher ratings of problem behavior are inversely correlated with the reliability of that scale. In short, the more hyperactivity that is identified via the rating scale, the less reliable the scale becomes. Such factors should lead professionals and applied researchers to question the use of behavior rating scales in lieu of real-time direct observations formats. Our outcomes do not represent an indictment of the BASC rating scales (or rating scales in general) nor do they provide any special commendation for FOCAL Point direct observation software. Any number of current (e.g., Braaten & Merbler, 1998; Martin, 1993) or time-tested (Alessi & Kaye, 1983) direct observation systems would undoubtedly prove just as reliable if not more so. However, these outcomes do question the all too pervasive practice of relying on rating scale instruments as the primary “observation format” for identifying specific problem behavior/s. The fact that the BASC Monitor (1998) now incorporates a time-sampling observation of student behavior in conjunction with collection of teacher and parent ratings testifies to the growing appreciation of this best practice. However, even when other psychological assessment strategies are incorporated (e.g., parent ratings, direct observations, self-assessments, or other variables), face validity and social validity require that we empirically demonstrate interrater reliability on our primary data and that these data show some relative consistency among and across consecutive observation sessions (cf. Alessi & Kaye, 1983). Perhaps, forthcoming reliability measures on the newly developed BASC Monitor will reveal more compelling information on interrater reliabilities. Still, as of out last viewing, the interrater reliability coefficients for this instrument are not reported on the BASC web site. As a caveat, the teachers clearly had more opportunities to observe than the briefer periods of time researchers were scoring. The teachers saw these students in their respective classrooms over a much longer period of time. Rating scales are sensitive to such issues while most direct observation strategies are not. In this sense, rating scales, like the BASC, play a critical role in the overall assessment of
78
PARADOXICAL PATTERNS IN MEASUREMENT
student behavior. Nonetheless, if it is true that a given student’s “level of hyperactivity” vacillates dramatically across various academic settings, this mitigates the value of diagnosing hyperactivity as a medical/psychological condition and provides all the more reason for conducting direct observations and functional assessment in order to identify the particular conditions that interact with the student’s problem behavior/s. Independent of subscale or composite scale labels, the person charged with developing an intervention plan must accurately identify the variables that are associated with the student’s maladaptive behavior. This requires ascertaining the actual conditions under which the student is most likely to display various forms of the problem behavior, the conditions under which he/she is less unlikely to do so, and what the target behavior actually looks like when it occurs. Unless we can do more than classify problems into important-sounding categories, we may be unable to justify the time and expense of assessment. And, unless we can reliably identify how these and other variables interact with the students’ behavior, we will be unlikely to provide useful behavior intervention plans. Although rating scales are an important source of information regarding student/client behavior, they may represent an insufficient strategy for identifying many types of problem behavior/s as they occur across and within specific contexts. When an individual is referred for assessment based on his/her overactive behavior in the classroom, we may find that teachers give high ratings to descriptive statements such as: interferes with the work of others, or hurries through academic tasks, etc. This may result in the referred student scoring high on a hyperactivity subscale, but it may not provide an improved understanding of the variables that interact with the referred student’s problem behavior. Moreover, as in the diagnosing of many types of “behavior disorders” simply determining that a student behaves hyperactively because he/she “is hyperactive” obscures any functional analysis of the variables that interact with the student’s problem behavior by reifying a somewhat unreliable if increasingly popular diagnostic descriptor (Ninness, McCuller, & Ninness, 1999). REFERENCES Alessi, G. I., & Kaye, J. H. (1983). Behavioral assessment for school psychologists. Stratford, CT: NASP Publications. Achenbach, T. M., & Edelbrock, C. S. (1983). Manual for the Child Behavior Checklist & Revised Child Profiles. New York: Queen City Publishers. Achenbach, T.M., McConaughy, S. H., & Howell, C. T. (1987). Child/adolescent behavioral and emotional problems: Implications of cross-informant correlations for situational specificity. Psychological Bulletin, 101, 213-232. Barkley, R. A. (1987). Defiant children: A clinician’s manual for parent training. New York: Guilford. Braaten, S., & Merbler, J.B. (1998). Behavioral Objective Sequence Software [Computer Software]. Champaign, IL: Research Press. Broussard, C., & Northup, J. (1995). An approach to functional assessment and analysis of disruptive behavior in regular education classrooms. School Psychology Quarterly, 10, 151-164.
79
KENNEY ET AL.
Broussard, C., & Northup, J. (1997). The use of functional analysis to develop peer interventions for disruptive classroom behavior. School Psychology Quarterly, 12, 6576. Cooper, L.J., Wacker, D.P., Sasso, G., Reimers, T.M., & Donn, L.K. (1990). Using parents as therapists to evaluate appropriate behavior of their children: Application to a tertiary diagnostic clinic. Journal of Applied Behavior Analysis, 23, 283-296. Dunlap, G., Kern-Dunlap, L., Clarke, S., & Robbins, F.R. (1991). Functional assessment, curricular revision, & severe behavior problems. Journal of Applied Behavior Analysis, 24, 387-397. Elliot, S.N., Busse, R.T., & Gresham, F.M. (1993). Behavior rating scales: Issues of use and development. School Psychology Review, 22, 313-320. Gresham, F. & Elliot, S. (1990). Social Skills Rating System Manual. Circle Pines, MN: American Guidance Service, Inc. Guilford, J.P. (1954). Psychometric methods. New York: McGraw-Hill Book Company. Hinshaw, S. P. (1987). On the distinction between attentional deficits/hyperactivity and conduct problems/aggression in child psychology. Psychological Bulletin, 101, 443463. Horner, R. H. (1994). Functional assessment: Contributions and future directions. Journal of Applied Behavior Analysis, 27, 401-404. Iwata, B. A., Dorsey, M. F., Slifer, K. J., Bauman, D. E., Richman, G. S. (1994). Toward a functional analysis of self-injury. Journal of Applied Behavior Analysis, 5, 197-209. (Reprinted from Analysis and Intervention in Developmental Disabilities, 2, 3-20, 1982). Katz, E.R., Kellerman, J., & Siegel, S.E. (1980). Behavioral distress in children with cancer undergoing medical procedures: Developmental considerations. Journal of Consulting & Clinical Psychology, 48, 356-365. Keogh, B. K., & Bernheimer, L. P. (1998). Concordance between mothers’ and teachers’ perceptions of behavior problems of children with developmental delays. Journal of Emotional and Behavioral Disorders, 6, 33-41. Knoff, H.M. (1995). Best practices in personality asessment. In A. Thomas & J. Grimes (Eds.), Best practices in school psychology-III (pp. 849-864). Washington, DC: National Association of School Psychologists. Lahey, B.B., Pelham, W. E., Schaughency, E. A., Atkins, M.S., Murphy, A., Hynd, G.W., Russo, M., Hartdagan, S., & Lorys-Vernon, A. (1988). Dimensions and types of attention deficit disorder. Journal of the American Academy of Child and Adolescent Pssychiatry, 27, 330-335. Lett, N.J., & Kamphaus, R.W. (1992, August). Validity of the BASC teacher rating scale by the BASC student observation scale. Paper presented at the annual meeting of the American Psychological Association, Washington, DC. Martin, S. (1993). !OBSERVE FAST [Computer Software]. Denton, TX: Psychsoft, Inc. McCarney, S.B. (1995). The Attention Deficit Disorders Evaluation Scale. Columbia, MO: Hawthorne Press. McConaughy, S.H., & Ritter, D.R. (1995). Best practices in multidimensional assessment of emotional or behavioral disorders, Best practices in school psychology-III (pp. 865-877). Washington, DC: National Association of School Psychologists. Ninness, H. A. C., McCuller, G. & Ninness, S. K. (1999). The functional analysis in behavioral and school psychology: Toward a four-term contingency. In D.A. Sadatino & B.L. Brooks (Eds.), Contemporary interdisciplinary interventions for children with emotional/behavioral disorders (pp. 505-531). Durham NC: Carolina Academic Press.
80
PARADOXICAL PATTERNS IN MEASUREMENT
Ninness, H. A. C., Glenn, S., & Ellis, J. (1993) Assessment in treatment of emotional or behavioral disorders. Westport, CT: Prager Publishers. Ninness, H. A. C., McCuller, G., & Ozenne, L. (2000). Behavioral school psychology: Applied research in human-computer interactive, functional assessment, and treatment. Norwell, MA: Kluwer Academic Publishers. Ninness, H. A. C. (1999). www.lcsdg.com/psychStats (Computer software). Nacogdoches, TX: LCS Development Group, LLC. Quay, H.C., & Peterson, D.R. (1983). Interim manual of the Revised Behavior Problem Checklist. Miami, FL: Authors. Quay, H.C., & Peterson, D.R. (1987). Manual for the Revised Behavior Problem Checklist. Odessa, FL: PAR, Inc. Reynolds, C.R. & Kamphaus, R.W. (1998). Behavior Assessment System for Children. Circle Pines, MN: American Guidance Service. Ross, D. M., & Ross, S.A. (1982). Hyperactivity: Current issues, research, and theory (2nd ed.). New York: John Wiley. Salvia, J., & Ysseldyke, J. E., (1995). Assessment (6th ed). Boston Houghton Mifflin Sattler, J.M. (1992). Assessment of Children (3rd ed.). San Diego, CA: Jerome M. Sattler, Publisher, Inc. Shaywitz, S.E., & Shaywtz, B.A. (1988). Attention deficit disorder: Current perspectives. In J. F. Kavanagh & T. J. Truss (Eds.), Learning disabilities: Proceedings of the national conference. Parkton, MK: York. Simpson, R. (1989-1990). Review of the Revised Behavior Problem Checklist. Diagnostique, 15, 161-173. Simpson, R. (1991). Agreement among teachers using the Behavior Problem Checklist to identify deviant behavior. Behavioral Disorders, 17, 66-71. Sparrow, S.S., Balla, D.A., & Cicchetti, D.V. (1984). Vineland Adaptive Behavior Scales. Circle Pines, MN: American Guidance Service. Whalen, C. K., & Henker, B (Eds.). (1976). Hyperactive children: The social ecology of identification and treatment. New York: Academic Press.
81