PARALLEL COMPUTING OF OVERSET GRIDS FOR AERODYNAMIC PROBLEMS WITH MOVING OBJECTS
20000608 099 By NATHAN C. PREWITT
DISTRIBUTION STATEMENT A Approved for Public Release Distribution Unlimited
A DISSERTATION PRESENTED TO THE GRADUATE SCHOOL OF THE UNIVERSITY OF FLORIDA IN PARTIAL FULFILLMENT OF THE REQUIREMENTS FOR THE DEGREE OF DOCTOR OF PHILOSOPHY UNIVERSITY OF FLORIDA 1999
DTXC QUALITY BJSK3CTED 4
REPORT DOCUMENTATION PAGE
18
AFRL-SR-BL-TR-00-
I data sources, ■ aspect of this 1215 Jefferson 20503.
Public reporting burden for this collection of information is estimated to average 1 hour per respon gathering and maintaining the data needed, and completing and reviewing the collection of informi collection of information, including suggestions for reducing this burden, to Washington Headquart Davis Highway, Suite 1204, Arlington, VA 22202-4302, and to the Office of Management and Bm
1. AGENCY USE ONLY (Leave blank)
2. REPORT DATE
REPORT TYPE AND DA I to
1999
Final Technical Report
1 Aug 95 to 31 Jul 99
5. FUNDING NUMBERS
4. TITLE AND SUBTITLE
Parallel Computing of Overset Grids for Aerodynmaic Problems with Moving Objects
F49620-c")?-j'00i-l^
6. AUTHOR(S)
Nancy C. Prewitt
7. PERFORMING ORGANIZATION NAME(S) AND ADDRESS(ES)
University of Florida Department of Aerospace Engineering, Mechanics & Engineering Science 231 Aerospace Bldg Gainesville, FL 32611-6250 9. SPONSORING/MONITORING AGENCY NAME(S) AND ADDRESS(ES)
AFOSR/NM 801 N. Randolph St, Rm 732 Arlington, VA 22203-1977
8. PERFORMING ORGANIZATION REPORT NUMBER
10. SPONSORING/MONITORING AGENCY REPORT NUMBER
F49620-9£-/^a^2-
11. SUPPLEMENTARY NOTES
12a. DISTRIBUTION AVAILABILITY STATEMENT
12b. DISTRIBLITION CODE
Approved for public release; distribution unlimited.
13. ABSTRACT (Maximum 200 words)^ ^
When a store is dropped from a military aircraft at high subsonic, transonic, or supersonic speeds, the aerodynamic forces and moments acting on the store can be sufficient to send the store back into contact with the aircraft. This can cause damage to the aircraft anderidanger the life of the crew. Therefore, store separation analysis is used to certify the safety of any proposed drop. This analysis is often based on wind tunnel aerodynamic data or analogy with flight test data from similar configurations. Time accurate computational fluid dynamics (CFD) offers the option of calculating store separation trajectories from first principles. In the Chimera grid scheme a set of independent, overlapping, structured grids are used to decompose the domain of interest. This allows the use of efficient struc-tured grid flow solvers and associated boundary conditions, and allows for grid motion without stretching or regridding. However, these advantages are gained in exchange for the requirement to establish communication links between the overlapping grids via a process referred to as "grid assembly."
15. NUMBER OF PAGES
14. SUBJECT TERMS
16. PRICE CODE 17. SECURITY CLASSIFICATION OF REPORT
UNCLASSIFIED
18. SECURITY CLASSIFICATION OF THIS PAGE
UNCLASSIFIED
19. SECURITY CLASSIFICATION 20. LIMITATION OF ABSTRACT OF ABSTRACT
UNCLASSIFIED
UL Standard Form 298 (Rev. 2-89) (EG)
Prescribed by ANSI Std. 239.18 _ „ „. Designed using Perform Pro, WHS/DIOR, Oct 94
Happy is the man that findeth wisdom, and the man that getteth understanding. Proverbs 3:13
v?gg%?0^'%
ACKNOWLEDGEMENT Where no counsel is, the people fall: but in the multitude of counselors there is safety. Proverbs 11:14 That said, I would like to thank my counselors. Dr. Wei Shyy has been an excellent advisor, always enthusiastic and willing to help in anyway possible. Likewise, Dr. Davy Belk has always been encouraging and supportive of my work. I am glad to be able to count them both as friends, as well as mentors. I would also like to thank the rest of my committee, Dr. Bruce Carroll, Dr. Chen Chi Hsu, and Dr. B. C. Vemuri. They have all been my allies. I also want to thank Dr Milton, who was the head of the GERC when I started this endeavor, and Dr Sforza, who is now head of the GERC, and whom I have gotten to know better through AIAA. And since I am mentioning the GERC, thanks go to Cathy and Judy. I must also thank Mr. Whitehead, who has been my manager and an excellent supporter (even if he is an Alabama fan), since I came to work for QuesTech and now CACI. And, let me not forget Dr. Darryl Thornton (it gets worse, he's an Ole Miss grad), who has been my department director for many years now. I have been very fortunate to receive funding from AFOSR. Without this funding and the time it allowed me away from my other task duties, I am sure that I would not have been able to complete my degree. I would like to thank everyone that helped to obtain this funding including Mr. Jim Brock and Maj. Mark Lutton of the Air Force Seek Eagle Office, and Mr. Dave Uhrig. To be nice and legal, support was provided in part by a grant of HPC time from the DoD HPC Distributed Center, U.S. Army Space and Strategic Defense Command,
iii
SGI Origin 2000. Additional support was provided by the Air Force Office of Scientific Research, Air Force Materiel Command, USAF, under grant number F499620-98-10092. The U.S. Government is authorized to reproduce and distribute reprints for Governmental purposes notwithstanding any copyright notation thereon. The views and conclusions contained herein are those of the author and should not be interpreted as necessarily representing the official policies or endorsements, either expressed or implied, of the Air Force Office of Scientific Research or the U.S. Government. I hope that my presentation clearly shows which part of this work is my own. The original development of the Beggar code, including the unique algorithms for grid assemly, was done by Dr. Davy Belk and Maj. Ray Maple. The original work done to parallelize the Beggar flow solver was done by Dr. Davy Belk and Mr. Doug Strasburg. I owe a large debt to these gentlemen. There are now two others that continue the development of Beggar. Dr. Ralph Noack has been a tremendous asset to our group and has been most helpful in my work. It is from Ralph that I learned of the latency issues associated with the Origin 2000 and Ralph is the author of the load balancing algorithm used to distribute the grids in order to load balance the flow solver. Dr. Magdi Rizk came to Eglin at the same time that I did and we have worked together since. Magdi has been the sole developer of the Beggar flow solver for several years and has made significant contributions in that area. Magdi has also been my teacher at the GERC and a great friend. I would like to thank my other friends and colleagues and hope they will accept this thank you en masse. Most importantly, I would like to thank my family. My in-laws have been very helpful (during births and hurricanes, pouring the patio and eating at Hideaway's) and have always been willing to take the wife and kids when I really needed to study (sometimes for weeks). My parents have always been supportive in innumerable ways, from driving for hours and then sitting in the car for hours at honor band tryouts, to attending MSU football games just to see the halftime show, to buying a house for us when Tracye and I got married in the middle of college, to doing my laundry iv
and fixing the brakes on the car over the weekend so I could get back to school. My brother Stephen has been a lot of help to my parents the last few years. Taking care of them is something that I don't think I could do. Jay and Josh are too much like me at times; but they are welcomed diversions and are stress relievers (our dog, Dudy Noble Polk, also fits into this category). And Tracye is a wonderful person. My roommate in college once said, "You are very lucky. You've found someone that you love, who is also a friend." She puts up with a lot. I am no picnic. We spent a lot of time apart during this, and I always get depressed whenever they are gone for a long time. Some of her bulldog friends, that she talks to over the internet, asked "How do you live with someone that is so positive all of the time?" "Who Tracye?", I replied. "No..., it's great!"
TABLE OF CONTENTS page ACKNOWLEDGEMENT
Hi
LIST OF TABLES
viii
LIST OF FIGURES
ix
ABSTRACT
xii
CHAPTERS 1
Introduction Overview Related Work Grid Assembly Store Separation Parallel Computing Dissertation Outline
1 1 7 7 9 14 16
2
Grid Assembly Polygonal Mapping Tree Interpolation Stencils Hole Cutting Donors and Receptors Boundary Condition Identification
18 19 22 25 26 27
3
Flow Solution Governing Equations Vector Form Non-Dimensionalization Coordinate Transformation Flux Vector Splitting Flux Difference Splitting Newton Relaxation Fixed-Point Iteration Parallel Considerations
28 28 33 35 37 40 45 47 48 50 VI
6DOF Integration Equations of Motion Coordinate Transformations Quaternions Numerical Integration
52
5
Parallel Programming Hardware Overview Software Overview Performance Load Balancing Proposed Approach
62 62 64 68 73 79
6
Parallel Implementations Phase I: Hybrid Parallel-Sequential Phase II: Function Overlapping Phase III: Coarse Grain Decomposition Phase rV: Fine Grain Decomposition Summary
81 81 83 88 92 97
4
52 54 57 60
• •
98
7
Test Problem
8
Results Phase I: Hybrid Parallel-Sequential Phase II: Function Overlapping Phase III: Coarse Grain Decomposition Phase rV": Fine Grain Decomposition Summary
106 108 113 121 132
Conclusions and Future Work
135
9
BIOGRAPHICAL SKETCH
106
145
Vll
LIST OF TABLES Table 1.1 1.2 1.3 1.4
page Grid assembly codes Store separation modeling methods Grid generation methods Significant accomplishments in parallel computing in relation to overset grid methods
8 10 12
6.1
Summary of the implementations of parallel grid assembly
97
7.1 7.2 7.3 7.4 7.5 7.6
Store physical properties Ejector properties Original grid dimensions Dimensions of split grids Load Imbalance Factors Summary of the final position of the stores calculated from the two different grid sets
8.1 8.2 8.3 8.4 8.5
Summary of results from the phase I runs including the final position of the bottom store Summary of results from the phase II runs including the final position of the outboard store Summary of results from the phase III runs including the final position of the inboard store Summary of results from the runs that used fine grain hole cutting including the final position of the bottom store Summary of best execution times (in minutes) from runs of the different implementations (number of FE processes shown in parentheses) . . .
vin
17
99 99 100 101 102 103 107 113 121 132 133
LIST OF FIGURES page
Figure 1.1 1.2 1.3 1.4 1.5
History of three store ripple release Solution process Example of overlapping grids with holes cut Grids for single generic store trajectory calculation Mach 0.95 single store trajectory calculated (left) CG position and (right) angular position versus wind tunnel CTS data . Mach 1.20 single store trajectory calculated (left) CG position and (right) angular position versus wind tunnel CTS data
1 4 5 13
2.1 2.2
Example quad tree mesh Example PM tree structure
21 22
4.1
Transformation from global to local coordinates
55
5.1 5.2 5.3
Unbalanced work load Limitations in load balance caused by a poor decomposition Imbalance caused by synchronization
71 72 73
6.1 6.2 6.3 6.4 6.5 6.6 6.7 6.8 6.9 6.10 6.11 6.12
Phase I implementation Comparison of estimated speedup of phase I to Amdahl's law Basic flow solution algorithm Phase II implementation Insufficient time to hide grid assembly Comparison of estimated speedup of phases I and II . Duplication of PM tree on each FE process Distribution of PM tree across the FE processes Phase III implementation Comparison of the estimated speedup of phases I, II, and III Phase rV implementation Comparison of estimated speedup of phases I, II, III and IV
82 83 85 86 87 88 90 91 92 93 95 96
7.1 7.2 7.3
Bottom store (left) CG and (right) angular positions Outboard store (left) CG and (right) angular positions Inboard store (left) CG and (right) angular positions
104 105 105
8.1
Actual speedup of phase I
107
1.6
ix
13 14
8.2 8.3 8.4 8.5 8.6 8.7 8.8 8.9 8.10 8.11 8.12
8.13 8.14
8.15 8.16
8.17
8.18
8.19
8.20
8.21 8.22 8.23
Bottom store (left) force coefficient and (right) moment coefficient variation between dt iterations history 108 Outboard store (left) force coefficient and (right) moment coefficient variation between dt iterations history 109 Inboard store (left) force coefficient and (right) moment coefficient variation between dt iterations history 109 Actual speedup of phase II Ill Effect of using average execution time 112 Actual speedup of phase III 114 History of grid assembly load imbalance based on execution times of hole cutting, stencil search, and health check 115 Grid assembly process 117 History of grid assembly load imbalance based on execution time of the stencil search 117 Grid assembly execution timings for four FE processes 118 Grid assembly execution timings of (left) hole cutting and (right) stencil searching with load balance based on measured execution time of stencil searching. Each curve represents a separate process 119 History of grid assembly load imbalance based on number of IGBP's . 120 Grid assembly execution timings of (left) hole cutting and (right) stencil searching with load balance based on number of IGBP's. Each curve represents a separate process 121 Speedup due to fine grain hole cutting and load balancing of hole cutting separate from the stencil search 123 Grid assembly execution timings of (left) hole cutting and (right) stencil searching with fine grain hole cutting and the stencil search load balanced based on execution time. Each curve represents a separate process 124 Grid assembly execution timings of (left) hole cutting and (right) stencil searching with fine grain hole cutting and the stencil search distributed across 5 FE processes. Each curve represents a separate process. 125 Grid assembly execution timings of (left) hole cutting and (right) stencil searching with fine grain hole cutting and the stencil search distributed across 6 FE processes. Each curve represents a separate process. 126 Grid assembly execution timings of (left) hole cutting and (right) stencil searching with fine grain hole cutting and the stencil search distributed across 7 FE processes. Each curve represents a separate process. 126 Grid assembly execution timings of (left) hole cutting and (right) stencil searching with fine grain hole cutting and the stencil search distributed across 8 FE processes. Each curve represents a separate process. 127 Use of additional processors continues to reduce time for hole cutting 128 Execution times for load balanced fine grain hole cutting distributed across 4 FE processes 129 Execution times for load balanced fine grain hole cutting distributed across 5 FE processes 130
8.24 Execution times for load balanced fine grain hole cutting distributed across 6 FE processes 8.25 Execution times for load balanced fine grain hole cutting distributed across 7 FE processes 8.26 Execution times for load balanced fine grain hole cutting distributed across 8 FE processes 8.27 Summary of the increasing speedup achieved through the different implementations
XI
130 131 131 134
Abstract of Dissertation Presented to the Graduate School of the University of Florida in Partial Fulfillment of the Requirements for the Degree of Doctor of Philosophy PARALLEL COMPUTING OF OVERSET GRIDS FOR AERODYNAMIC PROBLEMS WITH MOVING OBJECTS By Nathan C. Prewitt December 1999 Chairman: Dr. Wei Shyy Major Department: Department of Aerospace Engineering, Mechanics, and Engineering Science When a store is dropped from a military aircraft at high subsonic, transonic, or supersonic speeds, the aerodynamic forces and moments acting on the store can be sufficient to send the store back into contact with the aircraft. This can cause damage to the aircraft and endanger the life of the crew. Therefore, store separation analysis is used to certify the safety of any proposed drop. This analysis is often based on wind tunnel aerodynamic data or analogy with flight test data from similar configurations. Time accurate computational fluid dynamics (CFD) offers the option of calculating store separation trajectories from first principles. In the Chimera grid scheme, a set of independent, overlapping, structured grids are used to decompose the domain of interest. This allows the use of efficient structured grid flow solvers and associated boundary conditions, and allows for grid motion without stretching or regridding. However, these advantages are gained in exchange for the requirement to establish communication links between the overlapping grids via a process referred to as "grid assembly." xii
The calculation of a moving body problem, such as a store separation trajectory calculation, using the Chimera grid scheme, requires that the grid assembly be performed each time that a grid is moved. Considering the facts that time accurate CFD calculations are computationally expensive and that the grids may be moved hundreds of times throughout a complete trajectory calculation, a single store trajectory calculation requires significant computational resources. Parallel computing is used regularly to reduce the time required to get a CFD solution to steady state problems. However, relatively little work has been done to use parallel computing for time accurate, moving body problems. Thus, new techniques are presented for the parallel implementation of the assembly of overset, Chimera grids. This work is based on the grid assembly function defined in the Beggar code, currently under development at Eglin Air Force Base, FL. This code is targeted at the store separation problem and automates the grid assembly problem to a large extent, using a polygonal mapping (PM) tree data structure to identify point/volume relationships. A logical succession of incremental steps are presented in the parallel implementation of the grid assembly function. The parallel performance of each implementation is analyzed and equations are presented for estimating the parallel speedup. Each successive implementation attacks the weaknesses of the previous implementation in a effort to improve the parallel performance. The first implementation achieves the solution of moving body problems on multiple processors with minimum code changes. The second implementation improves the parallel performance by hiding the execution time of the grid assembly function behind the execution time of the flow solver. The third implementation uses coarse grain data decomposition to reduce the execution time of the grid assembly function. The final implementation demonstrates the fine grain decomposition of the grid assembly through the fine grain decomposition of the hole cutting process. Shared xm
memory techniques are used in the final implementation and appropriate dynamic load balancing algorithms are presented.
xiv
CHAPTER 1 INTRODUCTION
The knowledge of forces and moments induced by the addition of stores to an aircraft is vital for safe carriage. Once a store is released, knowledge of the interference aerodynamics and the effects on the trajectory of the store is vital for the safety of the pilot and aircraft. Such aerodynamic data has traditionally been provided by wind tunnel testing or flight testing; however, these techniques can be very expensive and have limitations when simulating time accurate, moving body problems such as the ripple release depicted in figure 1.1. Computational Fluid Dynamics (CFD) provides a way to supplement wind tunnel and flight test data.
Figure 1.1: History of three store ripple release
Overview The primary problem to be considered is store separation from fighter aircraft configurations. The goal is to compute store separation trajectories in a timely fashion
using CFD and parallel computing. Due to the geometric complexity of aircraft/store configurations and the requirement to handle moving body problems, the Chimera grid scheme [1] is being used. This approach uses a set of overlapping structured grids to decompose the domain of interest. The Chimera grid scheme offers several advantages: 1) the use of structured grids allows the use of efficient block structured grid flow solvers and the associated boundary conditions; 2) the generation of overlapping grids which best fit a particular component geometry eases the burden of structured grid generation; and 3) the use of interpolation for communication between overlapping grids allows grids to be moved relative to each other. However, the communication between overlapping grids must be reestablished whenever a grid is moved. This process of establishing communication between overlapping grids will be referred to as grid assembly. Whenever the grid around a physical object overlaps another grid, there is the probability that some grid points will lie inside the physical object and thus will be outside of the flow field. Even if no actual grid points lie inside the physical object, if a grid line crosses the physical object, there will be neighboring grid points that lie on opposite sides of the physical object. Any numerical stencil that uses two such neighboring grid points will introduce errors into the solution. This situation is avoided by cutting holes into any grids overlapping the physical surfaces of the geometry. During hole cutting, regions of the overlapping grids are marked as invalid. This creates additional boundaries within the grid system. The flow solver requires that some boundary condition be supplied at these boundaries. Likewise, some boundary condition is also needed at the outer boundaries of embedded grids. Collectively, the grid points on the fringe of the holes and the grid points on the outer boundaries of the embedded grids are referred to as Inter-Grid Boundary Points (IGBP's) [2]. The boundary conditions required at the IGBP's are supplied by interpolating the flow solution from any overlapping grids.
The Beggar code [3], developed at Eglin Air Force Base, is capable of soving three-dimensional inviscid and viscous flow ploblems involving multiple moving objects, and is suitable for simulating store separation. This code allows blocked, patched, and overlapping structured grids in a framework that includes grid assembly, flow solution, force and moment calculation, and the integration of the rigid body, six degrees of freedom (6D0F) equations of motion. All block-to-block connections, patched connections, freestream boundary conditions, singularity boundary conditions, and overlapped boundaries are detected automatically. All holes are defined using the solid boundaries as cutting surfaces and all required interpolation stencils are calculated automatically. The integration of all necessary functions simplifies the simulation of moving body problems [4]; while the automation and efficient implementation of the grid assembly process [5] significantly reduces the amount of user input and is of great benefit in a production work environment. The basic solution process consists of an iterative loop through the four functions shown in figure 1.2. The blocked and overset grid system is first assembled. Once this is done, the flow solution is calculated in a time-accurate manner. Aerodynamic forces and moments are then integrated over the grid surfaces representing the physical surfaces of the moving bodies. The rigid body equations of motion are then integrated with respect to time to determine the new position of the grids considering all aerodynamic forces and moments, forces due to gravity, and all externally applied forces and moments (such as ejectors). Multiple iterations of this loop are required to perform a complete store separation trajectory calculation. The accuracy of the trajectory predicted from the itegration of the equations of motion is affected by the time step chosen; however, stability contraints on the flow solver are normally more restrictive. In typical store separation calculations, the time step has been limited to 0.1-1.0 milli-second; thus, hundreds or even thousands of iterations are often required. As the complexity of flow simulations continues to increase it becomes more
Grid Assembly
-^
Flow Solution
I Forces & Moments
Yes
6D0F Integration
Figure 1.2: Solution process
critical to utilize parallel computing to reduce solution turnaround times. The parallel implementation of the Beggar flow solver was first presented in reference [6]. This flow solver uses a finite volume discretization and flux difference splitting based on Roe's approximate Riemann solver [7]. The solution method is a Newton-Relaxation scheme [8]; i.e. the discretized, linearized, governing equations are written in the form of Newton's method and each step of the Newton's method is solved using symmetric Gauss-Seidel (SGS) iteration. The SGS iterations, or inner iterations, are performed on a grid by grid basis; while the Newton iterations, or dt iterations, are used to achieve time accuracy and are performed on all grids in sequence. In this reference, the separate grids are used as the basis for data decomposition. The grids, which represent separate flow solution tasks, are distributed across multiple processors and the flow solver is executed concurrently. The only communication between processes is the exchange of flow field information at block-to-block, patched, and overlapped boundaries between dt iterations. The grid assembly is performed only once and thus,
only static grid problems axe addressed. It is also desireable to utilize parallel computing to reduce the turnaround time of moving body problems such as the ripple release configuration. In order to do so, the grid assembly function must be executed each time grids are moved. An efficient, scalable parallel implementation of any process requires that both the computation and the required data be evenly distributed across the available processors while minimizing the communication between processors. The movement of the grids and the time variation in the holes being cut, as illustrated in figure 1.3 indicates the dynamic and unstructured nature of the grid assembly work load and data structures. This makes an efficient implementation a challenging task.
Figure 1.3: Example of overlapping grids with holes cut Thus, the primary focus of this work is the parallel implementation of the grid assembly function so that store separation trajectories can be calculated using timeaccurate CFD and parallel computers. A logical succession of incremental steps is used to facilitate the parallel implementation of the grid assembly function. The initial implementation (phase I) uses a single process to perform the entire grid assembly in a serial fashion with respect to the parallel execution of the flow solver. This requires that proper communication be established between the flow solution function and the grid assembly friction; however, it does not require any consideration of load balancing or partitioning of the grid assembly function. The grid assembly function
is not accelerated, but the flow solution is. . In the second implementation (phase II), parallel efficiency is gained by overlapping the grid assembly function and the flow solution function. This overlapping of work is possible because of the use of the Newton-Relaxation method within the flow solver. Each step of the approximate Newton's method produces an approximation to the flow solution at the next time step. Approximate aerodynamic forces and moments are calculated from the flow solution after the first Newton step and are used to drive the grid assembly function, while additional Newton steps are being calculated to achieve time accuracy. As long as there is sufficient time to hide the work of the grid assembly function, the speedup is affected only by the performance of the flow solver. However, as the processor count increases, the time of the flow solution available to hide the grid assembly decreases and the rate of change of speedup with respect to processor count decreases. Therefore, it is important to distribute the work of the grid assembly function to make the entire process scalable to higher processor counts. The third implementation (phase III) uses data decomposition of the grid assembly function to reduce its execution time and thus allows the grid assembly time to be more easily hidden by the flow solution time. The basis for the data decomposition is the superblock, which is a group of grids that contain block-to-block connections and are overlapped with other superblocks. In this implementation, the work and data structures associated with a superblock are distributed over multiple processors. Dynamic load balancing is used to improve the performance by moving superblocks between processes. The relatively small number of superblocks used in most problems places a limit on the number of processors that can be effectively utilized. Thus, in order to improve scalability, the fourth implementation (phase IV) uses a fine grain decomposition of the work associated with grid assembly. The work of the grid assembly function can be associated with the facets that cut holes into overlapping grids and the cell centers
7
that require interpolation. Therefore, the hole cutting facets and the IGBP's form the basis for the fine grain distribution of the work associated with grid assembly. This dissertation gives complete details of the implementation options for including the grid assembly function into the parallel execution of moving body CFD computations. Each implementation builds upon the previous implementation, attacking the limitations in order to improve performance. Details of the performance analysis are included. Equations for estimating the performance are also presented. With practical experience and some further development, these implementations and performance estimators could offer optimum execution guidelines for particular problems.
Related Work Grid Assembly Table 1.1 lists some of the codes that are currently available for assembling overset grid systems. Some of the advantages and disadvantages of each code are listed. Since the author is not completely familiar with the operation of all of these codes, some of the disadvantages (or advantages) may only be perceived. In general, finding the root cause of a failure in the grid assembly process is a difficult task. Therefore, it is a disadvantage of overset grids in general and is not listed as a disadvantage for any of the codes although some of the codes provide better aids for debugging than do others. Likewise, the use of orphan points (points that fail to be properly interpolated and are given averaged values from neighbors) can help to ensure that grid assembly does not fail. However, orphan points are not listed as an advantage for any code since they can adversely affect the flow solution. PEGSUS [9] is the first and one of the more widely used codes for handling the grid assembly problem. It relies on a set of overlapping grids (block-to-block connections are not allowed). PEGSUS is completely separate from any flow solver
Table 1.1: Grid assembly codes Code PEGSUS DCF3D CMPGRD
BEGGAR
Disadvantage Slow; requires alot of user input Fast; large user base; well Requires significant user input supported Modern programming Not widely distributed techniques; well defined algorithms Automated grid assembly; Slower than DCF3D; monoallows block-to-block con- lithic code; limited user nections; small user input base; has difficulties with geared toward production overset viscous grids work environment; complete flow solution environment Advantage First code; large user base
but will produce interpolation information for either finite difference or finite volume flow solvers. The amount of user input required is often rather large: each hole cutting surface has to be identified, all overlapping boundaries must be identified, and a set of links must be specified to tell the code which grids to cut holes into and where to check for interpolation coefficients. DCF3D (Domain Connectivity Function) [2] is another code used to accomplish the grid assembly task. DCF3D is not coupled directly with any flow solver but it has been used extensively with the OVERFLOW flow solver [10]. DCF3D uses several alternative approaches in order to improve the efficiency of the grid assembly process. DCF3D uses analytic shapes for hole cutting which allows grid points to be compared directly to the hole cutting surface. It also uses Cartesian grids, called inverse maps, to improve the efficiency of selecting starting points for the search for interpolation stencils. These techniques improve the efficiency of the grid assembly process; however, an additional burden is placed on the user to define the analytical shapes and the extent and density of the inverse maps. More recently, improvements to DCF3D have been proposed in order to reduce the burden placed on the user. These improvements include the use of hole-map tech-
9 nology and the iterative adjustment of the connectivity information [11]. Hole-map technology uses Cartesian grids to map the hole cutting surfaces in an approximate, stair stepped fashion. This would allow the automatic creation of the hole cutting surfaces and an efficient means of identifying hole points. The iterative process of adjusting the connectivity information by expanding and contracting the holes in order to minimize the overlap between grids also offers benefits. Yet another code that addresses the grid assembly problem is CMPGRD [12]. This code is an early version of the grid assembly process that has been included in OVERTURE [13]. This tool does not appear to be highly optimized; moreover, its strengths seem to be in its well defined algorithms for the grid assembly process. The algorithms can produce minimum overlap between grids and other quality measures are considered in the donor selection process. In comparison to the above mentioned codes, Beggar is unique in that its development has been geared towards the store separation problem and a production work environment. As such, Beggar attempts to automate the entire solution process while reducing the burden of input that is placed on the user. Beggar also uses unique data structures and algorithms in order to maintain the efficiency of the grid assembly process.
Store Separation Table 1.2 lists some of the techniques that have been used to calculate store separation trajectories. Some of the advantages and disadvantages from each technique are listed. The techniques range from simple curve fits of data from similar configurations, to wind tunnel experimental methods, to the calculation of the complete flow field from first principles. Engineering level methods (see [14] for example) derive aerodynamic data from data bases of experimental data, simple aerodynamic correlations, and panel methods with corrections for nonlinear effects such as vortical flow. Such methods are
10 Table 1.2: Store separation modeling methods Disadvantage Advantage Computationally inexpen- Limited applicability sive; provide quick data for preliminary design Captive Trajec- Wind tunnel accuracy of Limited range of motion; quasi-steady; high cost; tunflow phenomenon tory Support nel interference Influence Func- Fast solution allows sta- Mutual interference effects tistical investigation of can be lost tion Method trajectories Completely time accurate; Grid generation can be labor Computational flexible; unlimited in config- intensive; requires signifiFluid Dynamics uration; provides data for vi- cant computing resources; sualization of the complete weaknesses in modeling some flow phenomena such flow field as turbulence • Method Engineering Level Methods
computationally inexpensive but have very limited applicability. These methods are most useful in preliminary design, but have been applied to the calculation of store separation trajectories. Store separation events have been simulated in wind tunnels using the Captive Trajectory Support (CTS) system [15]. This technique places a sting mounted store in the flow field of an aircraft wing and pylon. The store is repositioned according to the integration of measured aerodynamic loads and modeled ejector loads. Since the store can not be moved in real-time, an angle-of-attack correction is made based on the velocity of the moving store. This technique is quasi-steady and often limited in the range of motion due to the sting mechanism. Store separation trajectories have also been calculated using wind tunnel data and an Influence Function Method (IFM) [16]. This method uses wind tunnel data to define flow angularity near an aircraft wing and pylon. This data is used to apply a delta to the freestream forces and moments of the store assuming that the store does not affect the aircraft flow field. Another correction is made for mutual interference using wind tunnel data of the store in carriage position. Jordan [17] gave a detailed
11 comparison of loads calculated from IFM and CFD versus loads measured in the wind tunnel. IFM was shown to be inaccurate due to mutual interference that is not directly related to flow angle. The distance at which mutual interference becomes insignificant must also be well known. Such semi-emperical techniques can also be used with CFD data replacing part or all of the wind tunnel data. In a recent special session at the AIAA Aerospace Sciences Meeting, most of the papers [18, 19, 20] presented used this technique. One paper [21] used quasi-steady CFD. Of the two time-accurate CFD simulations slated to be presented, one was withdrawn and the other was prevented from being presented due to the failure to get clearance for public release. When considering time-accurate CFD calculations for moving body problems, the decomposition of the domain (grid type) has a significant impact on the solution process. Table 1.3 lists several of the different grid methods in use. Some of the advantages and disadvantages of each grid method are listed. Cartesian grids (see [22] for example) have been used for moving body problems, but the treatment of boundary counditions can be complicated. Boundary conforming block structured grids have been used to calculate store separation trajectories [23]; however, the motion of a store within a block structured grid requires grid stretching and deformation. This places a limit on the motion before regridding is required due to errors introduced by grid skewness. Unstructured grids have also been applied to the store separation problem (see [24] for example). The flexibility of unstructured grid generation eases the grid generation burden but complicates the flow solver. Octree grids have also been used to ease the grid generation burden and allow adaptive grid refinement. SPLITFLOW [25] represents a compromise between these unstructured grid techniques. A prismatic grid is used near solid surfaces to simplify boundary conditions and an octree grid is used away from the solid surfaces and offers adaption and some organizational structure. Chimera grid methods are also a compromise and have been applied extensively to the store separation problem (see for example [4, 26,
12 Table 1.3: Grid generation methods • Grid Type Cartesian
Structured
Block Structured
Quad Tree
Unstructured
Chimera
Disadvantage Difficult treatment of boundary conditions; poor viscous solution capabilities to simple General treatment of Restricted flow solver and boundary geometries conditions Extension to complex Grid generation is time consuming; grid motion or geometries adaption is difficult Difficult treatment of Easily adapted boundary conditions; connectivity information required Automatic grid generation; Larger memory requirements; slower flow solvers; easily adapted connectivity information required; weak viscous solution capabilities (only at Structured grid flow solvers connectivity and boundary conditions; IGBP's) must be coneases grid generation bur- structed separate from the grid generation process den; allows grid movement Advantage Small memory requirements; fast flow solver
27, 28, 29, 30]). They can be viewed as locally structured, but globally unstructured. Time accurate CFD has been validated for use in calculating store separation trajectories. Lijewski [28] presented the first complete system for calculating store separation trajectories. In reference [28], Lijewski also presented the first use of a particular set of wind tunnel CTS data for store separation code validation. The configuration is a single, sting mounted, ogive-cylinder-ogive store under a generic pylon and wing. Grids for the generic store are shown in figure 1.4. Data, first presented in reference [4], for the subsonic and supersonic trajectories of the single generic store are shown in figures 1.5 and 1.6. The CTS data is shown by the symbols and the time accurate CFD calculations are shown by the curves. These comparisons show excellent agreement between the wind tunnel data and time
13
Figure 1.4: Grids for single generic store trajectory calculation
O) c
-1.0 0 00
0.05
0.10
0.15 0.20 time (sec)
0.25
0.30
0.00
0.05
0.10 0.15 0.20 time (sec)
0.25
0.30
Figure 1.5: Mach 0.95 single store trajectory calculated (left) CG position and (right) angular position versus wind tunnel CTS data accurate CFD calculations for this test problem. More complex configurations have also been used for validation cases. Cline [31] presented store separation trajectories from an F-16 aircraft configuration including a fuel tank, pylon, and an aerodynamic fairing at the junction of the pylon and the wing. Coleman [32] presented separation trajectories for the MK-84 from the F-15E aircraft. This configuration included a centerline fuel tank, a LANTIRN targeting pod, an inboard conformal fuel tank (CFT) weapons pylon with attached MK-84, forward and middle stub pylons on the outside of the CFT, LAU-128 rail launchers with AIM-9 missiles on both sides of the wing weapons pylon, and the MK-84 to be released from
14 10.0
4.0 3.0
£• gc
2.0
IQ.
1.0 0.0 oofrBooooQe^o^ -1.0 0.00
0.05
0.10 0.15 0.20 time (sec)
0.25
0.30
0.00
0.05
0.10
0.15 0.20 time (sec)
0.25
0.30
Figure 1.6: Mach 1.20 single store trajectory calculated (left) CG position and (right) angular position versus wind tunnel CTS data the wing weapons pylon. Both references compared trajectory calculations to wind tunnel data and were instrumental in the approval of the use of CFD by engineers in evaluating the store separation characteristics of weapons.
Parallel Computing Although much work has been done on the parallel execution of CFD flow solvers, including Chimera method flow solvers, little work has been done on the efficient parallel implementation of Chimera methods for moving body problems. In particular, there are very few references on the parallel treatment of the grid assembly problem. Table 1.4 gives a list of references of some of the more important developments in parallel computing as related to Chimera grid methods and grid assembly. Smith [33] presents the parallel implementation of an overset grid flow solver for a network based heterogeneous computing environment. This flow solver was derived from OVERFLOW and uses coarse grain parallelism with the component grids being distributed among the available processors. A master/slave model is used. The master process performs all i/o functions, maintains all of the interpolated flow solution data, and communicates with each of the slave processes. The slave processes calculate the flow solution and perform the interpolation of flow solution data. A load balancing
15 technique is used and the interpolation of flow solution data is overlapped with the calculation of the flow solution to reduce load imbalances. The grid communication information was supplied as an input and only static problems were addressed. Wissink and Meakin [34] presented the application of a Chimera grid flow solver based on OVERFLOW and DCF3D. This code uses overlapping structured grids near the solid boundaries in order to resolve viscous effects and uses spatially refined Cartesian blocks in the rest of the domain. Parallel performance was presented but only static problems were addressed. The same code was again presented in reference [35]. Two dynamic problems were presented in this reference; however, the focus was on the ability to adapt the Cartesian blocks due to flow solution and body motion. Some parallel performance data is presented based on an iteration of the flow solver. No performance data was presented for an entire simulation which would include the performance of the grid assembly. The first presentation of the parallel implementation of grid assembly for dynamic, overset grids was by Barszcz [36]. DCF3D was parallelized and used in connection with a parallel version of OVERFLOW on a distributed memory parallel machine. A coarse grain parallelism was implemented with the data decomposition based on component grids. A static load balance was used based on balancing the load of the flow solver. Since the flow solver represented a large portion of the total work, load balancing the flow solver is important to achieving a good overall load balance; however, significant imbalances were seen in the grid assembly processes. Donor cell identification was found to be the most time consuming part of grid assembly and algorithm changes were implemented to reduce this part of the work load. In reference [37], Weeratunga et al. again used DCF3D and OVERFLOW on a distributed memory parallel machine. Again, the component grids are used for data decomposition and load balancing is based on the work load of the flow solver. No consideration is given to the distribution of donor elements or IGBP's. The primary focus in this reference is on demonstrating the scalability of the processes used. In
16 this study, the donor search method scaled well; however, the hole cutting and the identification of points requiring interpolation did not scale well. In reference [38], Wissink and Meakin present the first attempt to load balance the grid assembly process. However, the data decomposition is still based on the component grids and affects the load balance of both the flow solver and the grid assembly function. A static load balance is initially performed to equally distribute the numbers of grid points which helps to load balance the flow solver. A dynamic load balancing routine is then used during a calculation to redistribute the grids to improve the load balance of grid assembly. This, in turn, creates an imbalance in the flow solver. This algorithm offers a method of improving performance if an imbalance in the grid assembly work load is a major deterent. However, in the problems presented, the flow solver represented the major part of the work load and any redistribution of grids in order to improve the grid assembly load balance actually decreased the overall code performance.
Dissertation Outline Chapter 2 presents details of the algorithms and data structures of the grid assembly process. For completeness, chapter 3 presents the flow solution algorithm and chapter 4 presents the integration of the 6DOF rigid body equations of motion. Chapter 5 presents an overview of programming parallel computers and outlines the approaches used in the current work. Chapter 6 gives some details of the proposed implementations including equations for estimating speedup. Chapter 7 presents the ripple release test problem used for all timings of the implementations. The results of the timings are presented in chapter 8. The final conclusions and some possibilities for future work are presented in chapter 9.
17
Table 1.4: Significant accomplishments in parallel computing in relation to overset grid methods Accomplishment Parallel implementation of OVERFLOW for heterogeneous computing environments Baxszcz, Weer- First parallel implementaatunga, and tion of grid assembly Meakin, 1993 [36] Weeratunga and Detailed study of scalabilChawla, 1995 [37] ity of parallel implementation of DCF3D Belk and Stras- First parallel implementation of Beggar burg, 1996 [6] Wissink and First attempt to load balMeakin, 1997 [38] ance grid assembly Reference Smith and Pallis, 1993 [33]
Limitation Restricted to problems
static
Data decomposition and static load balance tied to flow solver Data decomposition and static load balance tied to flow solver Restricted to static problems Decomposition of grid assembly tied to flow solver means any improvement in the load balance of grid assembly adversely affects the load balance of the flow solver Wissink and Small, near body, curvilin- Only static problems were Meakin, 1998 [34] ear grids used in combina- presented tion with adaptive Cartesian grids Prewitt, Belk, First parallel implementa- Limited scalability and Shyy, 1998 tion of Beggar for dynamic problems; overlapping of [39] grid assembly and flow solution time Meakin and Included dynamic problems No performance of dynamic Wissink, 1999 with combined overset grids grid assembly was presented and adaptive Cartesian grids [35] Prewitt, Belk, Coarse grain decomposition Major functions within the and Shyy, 1999 and dynamic load balancing grid assembly are not indiof grid assembly based on vidually well balanced [40] superblocks independent of flow solver
CHAPTER 2 GRID ASSEMBLY
Although Beggar is useful for general external compressible fluid flow problems, its primary focus during development has been on the simulation of store carriage and separation events. A typical grid system includes grids for an aircraft, pylons, launchers, and stores. The grids are often placed inside a large rectangular grid which serves as a background grid that reaches to freestream. Due to disparity in grid spacing between overlapping grids, it is often necessary to introduce other grids that serve as an interface to aid communication. The stores are often bodies of revolution with attached wings, canards, and/or fins. Blocked grid systems are used for these relatively simple geometries; however, in order to allow grid movement, such blocked grids are treated as overlapping grids with respect to other grids. The superblock construct is introduced to aid in grid assembly. The superblock is a collection of non-overlapping grids which are treated as a single entity. Block-toblock connections are allowed only within a superblock; thus a superblock is often used to implement a blocked system of grids for part of the solution domain. Overlapping connections are allowed only between different superblocks. A dynamic group is a collection of one or more superblocks that is treated as a single entity by the 6D0F. The dynamic group is used primarily to group grids which are part of the same moving body. There is always at least one dynamic group: the static dynamic group. This holds the static grids like the background grid, the aircraft grid, pylon grids, or store grids that do not move relative to the aircraft. Other dynamic groups are created for each store that will move relative to the static dynamic group. Since a dynamic group may contain one or more superblocks, each 18
19 moving body can be constructed from a system of blocked grids in a single superblock, a system of overlapping grids in multiple superblocks, or a combination of the two.
Polygonal Mapping Tree In order to establish overlapped grid communications the following questions must be answered: does this point lie inside a grid, and if so, what is an appropriate interpolation stencil? These questions represent point-volume geometric relationships. In order to determine such relationships, Beggar uses a polygonal mapping (PM) tree, which is a combination of the octree and binary space portioning (BSP) tree data structures [41, 42]. An octree is a data structure in which a region of space is recursively subdivided into octants. Each parent octant is divided into eight children which can be further subdivided. This forms a hierarchy of ancestor and descendant octants. Each octant in the tree is termed a node with the beginning node (lowest level) being the root node and the most descendent nodes (highest levels) being the leaf nodes. Such a data structure allows a domain to be divided into 8n subdomains using just n levels. Associated with each node are the Cartesian coordinates of the center of the octant. Which child octant a point lies in can be identified by comparing the coordinates of the point against the coordinates of the center of the parent octant. With such a data structure, a point can be identified as lying within a particular octant out of 8" octants by using at most n comparisons (if the tree is perfectly balanced). The BSP tree is a binary tree data structure in which each node of the tree is represented by a plane definition. Each node has two children representing the in and out sides of the plane. For a faceted representation of a surface, each facet defines a plane that is inserted into the BSP tree. While being inserted the facet may be clipped against existing planes in the BSP tree placing pieces of the same plane definition into different branches of the tree. Using a given point, the BSP tree is traversed by comparing the point against a plane definition at each level to determine
20
which branch to descend into. Once a leaf node is reached, the point is identified as being inside or outside of the faceted surface. In theory, a BSP tree of the cell faces on the boundaries of a grid block could be used to determine whether a point is in or out of that particular grid. However, due to the clipping process, the BSP tree can be prone to roundoff error. Likewise, the structure of the tree is dependent on the order in which facets are inserted and it is not guaranteed to be well balanced. If the tree were to become one-sided, a point may have to be compared against all or most of the facets on a surface to determine its relationship to that surface. Therefore, Beggar uses a combination of the octree and BSP tree data structures. The octree, which stays well balanced, is used to quickly narrow down the region of space in which a point lies. If a point lies in a leaf node that contains an overlapping boundary grid surface, it must be compared to a BSP tree that is stored in that leaf node to determine its relationship to that boundary surface and therefore its relationship to the grid itself. The PM tree data structure is built by refining the octree in a local manner until no octant contains more than one grid boundary point from the same superblock. This produces a regular division of space that adapts to grid boundaries and grid point density. The boundary cell faces of the grids are then used to define facets which are inserted into BSP trees stored at the leaf nodes of the octree. Since each grid boundary point is normally shared by four cell faces and each octant contains only one grid boundary point, the BSP trees stored at the octree leaf nodes should be very shallow. Once the basic data structure is complete, all of the octants of the leaf nodes are classified relative to the grid boundaries. Each octant is classified as inside or outside of each superblock or as a boundary octant. Then points can be classified efficiently relative to the superblocks. To do so, the octant in which the point lies is found. If the octant has been classified as IN or OUT, the point can be immediately classified as IN or OUT. However, if the point lies in a boundary octant, the point must be
21 compared against the BSP tree that is stored in that octant. Figure 2.1 represents a quadtree (2d equivalent of an octree) for a 4 block O-grid around an airfoil. Only the grid points on the boundaries are used to define the level of refinement, so only the boundaries of the grid are shown. The grid boundaries are inserted into the leaf octants as BSP trees to form the PM tree. A portion of the PM tree that might result is shown in figure 2.2. The leaf octants are represented by squares; while the other nodes are represented by circles. The four branches at each node represent the four quadrants of an octant. The line segments shown in some of the leaf octants represent portions of the grid boundaries that would be placed in BSP trees. If a point being classified against the PM tree falls into one of these leaf octants, it must be compared against the facets to determine its relationship to the grid. The empty leaf octants that are drawn with solid lines are completely inside the grid; while the leaf octants that are drawn with dashed lines are completely outside the grid. Points that fall into either of these types of octants can immediately be classified relative to the grid.
/
f
/
\.
Figure 2.1: Example quad tree mesh
The PM tree is expensive to construct and would be very inefficient to use if
22
I...X
\...i
Figure 2.2: Example PM tree structure it had to be reconstructed each time a grid moved. Therefore, for each dynamic group, a set of transformations are maintained between the current position and the original position in which the PM tree was built. Whenever the PM tree is used to find an interpolation stencil in one grid for a grid point in another grid, the transformations are used to transform the grid point to the original coordinate system. The transformed grid point can then be used with the PM tree constructed in the original coordinate system of the grids. Thus the PM tree must be constructed only once.
Interpolation Stencils The primary function of the PM tree is to help find interpolation stencils for grid points which require interpolated flow field information. When an interpolation stencil is required, the PM tree is used to classify the corresponding grid point relative to each superblock. This quickly identifies which superblocks the grid point lies in and therefore which superblocks might offer a source of interpolation information. This answers the in/out question directly. However, once a point is identified as being inside a given superblock, the exact curvilinear coordinates corresponding to the Cartesian coordinates of the grid point must be found. For a curvilinear grid defined by the coordinates of the intersections of three families of boundary conforming grid lines denoted by (£,77, Q, the coordinates at
23 any point within a cell can be calculated from tri-linear interpolation Ä& i?, 0 = (1 - «)(1 " »)(1 - «0 r(7> JiK) + (1-u)(l-t;)u; »■(/,./,#+ 1)+ (l-u)v(l-w)r(I,J+l,K) + (l-u)vwr(I,J + l,K+l) + u(l-v)(l-w)r(I+l,J,K) + u{l-v)wr(I+l,J,K + l) + uv{l-w)r(I + l,J + l,K) + uvwr(I + l,J+l,K + l)
(2.1)
where r(7, J, K), r(I + 1, J, K),... are the known coordinates of the eight corners of a cell. The index (/, J, K) denotes the three dimensional equivalent of the lower left corner of a two dimensional cell; while, (u, v, w) vary between 0 and 1 throughout the cell so that £
/ + Uj
7=1,2,... ,iV/-l,
0
•>
p
pu
0
pu
pu2+p
Txx
pv > ,
puv
fi=
E + P),
T
xy
T~xz UTXX + VTxy + WTxz
pv
0
pvu
'ry
pv2 + p
>
,
>
9v =
r
1
9i=
r1 = r1(x,y,z,t),
C = C(*,y,M),
r = r{t)
(3.39)
38
Applying the chain rule, the partial derivatives with respect to the Cartesian coordinates can be written as 9
-c
9
9
-c±. i^i
±
i^i
dy~*ydt+rhdr,+t"dC 9
-*±M +r,
dz~*'d£ 9
m
iL + + (tZ r9-
'dri
d(
d
d 9 9 ^t A. + + T1 ±r + Ct d-T ^ % dc
rt/uH (3 40)
= Tt
-
where the term £x represents the partial derivative of £ with respect to x, etc. Thus, the metric term £x represents the variation in £ with a unit variation in x while y, z, and t are held constant. These terms are not easily evaluated. However, the partial derivatives of the Cartesian coordinates with respect to the curvilinear coordinates that arise from the inverse transformation represented by
X = X(Z,T1,(,T),
y = y(£,77,C,r),
z = 2(^,17, C,r),
t = t(r)
(3.41)
are easily evaluated. Applying the chain rule again, the partial derivatives with respect to the curvilinear coordinates can be written as
d
dl
d
= H
Vy
d
dx- ^ Wz
d _ d d_ Xr +y,1 d^~ 'dx dy d d d
Tc
d
z
= Xc
d_ 'dz d
+ Zr
dx- + y% + z 0, a backward space difference of the form "'
A
At
"'• + a^-^ = 0 Ax
(3.50) K J
is required to produce a stable scheme. Since the wave is propogating in the +x direction, the backward space differencing represents "upwind" differencing. If the
41 wave speed a were negative, a forward space difference, again representing upwind differencing, would be required to produce a stable scheme. The goal of "flux vector splitting" [45] is to split the flux vector into components which are associated with the positive and negative direction propogation of information so that upwind differencing can be used. This produces a stable scheme without the addition of any artificial dissipation that is often done with central difference schemes. Consider the one-dimensional Euler equations in Cartesian coordinates
Since the flux vector is a homogeneous function of degree one of Q, the governing equations can be written in quasi-linear form
£+*£=« at ox
(3-52)
(this looks alot like the model equation). The matrix A = dF/dQ, is the flux Jacobian matrix. This matrix can be decomposed in the form A = RAR-1 w here
(3.53)
the columns of R are the right eigenvectors of A, the rows of /?_1 are the left
eigenvectors of A, and the matrix A is a diagonal matrix with the eigenvalues of A along the diagonal. The eigenvalues are of the form Ai = A2 = A3 = u A4 = u + a X5 = u-a
(3.54)
where a is the speed of sound. For locally subsonic flow, some of the eigenvalues will be positive and some will be negative. Thus the matrix A can be written as A = A++A-
(3.55)
42 where A+ contains only the positive eigenvalues and A" contains only the negative eigenvalues. Substituting this into equation 3.53, the Jacobian matrix is split into A = RA+R'1 + RA~ R'1 = A+ + A-
(3.56)
and the split flux vectors are denned from the homogeneity property as F+ = A+Q F- = A-Q
(3.57)
F = F+ + F~
(3.58)
so that
Upwind differencing is then used appropriately with the split flux vectors in the discretized governing equations. The complete form of the split flux vectors can be found in reference [46]. An implicit discretization of the governing equations can be written as AQn+1 + Ar (^F"+1 + S^GT*1 + ScHn+1) = 0
(3.59)
where the superscript n denotes the time step,
AQn+1 = Qill ~ QM
(3-6°)
and
S G=
"
Ä5
ScH
HitjMl,2-H^k_ll2
=
(3 61)
For a finite volume discretization, the indices i,j, k represent a cell in which the dependent variables Q are assumed to be constant, and indices i + 1/2,j, k and
43
i - l/2J,k, for example, axe opposing cell faces at which the flux is evaluated. The changes in the curvilinear coordinates A£, Ä77, and AC are unity. A first order time linearization of the flux terms [47, 48], leads to the equation AQn+1 Ar
0
■^♦©"^♦«■MS)"* *" +SC
AQ,n+l = 0
(3.62)
'-k = F+ (Qf+1/2,,fc)
(3.66)
Qf+i/Tj* = QiJ,k
(3-67)
where
for a first order accurate scheme, and Qf+i/2,i,* =
\QM
~ \Qi-u,k
(3-68)
for a second order accurate scheme. Likewise, the (—) flux is evaluated using cells to the right of the cell face F
«i/2j,k = F- (Qf+1/2^)
(3-69)
Qf+i/2j,* = Qi+ijjk
(3-70)
where
for a first order accurate scheme, and 3 Qi+i/2,j,k =
2*2«'+IJ.*
1 ~~ 2®i+2>i'k
(3-71)
for a second order accurate scheme. The extrapolation of the conserved variables to the cell face and their use to calculate the flux is often referred to as MUSCL extrapolation [49]. Alternatively, the primative variables can be extrapolated and used to calculate the flux or the flux can be evaluated at the cell centers and extrapolated to the cell center. In the higher order schemes, flux limiters, applied to the flux, conserved variables, or the primitive variables, are used to selectively reduce the scheme to first order to avoid oscillations in the solution near discontinuities. The flux limiters available include the minmod, van Leer, and van Albada limiters.
45
Flux Difference Splitting " Hirsch [46] describes upwind methods as methods in which physical properties of the flow equations are introduced into the discretized equations. Flux vector splitting introduces the direction of propogation of information through consideration of the sign of the eigenvalues in the discretization. Another method that handles discontinuities well is due to Godunov [50]. In Godunov's method, the conserved variables are considered constant throughout each cell and a one-dimensional exact solution of the Euler equations is computed at each cell boundary. The two constant states on either side of a cell boundary define a Riemann (or shock tube) problem that can be solved exactly. An integral average of the exact solutions to the Riemann problems at each cell is taken to determine the solution at the next time step. Other methods have replaced the computationally expensive exact solution of the Riemann problem with an approximate Riemann solution. These methods, including the popular method due to Roe [7], are often referred to as "flux difference splitting" methods. Considering the quasi-linear form of the one-dimensional Euler equations shown in equation 3.52, the elements of the Jacobian matrix A are not constant. Roe proposed replacing this non-linear equation with the linear equation
£ + *£ = at ox
(3-72)
where A is a constant matrix. This equation is solved at the interface between two cells to determine the flux at the interface. The matrix A is chosen so that the solution of this linear equation gives the correct flux difference for the non-linear Riemann problem. The properties required of A are i It constitutes a linear mapping from Q to F n limQ^QH-K? KQL,QR) = A(Q) = §g iii F(QR) - F{QL) = A(QL, QR) • (QR - QL) iv The eigenvectors of A are linearly independent
46
The superscript ()L and ()R represent quantities on the left and right sides of the interface. The matrix A for the approximate Riemann problem is constructed from the flux Jacobian matrices where the primitive variables are replaced by the Roe averaged variables
U =
V =
sffuL + yffuR \fpTvL + \ftPvR
W =
where H is the total enthalpy per unit mass, which is related to the total energy per unit mass by the relationship #=£+P
(3.74)
The solution of the approximate Riemann problem yields the following equation for the flux at a cell interface Fi+\/2J,k = 2 \Fi+l/2jJt +
F
t+l/2j,k) ~ 2 |Ä+1/2,J,*| (Qt+l/3j,fc
_
Qi,j,k)
(3-75)
where |Ä| =/? |Ä|/T1
(3.76)
where the (~) notation is used to denote that the Roe averaged variables are used in the evaluation. The assumption is made that the wave from the solution of the one-dimensional Riemann problem move normal to the interface. For the threedimensional problem, the one-dimensional solution is repeated for the three directions.
47 For first order spatial accuracy, the primitive variables used in the Roe averaged variables come from the cells neighboring the interface. For second order accuracy, the values are extrapolated as shown in equation 3.71.
Newton Relaxation Newton's method for a non-linear system of vector functions F{x) = 0
(3.77)
F(x) (xm+1 - xm) = -F(xm)
(3.78)
can be written as
This defines an iterative procedure for which m is the iteration counter and Fix) is the Jacobian matrix defined by
Following the presentation of Whitfield [51], the discretized governing equation 3.59 leads to the function
AT
_
AQ,n+l
+fi(Qn+1)
A
AT
(3-80)
for which a solution is sought by Newton's method. Here, the vector Q contains the dependent variables for every cell throughout the entire grid system. The Jacobian . matrix is defined by :Fwv Qn+1) =
'^
>
1 _l + dJW| ) n+1
AT
(3.81)
dQ
which yields the iterative scheme yi+l,m _ /-»n ■/-)n+l,m rx in+l.m+l _ _
^7
+
\dQj
AQ
^— i^Tmin
5£_
+ Ä(Qn+l.»»)
(3.82)
48 where pn+l.m+l _ Qn+l,m , ^Qn+l,m+l gn+1,0
=
gn
n denotes the time level, m is the Newton iteration counter, Ar/ is the local time step, and Armtn is the minimum time step. Flux vector splitting is used on the left-hand-side and flux difference splitting with Roe averaged variables is used on the right-hand-side. Steger-Warming jacobians, Roe analytical jacobians, or Roe numerical jacobians can be used. Each iteration of the Newton's method is solved using Symmetric Guass-Seidel (SGS) iteration. The SGS iterations, or inner iterations, are performed on a grid by grid basis; while the Newton iterations, or dt iterations, are used to achieve time accuracy and are performed on all grids in sequence. This procedure eliminates synchronization errors at blocked and overset boundaries by iteratively bringing all dependent variables up to the rn+1 time level. The fixed time step, Armtn, is used to maintain time accuracy and a local time step, Ar/, is used for stability and convergence of the Newton iterations. Steady state calculations do not use Newton iterations. The first term on the right-hand-side of equation 3.82 becomes zero and local time stepping is used during the inner iterations. Explicit boundary conditions (BC) can be used or implicit BC's can be achieved by updating the BC's during the SGS relaxation solution of Equation 3.82 [52]. An under-relaxation factor is applied to the implicit BC update to improve stability.
Fixed-Point Iteration A linear system of equations of the form Ax = b
(3.83)
49 can be solved using the general fixed-point iteration scheme xm+i = xm + c(fc
_
Axmj
m
= 1,2,3,...
(3.84)
(see, for example, reference [53, pages 223-233]). This iteration function is in quasiNewton form. The function for which a zero is being sought is f(x) = Ax - b. However, the matrix C is an approximate inverse of A rather than the inverse of the derivative of /. This approximate inverse is defined by the requirement that ||/-CA|| relative to an IRF XYZ. Applying this relationship to L and assuming that the mass m is constant, equation 4.2 becomes -=V/ m
+u>xV
(4.6)
=£_o,xy
(4.7)
/ xyz
or
yj / xyz
TfX
54 Applying 4.5 to H, equation 4.3 becomes M = lu/xyz + w x H
(4.8)
w/^rz/^M-r^x/w
(4.9)
or
Equations 4.7 and 4.9 are the equations of motion written with respect to the local coordinate system (see Etkin [55] for a more complete derivation of the equations of motion). These equations can be integrated twice with respect to time to get a time history of the translational and rotational position of the rigid body. However, since the equations of motion are written with respect to the local coordinate system, the change in position coming from the integration of the equations of motion is of little use for tracking the body motion since the local coordinate system is always changing. Instead, the changes in body position must be transformed back to the global coordinate system so that the position and orientation of the body relative to the global coordinate system can be maintained.
Coordinate Transformations The local coordinate system is represented by the lower case letters xyz, while the global coordinate system is represented by the upper case letters XYZ as shown in figure 4.1. The origin of the local coordinate system is placed at the CG of the body, the +x axis extends forward along the longitudinal body axis, the +y axis extends laterally along what would be an aircraft's right wing (from the pilot's perspective), and the +z axis extends downward in the direction defined by the right-hand rule. The rotation of the local coordinate system relative to the global coordinate system can be represented by the three Euler angles of yaw (ip), pitch (#), and roll ((f)). As shown in figure 4.1, the local coordinate axes, which are initially aligned with the global coordinate axes, are first rotated by xj> about the Z axis to produce the x'y'Z
55
Figure 4.1: Transformation from global to local coordinates axes. These axes are then rotated by 9 about the y' axis to produce the xy'z" axes. These axes are then rotated by about the x axis to produce the local coordinate axes xyz (see Blakelock [56] for another description of the coordinate systems). These transformations are written in matrix form as
(4.10)
(4.11)
(4.12)
With the notation [/?*()
sin ip sin 4>)
(sin ^ sin 6 sin )
cos 6 sin 0
cos 0 cos
\ X
y > =
= pex + qey + rez
(4.16)
57 or u = ij>ez + 9ey> + j>ex
(4.17)
Decomposing the unit vectors ey> and ez into the xyz coordinate system yields eyi = cos (f>ey — sin ey + cos 0 cos ez
(4.19)
and
as can be seen from the transformation matrices in equations 4.12 and 4.14. Combining equations 4.16-4.19 yields the relationships p = (j> — ip sin 6 q = xj) cos 0 sin (j> + 0 cos ^ r = ^ cos 0 cos — 9 sin (f>
(4.20)
which can be inverted to give $ = p + q tan 0 sin 0 + r tan 0 cos ^ 9 = q cos (j> — r sin + r cos ■ oo; therefore, 0 -*■ oo and j> -)• oo. This singularity
is called "gimble lock" [57].
Quaternions Quaternions were developed by Hamilton [58] as an extension to complex numbers and have been used in 6DOF simulations [59] because their use avoids the gimble lock problem. They have properties similar to both complex numbers and vectors.
58 Like a complex number, which has a real part and an imaginary part, a quaternion has a scalar part and a vector part and is often written as Q = e0 + eii + e2j + e3k
(4.22)
where i, j, and k are unit vectors in the three Cartesian coordinate directions. The multiplication of two quaternions requires the additional rules of quaternion algebra
ij = -ji = k jk = —kj = i ki = -ik = j
(4.23)
which are similar to the rules of complex math and vector cross products. The multiplication of two quaternions is simplified if we rewrite equation 4.22 as Q = Qo + Q
(4.24)
which emphasizes the scalar and vector components. Following the distributive property, the multiplication of two quaternions is PQ = (Po + P)(Qo + Q) = P0Qo + PoQ + QoP + P 0 Q
(4.25)
The ® operator can be shown to be equivalent to P®Q = PxQ-PQ
(4.26)
Similar to complex arithmetic, the conjugate of a quaternion is defined as Q* = Qo-Q
(4.27)
The product of a quaternion and its conjugate is thus QQ* = Q*Q = el + el + t\ + t\ = |Q|2
(4.28)
59 or the square of the magnitude of the quaternion. A unit quaternion is a quaternion of unit magnitude. For the unit quaternion of the form Q = cos(a/2) + A sin(a/2)
(4.29)
QVQ* = V
(4.30)
the transformation
rotates the vector V about the axis denned by the unit vector A by an angle a to produce the vector V. Since this is a unit quaternion, Q* is the inverse of Q. Thus the inverse transformation CTV'Q = V
(4.31)
rotates the vector V about the axis denned by A by an angle of -a to recover V. If the unit vector A is defined to be equivalent to ex of our local coordinate system, a is equivalent to the roll angle 4> and the rotational position of the body can be represented by the quaternion Q = cos( oo, the term fp/n —> 0. Thus, the speedup is limited to l/f3, or 20 in this case, no matter how many processors are used. This could be used to argue that parallel processing does not hold the answer to the need for increased computing power. However, the potential from multiple processors and the increased memory often available with MPP machines allows larger and
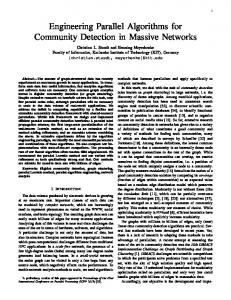
71 larger problems to be addressed. With CFD solutions, as the problem size increases, the computation to communication ratio usually increases and the serial fraction of the work load decreases. Even the limit specified by Amdahl's law is not always reached. The major contributor to this behavior is an imbalance in the distribution of the work to be executed in parallel. Consider figure 5.1. The left side of the figure shows the serial execution of a function that operates on four grids; while the right side shows the parallel execution of the function on four processors with one grid per processor. The serial execution time and thus the total work is represented by the time T5-T1. On four processors, the average work per processor is represented by the time (T5-Tl)/4. However, the total execution time in parallel is dictated by the maximum execution time of any process. This time, T2-T1, is larger that the average execution time by a factor related to the imbalance in the work load or execution times. Time Serial Tl TAVG T2
Parallel
01
Ol
02
03
04
sr2 T3 03
T4 T5
g4
Figure 5.1: Unbalanced work load Since the term fp/n in equation 5.5 represents the average parallel work per processor, this work must be increased by a factor proportional to the load imbalance. Generalizing equation 5.5 to include the effect of a load imbalance, the speedup becomes s~
1
(5.7)
where /< is the load imbalance factor. The load imbalance is often judged by the ratio
72
of the maximum execution time of any process and the minimum execution time of any process. However, as used here, the load imbalance factor is used to increase the average execution time per process to the maximum execution time of any processor. Thus, the imbalance is equal to the ratio of the maximum execution execution time of any process to the average execution time per process. The load balance is further complicated by the basis for the decomposition of the work. If each division in the decomposition does not represent a nearly equal piece of the work, the load balance can vary significantly with the process count. Obviously, if there are not enough pieces of work, some of the processes would sit idle. Likewise, if there is one piece of work that is significantly larger than the other pieces, it can dominate the execution time. Consider figure 5.2. The left side of the figure shows the serial execution of a function that operates on four grids. When the function is duplicated and the grids are distributed across two processes (shown in the middle of the figure), the work is well balanced and the execution time is cut in half. However, when four processes are used (shown on the right side of the figure), no improvement in the execution time is seen. The work associated with grid gl is one half of the total work; thus, the execution time is dominated by the execution time of gl. Time
■PI
Serial
4 PE'S
2 PE's
?2
02
sri
ffl
03
S3
S4
ffl
g4 T3 T4 T5
g2 ff3 g4
Figure 5.2: Limitations in load balance caused by a poor decomposition Another common cause for the degredation in the speedup achieved is synchronization between processes. Synchronization is enforced by the placement of barriers in the execution path. No process may pass the barrier until all of the processes have reached the barrier. This can ensure that every process has completed a particular
73
portion of the work load before any process starts on the next portion of work. This may be required if one function is dependent on the results from a previous function. How this can cause an increase in execution time is illustrated in figure 5.3. This diagram shows two functions (A and B) operating on separate grids on separate processors. Without synchronization, the total work per process may be well balanced; but if synchronization is required between the functions, wait time can be introduced if each function is not well balanced. Time
Independent processors
Synchronized processors
Tl A(g2)
A(g2) A(gl)
A(gl) T2
wait T3
B(g2) B(srl)
B(gl)
B(g2)
T4
wait T5
Figure 5.3: Imbalance caused by synchronization This illustrates the fact that each piece of work between any two synchronization points must be well balanced in order to achieve a good overall load balance for the entire code. To take this into account, equation 5.7 should be written as (5.8)
where the terms within the summation represent each section of code between synchronization points that is executed in parallel.
Load Balancing The most important part to achieving good parallel performance is load balancing. The problem of load balancing is similar to the computer science problems referred to as the "knapsack problem" [73] and the "partition problem" [74]. These
74
problems are NP-complete, which is the set of all problems for which no algorithm exists that is guaranteed to produce the exact solution through nondeterministic means in polynomial time. The input to the knapsack problem is defined by a set of items with specified sizes and values and a knapsack of a specified capacity. The problem is to maximize the value of the subset of items that will fit into the knapsack at one time. The input to the partition problem is a set of blocks of varying heights. The problem is to stack the blocks into two towers of equal heights. The input to the load balancing problem consists of a set of pieces of work, a measure of the cost of each piece of work, and the number of processors across which the pieces of work are to be distributed. The problem is to associate each piece of work with a processor while minimizing the ratio of the maximum total work associated with any processor and the average work per processor. The amount of work associated with each piece of work is similar to the value of the items to be placed in the knapsack or the height of the blocks. The processors are similar to the knapsack or the towers. The average work per processor corresponds to the capacity of the knapsack or the average height of the towers. However, each piece of work must be associated with a processor, each processor must have at least one piece of work, and there is no limit on the amount of work that can be associated with each processor. The algorithm used to balance the work of the flow solver is a max-min algorithm. This algorithm, shown below, takes the piece of work with the maximum cost from the pieces of work that have not yet been assigned to a processor and assigns it to the processor that has the minimum total work assigned to it. This algorithm distributes the work across the available processors with only a single pass through the list of the pieces of work, thus the execution time is bounded. With sufficient partitioning of the work, this algorithm produces a good load balance, although it may not produce the best possible distribution of the work. The array W^orfcQ is an estimate of the cost associated with each piece of work
75 (each grid, in this case). Since the work of the flow solver is closely associated with the number of grid points, the cost associated with a grid can be defined as the number of points in the grid. However, there are other factors that can affect the execution time that are not directly related to the number of grid points. Thus, a user defined weight can be associated with each grid and it is the weighted number of grid points that is fed into the load balancing routine as the cost of each piece of work. The output from the load balancing routine is an array GridToPeft that specifies which processor will execute the flow solver for each grid. MAP_GRlDS_To_PES(WorfcO) 1 for i --~".
2.5 -" c
5.0
pitch -j
O)
a>
0.0
(0
in
0.0
oi
o
c a
Q.
-
-2.5
C ft
-5.0
-10.0 Ö.00
1
0.00
0.10
0.20 time (sec)
0.30
0.40
■
: '-yaw
0.10
-'
^
"7/-roll x \
0.20 time (sec)
\-
0.30
0.40
Figure 7.2: Outboard store (left) CG and (right) angular positions
20.0 yawy 10.0
I
roll y
ao
to
o g>
\
-10.0
\
-20.0 -5.0 0.00
0.10
0.20 time (sec)
0.30
0.40
-30.0 0.00
N:
L
0.10
0.20 time (sec)
0.30
Figure 7.3: Inboard store (left) CG and (right) angular positions
pitch ^
0.40
CHAPTER 8 RESULTS
Phase I: Hybrid Parallel-Sequential The ripple release test problem was run on the SGI Origin 2000 using the phase I implementation and the 24 block grid system. The grid assembly was run in a single FE process and the flow solver was decomposed and executed using 4, 8, 12, and 16 BE processes. The timing results are displayed in figure 8.1. The actual speedup is plotted against the estimated speedup as defined by equation 6.1. In this implementation, the grid assembly for the entire domain is performed by a single process that executes sequentially with respect to the parallel execution of the flow solver. Once an iteration of the flow solver is complete, the grid assembly process is swapped in to perform the grid assembly. The grid assembly function and flow solver do not execute at the same time, thus the speedup data is plotted against the number of BE processes, which is equivalent to the maximum number of processes that are running at any one time. For the estimated speedup curve, the load imbalance factor for the flow solver (F, = 1.05) represents a nominal imbalance of 5%. The speedup for these cases ■is actually better than the predicted value. This is most likely due to a latency experienced on the SGI Origin 2000 architecture. When a processor accesses memory off of its node card there is a delay when compared to accessing the memory on its node card. As more processors are used, the amount of memory that a processor needs decreases since the grids axe distributed across the available processors. Thus, the potential that the data can be stored in the memory on the node card increases. 106
107 20 18 16 14 f 12
IQ. 10 m
8 6 4 2
phase I, actual ^'L phase I, Fi=1.05 0
2
4
6 8 10 12 14 16 18 20 processor count
Figure 8.1: Actual speedup of phase I The large memory job running on a single processor runs slower due to this latency and thus an artificial speedup is seen with increased processor counts. The estimated speedup curve still follows the trends in the data very well. The accuracy of the solution is demonstrated by the position data shown in table 8.1. This data represents the position of the CG and angular orientation of the bottom store after 0.3 seconds of the trajectory. The maximum difference, as compared to the sequential run, is on the order of 0.002 feet and 0.03 degrees. The actual execution times in minutes are also listed in table 8.1.
Table 8.1: Summary of results from the phase the bottom store Seq 4 1 no. of processors -1.5867 -1.5867 X -0.0007 -0.0005 position y 6.5293 6.5292 z yaw 8.0665 8.0659 orientation pitch 3.4369 3.4347 1.3669 1.3336 roll 9384 2786 exec, time min)
I runs including the final position of Phase I 12 8 -1.5867 -1.5868 -0.0005 -0.0004 6.5292 6.5292 8.0659 8.0677 3.4349 3.4355 1.3343 1.3587 1150 1513
16 -1.5871 -0.0012 6.5311 8.0456 3.4295 1.3690 1013
108 1.0
1.5
"■"!■
'
Drag dtO, dt1
Yaw dtO, dt1 0.5
] D O O D a D
c g>
%
0.0
§ E o E
-0.5
8
-0.5 "0.0
50.0
100.0 150.0 iteration no.
200.0
n H n D □ D D n r
Roll dtO, dt1 Pitch dtO, dt1 "A_A
-1.0 -1.5 0.0
50.0
100.0 150.0 iteration no.
200.0
Figure 8.2: Bottom store (left) force coefficient and (right) moment coefficient variation between dt iterations history
Phase II: Function Overlapping This implementation continues to use a single process to compute the grid assembly for the entire domain. However, some parallel performance is gained by overlapping the execution of the grid assembly and the flow solver. The approach of overlapping the grid assembly and flow solution functions is worthless if the forces and moments calculated after the first dt iteration are not a good approximation of the final forces and moments to be calculated. Thus, several test cases were run to monitor the forces and moments after each dt iteration. Figures 8.2-8.4 show a time history of the force and moment coefficients for the three stores after each dt iteration of 200 iterations of the separation trajectory. All of the force and moment coefficients show good agreement between dt iterations. As an example, the maximum variation (between dt iterations) in the pitching moment coefficient for the bottom store throughout the entire trajectory calculation (600 iterations) was only 0.2%. It might be deduced that the use of implicit solid wall boundary conditions helps to accelerate the convergence of the flow solution near the walls although additional dt iterations are required to ensure convergence throughout the domain. Therefore, the most likely parameters to affect the forces and moments are the number of inner iterations and the BC relaxation factor; thus, tests were repeated with variations
109
2.0
2.0
Yaw dtO, dt1 Drag dtO, dt1 O O
model proposed by Menter in Ref.[15]. The BSL is a composite two-zone model using the k-a> model in the inner region of the turbulent boundary layer and reduces to the k-s model in the outer region and in regions of free shear flow thus overcoming the dependency of the original k-a> model on the freestream value of/ The tracking of the two zones in the model is facilitated by the introduction of a blending function F. The SST is a transport model for the principal turbulent shear stress, - pv\v\, and it uses the framework of the two equation eddy viscosity model. The first step in the development of this model is to create the new BSL two-equation model by transforming the high Reynolds number k-s model into a k-a> formulation. The transformed equations for k and a> are then multiplied with a blending function (1-Fi) and added to Fi times the original k and ©equations. The function F\ is assigned to be one in the sublayer and logarithmic region and zero in the wake region between the log-layer and the outer region. The resulting equations are
(Ha)
C"+oi/4)—
*,
(13a)
(lib) l(pto)+£ü>v/»)=&Tt-£--ßpa? + dt
where v,'s are the Cartesian components of the time-averaged fluid velocity vector, p is the fluid density, p the fluid viscosity, t the time, p the time-averaged fluid pressure, and -pv',v'j are the components of the Reynolds stress tensor. By applying the Boussinesq approximation and writing the components of the Reynolds stress tensor in terms of the velocity gradients and eddy viscosity, A, me RANS equations can be rewritten as
&
(13b) adcj dcj
&,
where the Reynolds stress tensor, jjj, is defined by - -PkS»
r
« =M,\ _d Xj
dx,
j
(14)
AIAA 2000-0142 Consequently, in the inner region of the turbulent boundary layer the model uses the standard k-co model, which unlike any other two-equation model does not involve damping functions. However, the k-co model does not predict the asymptotic behavior of turbulence correctly as it approaches the wall. But since the eddy viscosity is much smaller than the molecular viscosity in the proximity of the surface, the asymptotic behavior of the mean velocity profile is independent of the asymptotic form of turbulence. Therefore, even if it is not asymptotically consistent, the model can predict the mean flow profile and the skin friction correctly, as seen in Ref. [15]. In the outer region of the turbulent boundary layer and in regions of free shear flow the k-e model is better suited than the k-
is defined as in Eq. 20a. .Also, to describe the mechanical properties of the membrane it is necessary to specify the tension T based on material specifications and geometry. If the membrane material is assumed to be linearly elastic and not subjected to any pretension, the nominal tension can be written as
T = EhS
(24)
where E is the elastic modulus, h the membrane thickness and 5 the nominal strain given by 5=
L-L° L°
(25)
where L° is the unstrained length of the membrane and L the length after deformation. The length L can be described in spatial coordinates by
Refs. [4] [5] [6] [9] to represent a flexible membrane. Equation 27 has also an interpretation as the time scale for the membrane movement in the problem. For the finite inertia computations the inertial effects slows down the membrane and a new time scale must be developed to enable quantitative evaluations of the different simulations. As for the massless membrane equation the new time scale can be derived from Eq. 19a by multiplying with the normalized membrane density, pm=p/p„, where p is the fluid density. This new parameter is given by
n1 =
(28)
Both Til and II x indicate the ratio of characteristic time between the flow field, t{, and the solid membrane, /m. Specifically, n,~ö[(/f//m)2/3]. In addition to this parameter the angle of attack, a, and freestream velocity, vm must be specified along with the Reynolds number, Re, based on the membrane cord length c and fluid density and viscosity, p and p as
(26)
pv c
Re = where c is the membrane cord length. In the computational procedures the fluid forces, r and AP, and the membrane strain, S, are calculated with appropriate finite sum approximations along the membrane surface. It is often convenient to define dimensionless parameters to help characterize the flow/structure interaction. For an initially flat massless membrane dominated by elastic strain and subjected to fluid dynamic pressure and shear stress the deformation is dictated by
(27)
where q«, = pvJ/2 is the freestream stagnation pressure. The cube root in Eq. 27 is suggested by the exact solution of Eq. 23 given in [14]. This parameter is given the value 7.9 as suggested in
(29)
Furthermore, in the two simulations the freestream velocity oscillates 20% around its mean value with a frequency equivalent to a Strouhal number, St, of 1.5, where St is defined by St-*-
(30)
where/is the freestream frequency. Also, a frequency ratio parameter, Q, may be defined by drawing an analogy between a onedegree of freedom spring/mass system and the transverse motion of the membrane. If the ratio of the system forcing frequency to the system natural frequency,^ is defined as
n=
J
/.
(31)
AIAA 2000-0142 the following parameter may be defined and substituted for the Strouhal number in the basic parameter set used in the simulations O1 =
St
(32)
nr
Based on the above discussions, the nondimensionalized form of the governing equations can be deduced by introducing the following dimensionless variables: u =—
(33)
v =U„
(34)
7 = t.f
(35)
x=l
(36) (37)
c (38)
(39) Eh
The non-dimensionalized equations are as follows: (40)
dX
dY
du
d(uu)
d7
ax 1 Re
Bv
ftgv)
d7
ex
«Iil?-'S M^J AP
(43)
n
again, as with Efi, Clx is the appropriate dimensionless forcing frequency when the membrane has no pretension but develops tension elastically.
T =
-3/2
d(uv)_
dY
dP
ax
3x{dX)+dY{dY).
(41)
d(yv)_ SP dY BY
J_
+
Re dX {ax)
dY[dYl
(42)
v .y 4. COMPUTATIONAL PROCEDURE The objective of the present work is to perform computations of an unsteady flow over an initially flat elastic membrane with finite inertia and to evaluate the motion and configuration of the membrane as well as its aerodynamic properties and impact on the flow field. The simulations are also performed with a massless membrane, in agreement with Refs. [4][5][6][9], for comparison. The grid used is a non-square, structured grid with 201 nodes in the xrdirection, 121 nodes in the ^-direction and 100 nodes on the membrane (see Fig. 2). For the analysis of the impact of boundary placement and number of nodes on the calculations see Refs. [4][5]. The computational procedure is divided into several nested loops as described in Fig. 3. First the flow calculations are performed with a nondimensional time-step, Dt, of 0.75 using a limiting residual tolerance of 3xl0'3. The viscous stresses and aerodynamic pressures are then calculated along the membrane surface. Next the membrane movement is calculated according to the computed fluid forces. For the finite inertia calculations the membrane is moved using 100 time-steps per time step used in the flow solver. The massless membrane calculation is performed using a residual tolerance of 10'5. Since the fluid and structure parts of the solver needs to exchange information to ensure convergence, this procedure is repeated 10 times before each global time step is typically taken and the new freestream velocity is computed. The number of repetitions is an empirically obtained estimate based on observed convergence rates of the 'total' solution of the combined fluid/structure system for the case of finite inertia.
AIAA 2000-0142 Entire grid system
Enlarged view of the midsection UJf
A:s ^ M\V^VrrtT\\ \y\ \\U
tWrtt\TliiiiU'
1
' i''' '
?5>^Mv'^W^ >W\^WS3rV\^^ ,^\^\^\>^\\n\\\\\Vn\\\\\U^
]■■-■ ^^^^M^^e^^^^^^^^^g::
' 4-!
--UuUiummfthiiw^^ -4Wämn^
iI
::
r a±
^^^^^^^^^^^^^^^^H ^^^^^^^^^^^mff^^mffjfffftjijii flfi"! j i t|il| r^-^^^hP^'fr^m1 ttWmTTtfi i U'll1- ' ^>X^>W^MCMM
f^^^^^T^
i
i ii !
r
1 M1 WiUuWWWWWW \VliT\\WiWtW'fVrVT r^^ 1 I1 I IT 4X ttnTuMu™W?M^w^W^ X mmssmmMm^MSM^^^^^
w ^^Smmm^mmmM m 44+ ttWrnEMMmmmms Figure 2: Grid with 201x121 nodes and 100 points along the membrane.
5. Results and discussion The laminar computations were done using a moderate Reynolds number, Re, of 4000 while the turbulent simulations were carried out using a Re of 10*. For both cases the same parameters were used for the angle of attack, the nondimensional time scale, and the non-dimensional global time step, a=A°, n,=7.9, ft, =0.99 and Dt=0.75 respectively. Also, for all simulations the freestream velocity varies as v»=»/o+0-2sin(Q1t) with a non-dimensional frequency, Q,, of 0.067. With this value of fi,,
the membrane response is significantly faster than the time scale of free stream fluctuation. For the turbulent flow simulation, using the BSL and SST k-co model, the initial value of the turbulent energy, k, was set to 0.5 and the dissipation, ox, to 50 in accordance with the prescribed values in Ref. [15] for the model. These choices yields a turbulent Reynolds number, Äe,=pvmd'#, equal to 100. A test run of the computational setup gave an approximate value ofy* between 2 and 3, using a mesh with a distance to the center of the first off-wall control volume of approximately 5x10"*.
AIAA 2000-0142
(a) Computational procedure for massless calculation
A
Fluid
A
Residual > 3x10³-
Residual < 3x10"3
£
(b) Computational procedure for finite inertia structure (i) Overall Structure &) Fluid-structure interaction
Membrane
Fluid Calculate fluid forces T.AP
Residual > 3x10
ResiduaK 3x1 (I3
Calculate Nonlinear term, a
Membrane iteration using dt=DV100
Iterate membrane eq,
Residual > 10° Repeat 100 times
_ Repeat 10 times ResiduaK 10° Repeat 10 times J
Increase time and start new v.
Back to fluid solver
Increase time and start new v„
Figure 3: Computational procedures for(a) massless membrane and (b) finite membrane inertia. characteristic times of the structure (t,„) and two fluid flow features (tf and 1/f) are 1 : 1 :0 (100).
To ascertain the numerical accuracy, a grid refinement was performed by increasing the fineness towards the membrane surface. A comparison of the steady state results is presented in Table 1. It is quite evident that by fixing V^Vo the present grid resolution has not fully resolved all the detailed flow and structure characteristics. However, the qualitative trends seem to be consistent between solution obtained on different grids.
Plots have been made for different time steps corresponding to 0, 72, 144, 216, 288 and 360 degrees of a full oscillation of the freestream velocity. The 0° solution of the freestream cycle was computed by setting the amplitude of the freestream variation to zero and by running a sufficiently large number of time steps. This solution is quasi-stationary though there might still be some motion left in the case of finite inertia, which becomes more apparent with increasing membrane density.
In Table 1 aerodynamic characteristics including Ct, CD and their ratio under the steady state freestream condition are summarized. On both grid systems, there are 101 grid points on the membrane surface. It is interesting to note that the value of CL increases significantly for the turbulent flow case. The reason for this could be explained with help of the membrane shape and pressure distribution along the upper and lower surface. As will be discussed later, in the turbulent flow, the membrane is of a more symmetric profile.
Figures 4a and 4b show the massless membrane and finite inertia membrane shapes, respectively, at different times of the freestream oscillation. In Fig. 5a the lift/drag ratio is plotted at different times along with one period of the freestream variation for clarity. Figure 5a also shows the maximum deflection along the membrane and the maximum extension, respectively, over one freestream cycle. In Fig. 5b the massless membrane and finite inertia membrane shapes for the turbulent case are presented in the same manner as for the laminar cases. Figure 6b show the lift/drag ratio, maximum deflection and maximum extension over the freestream cycle as for the laminar case in Figs. 6a. The streamfunctions plotted in Fig. 7 show the
Worth noticing in the numerical setup is that the difference in time scale for the two problems has a clear impact on the aeroelastic response. In the present cases, the membrane response time, with or without the inertia effect, is faster than the time scale of free stream fluctuation. It is noted that with Q,=0.067, fit, =0.99 (or n,=7.9), the
10
AIAA 2000-0142 Turbulent
Laminar
Grid
cL
201x121 201x201
0.4673 0.5306
CD 0.05305 0.05083
cL/cD
CL 0.6777 0.8305
8.809 10.44
CD 0.04574 0.03468
CL/CD 14.82 23.95
Table 1: Effect of grid refinement on computed steady state aerodynamic properties for massless calculations. In both cases there are 101 grid points on the membrane surface Laminar i 201x201 grid) Finitelnertia, Massless Pm =500
•
Turbulent (201x121 grid) Finite Inertia Massless Pm =500
^L^iniii
5.40E-01 4.97E-01
5.38E-01 4.97E-01
7.32E-01 6.23E-01
7.29E-01 6.27E-01
ACL
4.30E-02
4.10E-02
1.09E-01
1.02E-01
v^D.min
5.61E-02 4.87E-02
5.55E-02 4.76E-02
4.72E-02 4.41E-02
4.70E-02 4.41E-02
ACD
7.40E-03
7.90E-03
3.10E-03
2.90E-03
CL/CD max CJCQ min
11.09E+00 8.86E+00
11.30E+00 8.95E+00
1.66E+01 1.32E+01
1.65E+01 1.33E+01
AQ/CD
2.23E+00
2.35E+00
3.40E+00
3.20E+O0
»■'Umax
t'D.max
Table 2: Lift and drag coefficients and lift/drag ratio for the different cases studied buildup and collapse of recirculation zones in the laminar flow regime. In Fig. 8 the recirculation zone streamline pattern is shown for massless (top) and finite inertia computations with two different values of/?,,, 500 (middle) and 900 (bottom). A plot of the membrane shape at 0° and 216° is added in Fig.9 to show the effects of inertia on the membrane configuration. The 0° result in Fig. 9 suggests that a larger number of time steps should be made for the higher value of pm to obtain a quasi-stationary solution. The plots of streamline patterns are omitted for the turbulent cases since the flow is fully attached at all times due to the turbulent boundary layer and the small angle of attack used in the simulations. The time dependent computation is initiated based on the steady solution. As can be observed from the figures, the lift and drag characteristics are not periodic which is caused by the nonlinear effect of the coupled fluid flow and membrane dynamics. Figure 10 shows the membrane profiles of the massless and finite inertia models at the time of maximum and minimum lift during the freestream velocity cycle. In Fig. 11 the pressure contours are shown for massless and finite inertia membrane in both laminar and turbulent flows. The contours are
plotted at 0° and 288° corresponding to the computed solutions with maximum and minimum values of the membrane deflection. The computational results show a clear difference between the massless approximation and the finite inertia model. The membrane configuration changes substantially as well as the fluid response and overall performance. The membrane shows a greater diversity in configuration during the freestream velocity oscillation for the finite inertia calculation than for that of the massless. For example the appearance of inflection points near the trailing edge of the membrane surface and the different pattern for the appearance and disappearance of recirculation zones. 6. Conclusion The results obtained through the simulations and evaluations performed within this work show significant changes in the aeroelastic response of the finite inertia membrane model as compared to the massless approximation. Adding inertial effects to the membrane equation greatly alters the membrane shape and configuration in laminar and turbulent unsteady flows. Based on
11
AIAA 2000-0142
the cun-ent choice of the time scales between membrane, free stream, and fluid momentum, as represented by the dimensionless parameters 77,, St and Qi, the time scale of the freestream fluctuation is long. Consequently, the inertia does not impact the range of overall aerodynamic performance. However, even for these cases, different aerodynamic characteristics are observed in the transient process indicating that the interaction among these dimensionless parameters are important for determining the aeroelastic characteristics of the overall system.
This work has been partially supported by NSF, AFOSR and Eglin AFB.
Cheer, A. Y. and C. P. van Dam, (eds.), 1993, "Fluid Dynamics in Biology", American Mathematical Society, Providence, RI Pedley, T. J. 1980, "The Fluid Dynamics of Large Blood Vessels", Cambridge University Press, Cambridge, UK.
[3]
Newman, B. G. 1987, "Aerodynamic Theory for Membrane and Sails", Progress in aerospace sciences, 24, pp. 1-27
[4]
[5]
[6]
[7]
[9]
Smith, R.W. and Shyy, W., 1996, "Computation of Aerodynamic Coefficients for a Flexible Membrane Airfoil in Turbulent Flow", Physics of Fluids, 8, pp. 3346-3353.
[11] Patankar, S. V. 1980, "Numerical Heat Transfer and Fluid Flows", Hemisphere, Washington D.C.
8. REFERENCES
[2]
Shyy, W., Klevebring, F., Nilsson, M.* Sloan, J., Carroll, B. and Fuentes, C, 1999 "A Study of Rigid and Flexible Low Reynolds Number Airfoils" J. Aircraft, 36, No.3, pp. 523-529
[10] Patankar, S. V. and D. B. Spalding, 1972, "A Calculation Procedure for Heat, Mass and Momentum Transfer in ThreeDimensional Parabolic Flows", Int. J. Heat and mass transfer, 15, pp. 1787-1806
7. Acknowledgement
[1]
[8]
[12] Shyy, W. 1994, "Computational Modeling for Fluid Flow and Interfacial Transport", Amsterdam, The Netherlands. [13] Braaten, M. and W. Shyy, 1986, "A Study of Recirculating Flow Computation Using Body-Fitted Coordinates: Consistency and Mesh Skewness", Numerical Heat Transfer, 9, pp. 559-574 [14] Seide, P. 1977, "Large Deflections of Rectangular Membranes Under Uniform Pressure", International Journal of Nonlinear Mechanics, 12, pp. 397-406
Shyy, W. and R. Smith, 1995, "Computation of Laminar Flow and Flexible Structure Interaction", Computational Fluid Dynamics Review, pp. 777-796.
[15] Menter, F. R 1994, 'Two-Equation EddyViscosity Turbulence Models for Engineering Applications", AIAA J., 32, pp 1598-1605.
Shyy, W., Udaykumar, H.S., Rao, M.M. and Smith, RW. 1996, "Computational Fluid Dynamics with Moving Boundaries", Taylor & Francis, Washington, DC, (revised printing 1997 & 1998).
[16] Johnson, D. A. and L. S. King, 1985, "Mathematically Simple Turbulence Closure Model for Attached and Separated Turbulent Boundary layers", AIAA J., 23, pp. 1684-1692
Smith, RW. and Shyy, W., 1995, "Computation of Unsteady Laminar Flow ' Over a Flexible Two-Dimensional Membrane Wing,", Physics of Fluids, 7, pp. 2175-2184
[17] Menter, F. R 1992, "Performance of Popular Turbulence Models for Attached and Separated Adverse Pressure Gradient Flows", AIAA J., 30, pp. 2066-2072
Shyy, W. and R Smith, 1997, "A Study of Flexible Airfoil Aerodynamics with Application to Micro Air Vehicles, AIAA Paper No. 97-1933
[18] Driver, D. M. 1991, "Reynolds Shear Stress Measurements in a Separated Boundary layer", AIAA Paper No. 93-2906
12
AIAA 2000-0142
Membrane profle, Finite inertia calculation
Membrane profile, massless calculation
0.045
r
i
i
0.045
i
0.04-
0.04
0.035
M/'..
0.035
-\
\r-\k
0.025
0\\\
0.0250.02-
0.02
$/■/
0.015
— — -—
HI
0.01
0.005 0
////■''
0.03-
0.03
aoi5-
Odeg 72 deg 144 deg 216 deg 288 deg 360 deg
aoi ■ B aoo5
.
. 0
0.1
0.2
0.3
0.4
0.5 x/c
Odeg 72deg 144 deg ---- 216 deg - 288 deg 360 deg
0.6
'
0.7
0.8
0
0.9
.
t
i
«
'
0.1
0.2
0.3
0.4
0.5 x/c
vi L.
0.6
1...
0.7
1
1
0.8
0.9
(b)
(a)
Figure 4: Laminar flow membrane profiles during one freestream oscillation, a=4° Re=4000, 77;=7.P, 77, =0.99, (a) massless, (b) finite inertia, Pm =500,
Membrane profile, tnrte inertia calculation
Membrane profile, massless calculation
0.045 0.04 0.035
"""""••Xxs. \;\\
0.03 >. 0.025
///
0.02
vW
r
0.015
— — — ---— —
0.01 0.005
Odeg 72 deg 144 deg 216deg 288 deg 360 deg
\^
.
n 0
0.1
0.2
0.3
0.4
^ 0.5 x/c
0.6
0.7
0.8
0.9
1
(b)
(a) Figure 5: Turbulentflow membrane profiles during one freestream oscillation, a=4 °, 77, =0.99, (a) massless, (b) finite inertia, Pm =500
13
Re=106,17i=7.9,
...
1
AIAA 2000-0142 tt/drag rabo at afferent tunas
Bit/drag ratio at drBerent times — "Freestream" « Frit» inertia + Massless
12
3
4
2
5
3
4
Freestream position, nd
Freestream position, rad
Membrane deflection at c
Membrane deflection at rjfterent times
0.045
— "Freestream" - Finite inertia + Massless
— "Freestream* . Finite inertia + Massless
0.035
/
\
0.03
2
3
4
2
5
5
«10J
3
4
5
Freestream position, tad
Freestream position, rad
x10
Membrans extension at dfarant times
Membrane extension at efferent times
— "Freestream" ■ Finite inertia + Massless
"Freestream" Finite inertia Massless
> +
4.5
4
15
\
3
/ "
2.5 2
3
4
2
5
3
4
5
Freestream position, rad
Freestream position, rad
(b)
(a)
Figure 6: Lift/Drag ratio, membrane maximum deflection and extension during onefreestream oscillation, n,=7.9, /7, =0-99,
0.1
0.2
0.3
0.4
0.5 x/c
0.8
0.7
0.8
0.9
1
w Membrane prelle at max/min lift coefficient, finite inertia calc. 0.05
(b) Figure 10: The membrane profiles at maximum and minimum values of CL for laminar and turbulent flows, a=4° Re=l(f, n,=7.9, LJ}=0.99, (a) Massless computation, (b) Finite inertia computation, Pm =500.
Figure 8: Laminar flow recirculation zone streamline pattern for massless and finite inertia calculations using Pm=500 and 900,11^7.9, ni=0.99,a=4°,Re=4000.
16
Figure 11: Pressure plots for 72° and 288° corresponding to the maximum and minimum values of the membrane deflection . IJ,=7.9, 77, =0.99, a=4°. Laminar flow Re=4000, Turbulent flow Re=106.
17