Parallel Evolutionary Algorithms applied to optimize the oilfields development Yv´an Jes´us T´upac Valdivia Ciencias de la Computaci´on Universidad Cat´olica San Pablo, UCSP Arequipa, Peru
[email protected]
Luciana Faletti Almeida Centro Federal de Educac¸a˜ o Tecnol´ogica Celso Suckow da Fonseca, CEFET/RJ Rio de Janeiro, Brasil
[email protected]
Abstract—This work presents the development and evaluation of an intelligent system to evaluate the performance of evolutionary algorithms under a distributing processing platform and using expert knowledge. The testbed is a decision support system applied to optimize the development alternatives in an heterogeneous oilfield. An alternative involves the number, location, trajectory and type of petroleum wells that are utilized among the exploitation time. The implemented framework consists in three modules: evolutionary algorithm, reservoir simulator and NPV computing and some inputs related to the expert knowledge. The outcomes obtained in this work are consistent with the viewpoint of the experts. This fact shows the suitability to use evolutionary algorithms in the petroleum engineering area.
In this work, evolutionary algorithms [4] with a distributed computing platform for the evaluation function [5] are used to find the best alternative to oil field development. In addition, the expert knowledge (initial seeds, quality [6] and aquifer maps [7]) is used as a criterion to obtain the initial solutions. The distributed computing platform allows us to exploit the processing power of processors in a computer network as a whole, and consequently, the time required for the optimization can be significantly reduced.
Keywords-oil field development; evolutionary algorithms; optimization; distributed systems
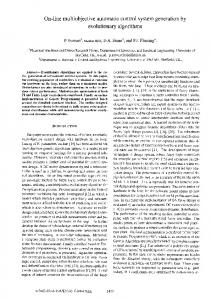
The optimization problem is to find the best alternative to oil field development, this means that we must find the best number, location and type of oil wells to be drilled into the oilfield. The proposed optimization model consists of two main modules: the optimization module and the objective function module. The proposed optimization model consists of two main modules: the optimization module, which contains the evolutionary algorithm, and the objective function module which is basically the reservoir simulator and the economic model of NPV calculation. For each individual, the evolutionary algorithm generates a set of parameters and variables to compose an alternative. This alternative is submitted to the reservoir simulator to obtain the respective production curves and then calculate the NPV of the alternative. To close the cycle, the NPV is returned to the evolutionary algorithm as the fitness of the individual being evaluated. The figure shows a 1 of the proposed optimization model.
I. I NTRODUCTION In reservoir engineering, a main task is the development of a strategy to maximize the hydrocarbon production within existing physical and economic constrains [1]. Solving these problems involves two main entities: the oil reservoir and the oil wells, each of these with a number of variables and parameters. Searching for the best parameters of these entities constitutes an optimization problem. Searching for the best parameters of these entities constitutes an optimization problem, and depending on the number of parameters may be impossible to try all possible combinations [2]. With respect to the variables and parameters, in the wells exists the trajectory (vertical or horizontal), axis of direction into reservoir (i, j or k), and the well type (producer or injector). Regarding the reservoir, its dimensions must be known and also the grid configuration, in order to know the number and sizes of blocks on i, j, k axes. To apply an optimization process is necessary to define an objective function to be maximized. For this work, the Net Present Value (NPV) [3] was chosen. Due to the complexity to obtain the production profiles for an alternative, it is necessary to use reservoir simulators to calculate the production of oil, gas and be able to calculate the NPV. Thus, the reservoir simulator becomes part of the evaluation function.
II. O PTIMIZATION SYSTEM
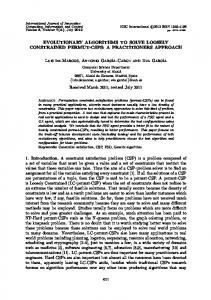
A. The evolutionary model To represent solutions within the evolutionary model, a variable sized chromosome is employed [8]. This chromosome uses a dual layer of genes. The first layer is the genotype and the second is an activation mask to enable or disable the gene associated in the genotype. Accordingly, the first layer is the alternative view as a list of oil wells and the second layer is the activation of these wells. Each gene of the genotype (first layer of chromosome) contains: the wellhead position (i, j, k), the direction dir and the length of the well-bore trajectory len. The figure 2
Expert knowledge
Alternative
Evolutionary Algorithm
Reservoir Simulation
Genetic operators
Objective Function
Production Scenery
Wells Layout
Production Curve CapEx
NPV Compute
OpEx
NPV = V − D
Figure 1.
Framework of the proposed system
shows the dual-layer chromosome used in this optimization problem [9]. Activation Mask (wells in alternative) 0
1
0
1
0
1
1
0
i, j, k dir len
i, j, k dir len
Chromosome (wellheads location) Vertical i, j
Injector
i, j
Horizontal i, j
i, j
Producer
Figure 2.
i, j, k dir len
i, j, k dir len
Injector
Producer
Individual representation
where, a bit “1” in mask means an active well and a bit “0” means an inactive well. B. Evolutionary Operators In this work were used the classical genetic algorithm operators (crossover and mutation) [10] with some adjustments to be better matched to the problem [9]. The operators used are: • Arithmetic crossover • Uniform Mutation • Non-uniform mutation. to be applied only in the genotype layer . To evolve the second layer (activation mask), the following operators [8] were used: • Addwell is a mutation that follows the crescent chromosome criteria, changing to ”1” any selected bit. • Flipwell, is a mutation that, following the oscillant chromosome criteria, switches the value of any selected bit. C. The fitness function • •
Let Xt be a population in generation t obtained by the evolution process. Let xi ∈ Xt an alternative to be evaluated, and mi the related activation mask.
As stated in section II-A, a chromosome xi represents an alternative that consist in a wells list. The evaluation of xi is performed as following: 1) The wells list in xi whose bits of mask are enabled is encoded in the simulator script language and it is sent to the reservoir simulator. 2) The reservoir simulator provides an oil, gas and water production using the wells defined into alternative (production profile). 3) The Net Present Value (NPV) for the received alternative is computed using the production profile and some parameters (CapEx, OpEx). 1) Reservoir Simulator: The IMEX black oil simulator [11] was used in this work, and the communication between the optimization module and the reservoir simulator is established via text files. Thus, the optimizator reads the reservoir configurations file (.DAT) obtaining the maximum values of i, j, k, the number of cells on grid, the reservoir grid type, active cells and real dimensions of each cell of grid, this information is useful to determine the domains and constraints to be considered by the evolutionary optimization model. Once the population X0 is generated, the evaluation module inserts the wells position info from each individual x genotype encoding the i, j, k, dir, type and len in a text file using the IMEX syntaxes and insert it into .DAT file. In this way, the simulator is able to understand any wells information from an individual. After performing a simulation, the generated files are read and is extracted the necessary information to calculate the oil, water and gas production that is sent to NPV module. 2) Net Present Value (NPV): NPV is the expected value of the discounted cash flow of the production [3], being obtained as: NPV = PV − D (1) where P V is the present value of the production during T years and D is the initial investment needed to start the production. More details about the cash flow and NPV in [12]. 3) Handling constrains: This model deals with the following constrains: • Minimal distance: two wells in alternative can not be closer than a minimal distance dmin , calculated as a minimum distance between two line segments. These constrain also prevents overlapping wells. • Maximum length: a horizontal well can not be longer than a maximum length lmax . These constrain also prevents the existence of wells extrapolating the oil field. • Null blocks: the reservoir grid description can define some areas containing inactive cells (null blocks), the simulator must not perform any calculations on these blocks. The evolutionary model has knowledge of the
invalid block list, and avoid placing wells in these blocks. 4) Using expert knowledge: This model considers two forms of expert knowledge: •
•
Initial seeds: consisting of the insertion in the initial population of solutions obtained in previous experiments or solutions provided by the expert. Quality and aquifer maps: are matrices of values which provide relevant information about the oil potential recovery and the possibility of water inflow in each regions of reservoir. These information is used as an impact on the activation probability of producer and injector wells during the initialization of X0 .
D. Parallel evaluation of individuals One of the main drawbacks of the proposal system is the computational time required to perform any reservoir simulation; a simulation may take a few seconds to several hours of computation time in a commom desktop computer. In order to exploit the computational force of a local network with several interconnected processors, the global parallel algorithm [5] is used. This approach consists in a master processor containing the evolutionary algorithm (population Xt , selection, and evolutionary operators) and a set of slave processors to compute the evaluation function used in this work. Figure 3 shows the master-slave architecture used to implement the global parallel algorithm.
Engine Module: containing the genetic algorithms used in the optimization: population, scaling, selection, and reproduction. • Scenery Module: containing routines related to the objective function i.e., the genotype codification using IMEX syntaxes, the reservoir simulator and NPV compute. It is clear that Data and Engine modules must be instantiated on master processor, and multiple copies of the Scenery module should be instantiated on slave processors. In addition, to communicate the modules instantiated in master and slave processors, two communication channels were implemented: • Data channel to send scenery and initialization data from master to slaves; • Evaluation channel to send the wells list of chromosome to each slave and return the evaluation value. These interfaces were implemented using the CORBA framework [13]. Figure 4 shows the modules and the communication interfaces. •
DATA CHANNEL Receive NPV parameters; Oilfield and wells parameters; .DAT and .INC files; Request for initialization; Request for status. Return Data Interface status.
EVALUATION CHANNEL Receive Wells list from chromosome; Request for status. Return NPV, D, Cumulative Oil; Incomes, Operational Cost; Evaluate interface status.
Scenery Module SceneryManager
Data Module
Engine Module
DataManager
EngineManager
Master
Xt = {xi}m i=1 Figure 4.
xi f (xi)
III. C ASES STUDIES
Slave 1
Slave k
Slave 2
Figure 3.
Slave 3
The master-slave architecture
To adapt the proposed model to global parallel algorithm and master-slave architecture, was necessary to divide the model into three modules. •
The data and evaluation channels
Data module: containing needed information to perform the optimization, i.e. oilfields, existing alternatives, NPV parameters.
To perform the experiments, an heterogeneous reservoir grid model with characteristics described in table III was utilized : Table I R ESERVOIR GRID MODEL USED IN EXPERIMENTS Feature Grid Dimensions Permeability Porosity Water saturation
Value 33 × 57 × 3 blocks 100 × 100 × 8.55m 575md. in i, j directions 57.40md. in k direction 390 ∼ 420kg/cm2 depending of k position. 100% in aquifer 25% in other zones
In this reservoir were performed 3 experiments with evolutionary optimization using randomly initialization, using knowledge as initial seeds and using information from
quality and aquifer maps. The parameters in table III are used for all the experiments. Table II PARAMETES USED FOR THE EVOLUTIONARY OPTIMIZATION Parameter Generations Population size Rounds Steady-state Activation probability Adaptive crossover rate Adaptive mutation rate
Value 80 160 individuals in Xt 1 0.6 0.7 0.65 ∼ 0.08 0.15 ∼ 0.50
The distributed processing was applied to speed-up the evolutionary optimization using the global algorithm under a master-slave architecture. A total of 21 computers in a LAN were used. The reduction of computational time was reduced from an expected 35 hours in a single-computer process to approximately 2.5 hours. A. Experiment 1 – Pure random This experiment consists in generate solutions from random initialize using the parameters from the table III. The obtained results were the following and the result alternative is shown in figure 5: VPL 340 840 442.80 (US$) Recovered oil 1.409 × 10⁸ (bbl)
Figure 6.
Obtained wells layout: experiment 02
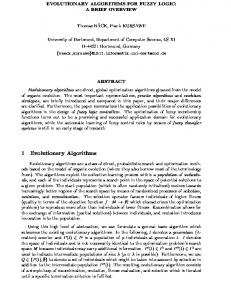
The wells layout in experiment 2 is quite similar to initial seed; only a few differences can be found in wells that were shifted: VINJ2: (7,2) shifted to (8,1) HPRO4: (6,12,2) shifted to (5,12,2) HPRO5: (30,10,1) shifted to (30, 9, 2) and no horizontal well was modified in length or direction. Even with these few changes, the recovered oil has reached an increase of 5.8 millions of barrels (1.7%up) if compared to the original alternative. C. Experiment 3 – quality and aquifer maps This experiment uses quality and aquifer maps as criteria to initialize the first population X0 , and the solution obtained in experiment 2 as initial seed. Figure 7 shows a 3D view of the quality and aquifer maps, for the reservoir used in this study. Mapa de Aquifero
1
1
0.8
0.8
0.6
0.6 Q
Quality
Mapa de Qualidade
0.4
0.4
0.2
0.2 0
Figure 5.
Obtained wells layout: experiment 01
30
40
45
50
55
0 30
40
20
25
20
I
5 0
25 20 15
10
10 0
50
30
20 15
10
45
35
35 30
J
I
10 0
5 0
J
B. Experiment 2 – initial seed This experiment consists in generate solutions using the result obtained by experiment 1 as an initial seed; the results shows in figure 6. VPL 346 633 395.80 (US$) Recovered oil 1.418 × 10⁸ (bbl)
Figure 7.
Quality map (left) and aquifer maps (right)
The results obtained are: VPL 346 633 395.80 (US$) Recovered oil 1.418 × 10⁸ (bbl) and the figure 8 shows the wells-layout. The obtained result
55
R EFERENCES [1] A. C. Bittencourt and R. N. Horne, “Spe38395, reservoir development and design optimization,” in Presented at the SPE Annual Technical Conference and xhibition, october 1997. [2] A. Wetzel, “Optimizing hydrocarbon field development using a genetic algorithm based approach,” Ph.D. dissertation, Stanford University, Stanford, CA, USA, 1997. [3] R. Brealey, S. Myers, and F. Allen, Principles of corporate finance, ser. The Irwin/McGraw-Hill series in finance, insurance, and real estate. McGraw-Hill/Irwin, 2008. [Online]. Available: http://books.google.com/books? id=6CJvPwAACAAJ [4] D. E. Goldberg, Genetic algorithms in search, optimization, and machine learning, ser. Artificial Intelligence. Reading, MA: Addison-Wesley Publishing Company, 1989.
Figure 8.
Obtained wells layout: experiment 03
for this experiment is remarkably better to the previous experiments. The NPV value is superior to the NPV of experience 2 in about 44 753 847.20 US$, meaning a profit of 11.43%. This solution reveals an interesting detail: the evolutionary algorithm keeps an injector well into middle of aquifer, being this well placed according to the aquifer map criterion. IV. C ONCLUSION This work shows the modeling and development of an optimization system to optimize alternatives of oil fields development, where an evolutionary algorithm was used as an optimization strategy to obtain good solutions. The parallel environment was used to divide the computational effort requested to evaluate the alternatives during the optimization process between several processors into local network. Although it was employed relatively simple reservoirs configurations in the performed experiments, the optimization system is capable to perform optimizations in more complex and more realistic reservoir models. Furthermore, the modeled system allows dealing some particularities of alternatives development problem as: • wells type: producers and injectors; • wells trajectory: verticals and horizontals; • maximum number of wells • some constrains defined by expert as: minimal wells distance, trajectories always into oil field grid and null blocks. On the other hand, the optimization system can use information provided by an expert as initial seed and information from maps of aquifer quality, which is used as a form of directing the first population initializing.
[5] E. Cant´u-Paz, Efficient and Accurate Parallel Genetic Algorithms. Norwell, MA, USA: Kluwer Academic Publishers, 2000. [6] P. S. da Cruz, R. N. Horne, and C. V. Deutsch, “The quality map: A tool for reservoir uncertainty quantification and decision making,” SPE Reservoir Evaluation & Engineering, vol. 7, pp. 6–14, Febraury 2004. [7] Y. J. T´upac, “Sistema inteligente de otimizac¸a˜ o de alternativas (in portuguese),” Ph.D. dissertation, Pontif´ıcia Universidade Cat´olica do Rio de Janeiro, Rio de Janeiro, RJ, Brasil, 2005. [8] R. S. Zebulum, M. A. Pacheco, and M. M. B. R. Vellasco, Evolutionary Electronics: Automatic Design of Electronic Circuits and Systems by Genetic Algorithms. CRC Press, 2002. [9] L. Faletti, “Otimizac¸a˜ o de alternativas para desenvolvimento de campo de petr´oleo usando computac¸a˜ o evolucion´aria (in portuguese),” Master’s thesis, Departamento de Engenharia El´etrica, Pontif´ıa Universidade Cat´olica do Rio de Janeiro, Rio de Janeiro, Brasil, 2003. [10] Z. Michalewicz, Genetic Algorithms + Data Structures = Evolution Programs, 3rd ed. New York: Springer-Verlag, 1996. [11] CMG, “IMEX: advanced oil/gas reservoir simulator version 2009 user’s guide,” Computer Modelling Group (CMG), Tech. Rep., 2009. [12] A. A. Emerick, Y. T´upac, L. Faletti, M. Pacheco, M. Vellasco, and R. Portella, Intelligent Systems in Oil Field Development Under Uncertainty, ser. Studies in Computational Intelligence. Heidelberg: Springer Berlin, 2009, ch. Intelligent optimization system for selecting alternatives for oil field exploration by means of evolutionary computation, pp. 97– 137. [13] OMG Headquarters, “Commom object request broker architecture (CORBA) specification, version 3.1,” Objects Management Group (OMG), Tech. Rep., january 2008.