Journal of Experimental Psychology: Human Perception and Performance 2004, Vol. 30, No. 1, 3–27
Copyright 2004 by the American Psychological Association, Inc. 0096-1523/04/$12.00 DOI: 10.1037/0096-1523.30.1.3
Parallel Processing in Visual Search Asymmetry Barbara Anne Dosher and Songmei Han
Zhong-Lin Lu
University of California, Irvine
University of Southern California
The difficulty of visual search may depend on assignment of the same visual elements as targets and distractors—search asymmetry. Easy C-in-O searches and difficult O-in-C searches are often associated with parallel and serial search, respectively. Here, the time course of visual search was measured for both tasks with speed–accuracy methods. The time courses of the 2 tasks were similar and independent of display size. New probabilistic parallel and serial search models and sophisticated-guessing variants made predictions about time course and accuracy of visual search. The probabilistic parallel model provided an excellent account of the data, but the serial model did not. Asymptotic search accuracies and display size effects were consistent with a signal-detection analysis, with lower variance encoding of Cs than Os. In the absence of eye movements, asymmetric visual search, long considered an example of serial deployment of covert attention, is qualitatively and quantitatively consistent with parallel search processes.
In search asymmetries, the “easy” search (e.g., C in Os) leads to search times (and errors) that increase modestly or not at all with display size; in contrast, the “hard” search (i.e., O in Cs) leads to search times (and errors) that increase substantially with display size. Search asymmetry situations are important for distinguishing models of attention and visual search because, in them, tasks differ only in the assignment of target and distractor. In contrast, other manipulations of search difficulty, such as distractor heterogeneity or conjunction search (Eckstein, 1998), are associated with changes in the ensemble of stimuli or the relationship between stimuli. Search asymmetries have been of great theoretical interest (e.g., Nagy & Cone, 1996; Rosenholtz, 2001; Rubenstein & Sagi, 1990; Treisman & Gormican, 1988; Williams & Julesz, 1992; Wolfe, 2001). Search asymmetries have variously been attributed to preattentive feature processing and feature prototypicality (Treisman & Gormican, 1988), transmission time in feature detection channels (Nagy & Cone, 1996), epiphenomenal experimental design asymmetries (Rosenholtz, 2001), and the variance properties of early visual analysis (Rubenstein & Sagi, 1990). Below, we revisit these theoretical positions in light of the current analysis of the time course and accuracy of visual search.
In visual search tasks, observers are instructed to find a target item among a set of distractors in a display. The relative difficulty of search among different distractor environments has informed the development of models of visual processing (Neisser, 1967; Sperling, Budiansky, Spivak, & Johnson, 1971; Treisman & Gelade, 1980). Asymmetries in search have been especially central in relating search to feature analysis in early vision (Treisman & Gormican, 1988). A search asymmetry occurs when search difficulty, as measured by response time (RT) and/or accuracy, depends strongly on the assignment of the same two items as either target or distractor. For example, it is easier to find a tilted line target among vertical line distractors than to find a vertical line target among tilted line distractors, and it is easier to find a C in Os than to find an O in Cs (Treisman & Gormican, 1988; Wolfe & Friedman-Hill, 1992). These asymmetries are often argued to reveal the valence of coded features along important dimensions of visual analysis. The vertical-tilted asymmetry has been interpreted as evidence that feature analyzers in early stages of visual processing detect deviations from the vertical (Wolfe, Friedman-Hill, Stewart, & O’Connell, 1992), and the C–O asymmetry has been interpreted as evidence for detectors that respond to a break in a closed figure (Treisman & Gormican, 1988).
Models of Visual Search Visual search times and/or accuracies that are independent, or nearly independent, of the number of elements in the display are generally attributed to parallel search, a mode of search that operates simultaneously without limitation across the entire visual field. In contrast, when search times increase and/or search accuracies decrease with increasing display size, this effect is frequently attributed to the serial deployment of attention to items. Serial processing models have been developed to account for display-size effects in visual search. In feature integration theory (FIT; Treisman & Gelade, 1980), serial search processes operate randomly over items or groups of items in the entire display. In selective search models (Dosher, 1998; Egeth, Virzi, & Garbart, 1984), serial processes operate randomly over a specific subset of
Barbara Anne Dosher and Songmei Han, Memory, Attention, Perception Laboratory, Department of Cognitive Sciences and Institute for Mathematical Behavioral Sciences, University of California, Irvine; Zhong-Lin Lu, Laboratory of Brain Processes, Department of Psychology, University of Southern California. This research was supported by grants from the Air Force Office of Scientific Research, Life Sciences Program to Barbara Anne Dosher and Zhong-Lin Lu and by a summer fellowship of the Institute for Mathematical Behavioral Sciences to Songmei Han. Correspondence concerning this article should be addressed to Barbara Anne Dosher, Department of Cognitive Sciences, 3151 SSPA, University of California, Irvine, CA 92697-5100, or Zhong-Lin Lu, Department of Psychology, SGM 501, University of Southern California, Los Angeles, CA 90089-1061. E-mail:
[email protected] or
[email protected] 3
4
DOSHER, HAN, AND LU
items in the display. In guided search models (GSMs; Cave & Wolfe, 1990; Wolfe, 1994), serial search processes operate over a subset of items determined by a noisy preattentive parallel evaluation process that reflects both bottom-up salience and top-down task relevance. All of these models assume a two-stage architecture in which attention is associated with a serial processing stage, although in fact the data are ambiguous (serial and parallel processes may mimic one another in accounting for mean RT; Townsend & Ashby, 1983). Serial search models are often supported and tested using RT paradigms (e.g., Cave & Wolfe, 1990; Treisman, 1988) in which visual displays are available until response. The eye-movement strategy of the observer is uncontrolled in these paradigms. When eye-movement strategies are not controlled, RT results include unknown contributions of eye movements, yet models generally interpret observed RTs solely in relation to covert visual attention processes rather than movements of the eye. The potential role of eye movements (overt shifts of attention) in visual search is not explicitly considered in the FIT, SSM, or GSM serial attention models (see also Pashler, 1987). An alternative theoretical approach to visual search explains the impact of display size on search performance in terms of sensory and/or decision limits on discrimination (Duncan & Humphreys, 1989; Eckstein, 1998; Palmer, Ames, & Lindsey, 1993). Displaysize effects in search performance may be a simple statistical consequence of integrating more sources of information or statistical decision effects in these models (Eckstein, 1998; Palmer, 1994; Palmer, Verghese, & Pavel, 2000; Shaw, 1982; Sperling & Dosher, 1986). In signal-detection models, statistical decision effects on accuracy occur due to an increased potential for errors in larger display sizes. Signal-detection models are generally tested in response-accuracy paradigms with brief displays that preclude eye movements. In short, analysis of the accuracy of visual search in brief displays has, with few exceptions, been fully consistent with unlimited-capacity signal-detection models (e.g., Palmer, 1994). However, accuracy studies have generally not measured the temporal properties of visual search but have focused instead on accuracy limitations, whereas RT evidence in long-duration visual displays has been associated with serial processing, which focuses on temporal limitations. But even unlimited-capacity signaldetection results in search accuracy may be consistent with a wide range of temporal search processes: (a) unlimited-parallel models (Sperling & Dosher, 1986; Palmer et al., 2000), (b) parallel processing models in which limited capacity is shared among items in the display (Murdock, 1971; Rumelhart, 1970; Shaw & Shaw, 1977; Townsend & Ashby, 1983), or (c) serial processing models (Treisman & Gelade, 1980). A simultaneous analysis of the time course and accuracy of visual search is essential to a full understanding of the processes underlying visual search.
time-limited displays that eliminated the possibility of eye movements. The restriction to brief displays without eye movements is consistent with recent research focused on visual search accuracy alone (e.g., Palmer, 1994; Palmer et al., 2000). In the brief, 50 –100-ms displays used in the present experiments, visual information may have been available for as long as 250 –500 ms after display offset (Sperling, 1960), yielding a period of 300 – 600 ms in which visual information was available for processing. Serial processes of covert attention are often estimated at 15– 45 ms per item comparison (e.g., simple FIT).1 In relation to such estimates, the period of availability of visual information in brief visual displays allows for several covert shifts of attention. Conversely, the RTs in unlimited-time, free viewing displays allow ample time for several shifts in eye fixation.
Overview In this article, the time course of covert visual attention in a classic example of search asymmetry is shown to be fully compatible with a probabilistic parallel search model. Serial and parallel search models are distinguished by an analysis of the full time course of visual search using speed–accuracy trade-off (SAT) methods. New probabilistic parallel and serial search models are developed that integrate comparison errors (misses of targets and false alarms to distractors) into the predicted time course of visual search. The models differ from one another only in their simultaneous (parallel) or sequential (serial) natures of item evaluation. The probabilistic models were developed in order to provide the best possible chance for the serial model to account for search performance and to provide a detailed test of a parallel model. Previously developed simple serial models overpredict the magnitude of the differences in time course associated with differences in display size. The new probabilistic models distinguish architectures of visual analysis and provide new insights into the nature of search asymmetry. Experiment 1 documented a typical pattern of asymmetric visual search in the standard RT paradigm—with displays available until response, uncontrolled eye movement, and unpracticed observers—in specially controlled annular displays that equated eccentricity and used homogeneous distractors. Experiment 2 used the speed–accuracy paradigm to evaluate the processes of visual search in brief displays that controlled eye movements. The SAT data allowed tests of the elaborated serial and elaborated parallel models and of “Bayesian” or sophisticated-guessing variants. Experiment 3 measured the pattern of RTs for the observers of Experiment 2 in order to document that even after the thousands of trials of the SAT experiment, the pattern of standard RTs was similar to that found with unpracticed observers.
Characterizing Covert Attention in Visual Search 1
Our goal is to characterize and model both the time course and the accuracy of the processes of covert attention during visual search—that is, to evaluate the mechanisms of attention in the absence of eye movements. Covert attention refers to shifts in attention or distribution of attention in the absence of eye movements. In contrast, overt attention processes involve shifts in eye fixation. Covert attention was isolated in this study by the use of
Some estimates of the time to shift attention are much longer. The latency (plus initial transition) of voluntary attention shifts have been estimated by some researchers to require 0.3– 0.5 s (Sperling & Weichselgartner, 1995). If these longer estimates are correct, then our brief displays would reflect information uptake during a single state (distribution) of voluntary covert attention. However, these estimates are based on very different paradigms and would also, by assumption, rule out FIT, SSM, and GSM in their current forms.
PARALLEL ASYMMETRIC SEARCH
Discriminating Parallel and Serial Processes in Visual Search SAT Analysis of Time Course Characterizing the processes of attention requires the evaluation of both temporal properties and accuracy of performance, going beyond the characterization focused on RT (i.e., Treisman & Gelade, 1980) alone or search accuracy (percentage correct, or d⬘) alone as a dependent measure (i.e., Palmer, 1995; Shaw, 1982). In this article, an SAT analysis is used to evaluate both the speed and the accuracy of visual search (see also Dosher, Han, & Lu, 1998; McElree & Carrasco, 1999; Sutter & Graham, 1995; Sutter & Hwang, 1999). SAT methods provide a joint assessment of processing time and accuracy (Dosher, 1976, 1979, 1981, 1982, 1984; McElree & Dosher, 1989, 1993) over the full time course of visual search, and they provide stronger tests of both serial and parallel processing architectures than are possible using mean RTs alone or accuracy alone. In the SAT paradigm, the observer is interrupted by a cue to respond (response cue) at one of several times after display onset. The cue times span the full time course of processing, about 0.1–2.0 s in the case of visual search. Observers are instructed to respond as quickly as possible following the response cue, and accuracy is a dependent measure. This paradigm yields characteristic functions of accuracy, usually measured by d⬘ (a bias-free measure of discrimination accuracy) as a function of processing time (measured as the time from display onset to the average RT or total processing time). Figure 1 shows typical time–accuracy functions, with associated performance from a standard RT condition. The time–accuracy functions are shown as smooth curves in the figure but are generally measured by 5–9 points along the time-course function. Standard RTs provide only partial information about the time course of processing (see Figure 1). RT differences may correspond to differences in processing time, limiting accuracy, or both.2 In many cases, standard RTs reflect asymptotic accuracy or the limiting accuracy at long processing times (e.g., Dosher, 1984; Dosher & McElree, 1992; McElree & Dosher, 1989), whereas the dynamics of processing, as measured by the fast-rising portion of the speed–accuracy function, are comparable over conditions (e.g., Figure 1A). Parallel search mechanisms may mimic the mean RT patterns of serial search mechanisms in standard RT paradigms (Luce, 1986; Murdock, 1971; Townsend & Ashby, 1983), whereas SAT data may distinguish between serial and unlimited parallel mechanisms by revealing the slower or equivalent full time courses in different conditions (Dosher, 1976; McElree & Dosher, 1989). The full time course measurements from SAT paradigms reveal separately the dynamics of visual search and the asymptotic accuracy limitations in visual search. In this article, full timecourse data are used to evaluate newly developed probabilistic models of serial and parallel search as well as variants that incorporate sophisticated guessing. Serial processing models. Serial processing models predict systematic slowing of the dynamics of processing—more gradual rising portions of the time-course functions—at larger display sizes (Dosher, 1976; Dosher & McElree, 1992; McElree & Carrasco, 1999; McElree & Dosher, 1989, 1993). In visual search, additional stages of serial processing are associated with increased display load. A simple model of serial processing (McElree & Dosher, 1993) assumes that each serial comparison has an expo-
5
nential latency (with time constant determining the time distribution for each individual comparison), so that the completion times for a serial search composed of a given number of comparisons are described by a gamma distribution with corresponding stage parameter (␣). Time–accuracy (or SAT) functions reflect the cumulative distribution of completion times of the whole search process. The cumulative density function of the gamma distribution is P共T ⬍ t兲 ⫽
1 共 ␣ ⫺ 1兲! ␣
冕
t
e⫺t⬘/ t⬘ ␣ ⫺1 dt⬘,
t ⬎ 0, else 0.
(1)
0
This function is denoted in this article by G(t兩, ␣), which may be generalized to include a shift by a base time (␦). Serial visual search terminates when a target is detected. If a target is present, and a serial process is deployed randomly over the display items, the target might be found first, second, etc. On average, performance would reflect a probabilistic mixture of 1through n-comparison serial processes (a mixture of ␣ ⫽ 1, ␣ ⫽ 2, . . . , ␣ ⫽ n). If there is no target in the display, accurate search would require processing all items in the display, and performance would reflect the display size (␣ ⫽ n). On SAT trials in which the cue to respond occurs before the search process has yielded information, the observer guesses randomly. Figure 2 shows the predicted time course of visual search for the simple serial process model for display sizes of 4 and 12 (see McElree & Carrasco, 1999; McElree & Dosher, 1989). The slower search process corresponding to serial search for a display size of 12 is seen in the slower rise time of the SAT function. The effect of display size on the rise time is an important signature of serial models. Parallel processing models. Unlike serial models, which assume that attention-demanding comparison operations are deployed at different display locations in succession, in parallel processing models, comparison operations begin at all display locations simultaneously, although the evaluation of different locations may finish at different times (e.g., Townsend & Ashby, 1983). Unlimited-capacity parallel mechanisms may predict little or no variation in search time as a function of the number of items if the decision rule is especially simple. Modest slowing as a function of the number of parallel comparisons may occur if the decision rule requires waiting for several simultaneous comparison processes to complete (e.g., McElree & Dosher, 1989; Ratcliff, 1978). Finally, parallel models may predict much slower dynamics associated with more comparisons if the processes operating simultaneously compete for limited-capacity resources and thus mimic serial models in processing dynamics (and they may yield different predictions for performance under certain conditions, such as for multiple-target displays [Miller, 1991; Townsend & Ashby, 1983]). In this article, we compare unlimited-capacity parallel models to serial models. SAT and visual search. McElree and Carrasco (1999) were the first to apply speed–accuracy methods to visual search. They compared easy orientation feature searches with more difficult orientation and color conjunction searches. Conjunction search 2 The time–accuracy (or SAT) functions may reflect either a continuous accrual of information over time or the cumulative distribution of completion times of a discrete process (e.g., Dosher, 1976, 1979, 1981).
6
DOSHER, HAN, AND LU
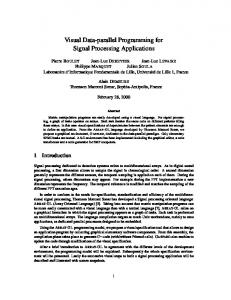
Figure 1. Four sets of hypothetical speed–accuracy trade-off curves consistent with the same response time (RT) data. (Based on Figure 12 from “Effect of Sentence Size and Network Distance on Retrieval Speed,” by B. Dosher, 1982, Journal of Experimental Psychology: Learning, Memory, and Cognition, 8, p. 199. Copyright 1982 by the American Psychological Association. Adapted with permission.) Each curve is an exponential approach to a limit, characterized by intercept, rate, and asymptote. Experimentally, this would be estimated from 5 to 7 points (not shown) on the time–accuracy functions. RT data (shown here as open circles) for Condition A are superior to (shorter and more accurate than) those for Condition B. Yet this is consistent with underlying processes that differ only in asymptote (A), only in rate (B), only in intercept (C), or in all three (D). A: Conditions A and B have the same intercept and rate and differ only in asymptotic accuracy. B: Conditions A and B have the same intercept and asymptote and differ only in rate. C: Conditions A and B have the same rate and asymptote and differ only in intercept. D: Conditions A and B differ in intercept, rate, and asymptote.
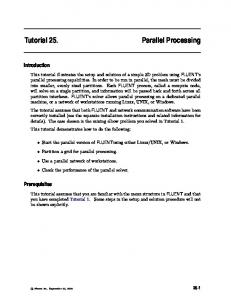
Figure 2. The predictions of a simple serial search model for display sizes of 4 and 12. Visual search completes after the ith comparison with probability 1/n for target-present trials and after the nth comparison for target-absent trials. Thus, accuracy is modeled with probabilistic mixtures of 1- to n-comparison gamma distributions. (In this example, initial time offset t0 ⫽ 150 ms; ⫽ 75 ms; a ⫽ 1 . . . 4, or 1 . . . 12; asymptotes scaled at 3.3 and 2.1 d⬘, respectively, for display sizes of 4 and 12.) The dashed lines indicate the point where the curves reach 2⁄3 of asymptote.
exhibited slower processing for displays with larger numbers of items, whereas feature searches were relatively unaffected by display load. The degree of slowing in the time dynamics of search for large display sizes in conjunction searches was argued to be larger than expected for an unlimited-capacity parallel model. On this basis, feature and conjunction searches were both said to reflect parallel processes, with conjunction searches showing greater than expected sensitivity to display load. However, no parallel models were evaluated directly for fit to the data. We elaborate the simple serial model to incorporate identification errors into the time-course predictions, and we provide an analogous parallel model of visual search. The simple serial model has overpredicted the impact of the number of items on visual search dynamics, even for a difficult conjunction search (McElree & Carrasco, 1999). The elaborated serial model provides the best possible opportunity for the serial model to fit time-course data with only modest display size effects, because it reduces the predicted impact of display size. The elaborated parallel model is exactly analogous to the serial model and also allows a direct quantitative analysis of the parallel processing architecture. Asymmetric visual search was chosen for the first applications and tests of the models because search asymmetry is a very simple design theoretically, involving only role reversal of two stimuli. In
PARALLEL ASYMMETRIC SEARCH
contrast, the conjunction search or other searches with mixtures of distinct distractors may be subject to a range of subset selection mechanisms (Dosher, 1998; Egeth et al., 1984). Decision models might need to be elaborated further if different subsets of distractors are processed at different speeds or with different accuracies. A related application of the models (Dosher, Han, & Lu, 2003) has compared visual search with homogeneous and heterogeneous distractors.
positive information state (correctly or in error) by time t following display onset is P⫹ 共t兩TP兲 ⫽
⫹
Elaborated Models With Comparison Error and Guessing In this article, we develop probabilistic serial and parallel search models that incorporate error-prone visual comparison processes and guessing. The probabilistic models incorporate the impact of errors on the time course of visual search. Errors that lead to (a) incorrect early target “detection” (false alarms) and rapid completion and (b) overlooked targets (misses) and unnecessarily prolonged searches impact the predicted magnitude of processingtime differences as a function of display size. As such, these models are among the first to fully incorporate accuracy and time course into the same model of visual search. Prior signal-detection models of visual search—to which these models are strongly related—were pure accuracy models that could not account for processing times. Early attention models (e.g., the feature integration model) were pure time models that could not account for error patterns. These new search models are broadly cast in a signaldetection framework. In this case, errors may arise from three sources: misclassification of a target element, misclassification of some distractor element, or guessing in cases in which no information is yet available.3 Probabilistic serial search model. Figure 3 shows a schematic of a probabilistic serial comparison model of visual search. In the elaborated probabilistic serial model, each item in a display is searched successively in a random order. Each comparison has some probability of correctly classifying the display item, which may depend on the item type ( pj for j ⫽ target or distractor). Initially, the observer is in a neutral, or guessing, state. Classifying an item (correctly or incorrectly) as a target moves the observer into a positive information state; the negative information state is entered when all items in the display are classified (correctly or incorrectly) as nontargets. The time per comparison is, by assumption, distributed exponentially (with time constant ). This yields a search process that is a probabilistic mixture of gamma densities with different numbers of comparison processes (␣), G(t兩, ␣). For the elaborated model, unlike the simple serial model, overall performance is not simply an equal mixture of finding the target first, second, and so on, for target-present displays and an N-stage search in the targetabsent displays (where N is the number of display items), but instead it is a model-determined weighted mixture. For targetabsent displays, it is possible to incorrectly complete the decision after a single comparison if a display item is incorrectly classified as a target. For target-present displays, the target may be overlooked and correct responses may reflect false positives to distractor elements. The elaborated serial model implements a calculated probabilistic weighting rule that incorporates errors and determines both the completion time and the accuracy of the search. Let PT and PD be the probabilities of correctly identifying a target and a distractor, respectively, and N be the display size. For displays containing the target, the probability of entering the
7
⫹
冋 冋
1 N 1 N
冋
1 N
冘冘 N
冘 N
m⫽1
册
m⫺2
pDk 共1 ⫺ pD 兲G共t兩 , k ⫹ 1兲
m⫽2 k⫽0
冘冘
N⫺1 N⫺m⫺1
m⫽1
pDm⫺1 pT G共t兩 , m兲
k⫽0
册
册
pDm⫺1 共1 ⫺ pT 兲pDk 共1 ⫺ pD 兲G共t兩 , m ⫹ k ⫹ 1兲 . (2)
The three terms of the equation correspond to the three possible classes of events: (a) correct identification of the target and also correct classification of all distractors evaluated prior to the target, (b) incorrect identification of a distractor as a target prior to consideration of the target, and (c) incorrect identification of some distractor as a target following correct identification of all distractors processed prior to the target and a miss of the target. This equation basically counts various cases and their probabilities (at t 3 ⬁) and then further evaluates the probability of having achieved an outcome by some time t. The probability of any combination of events is composed of the probabilities of each element (target and distractors) ultimately going to accurate or inaccurate identification, which is reflected by successful target processing, PT, unsuccessful target processing (1 ⫺ PT), successful distractor processing PDk , and unsuccessful distractor processing (1 ⫺ PD), where the superscript k is the power indicating the number of successfully or unsuccessfully identified distractors. Index m is the position in the search order in which the target location is examined (1st, 2nd, . . .). The remaining portions of the equation calculate the probability of having completed m stages by time t with time constant , G(t兩, m). (An additional fixed contribution to completion time, reflecting encoding and response T0, may be included to shift this equation by T0 [i.e., t ⫽ t⬘ ⫺ T0, for t⬘ ⬎ T0].) Part a of the equation (as delineated in the previous paragraph) counts cases in which the target is correctly identified (and search completed) in position m following m ⫺ 1 correctly identified distractors. This term sums over each of the N possible values of m, each with probability 1/N. The probability of each m⫺1 case is pD pT multiplied by the probability of having completed the m stages by time t, G(t兩, m). Part b of the equation deals with cases in which a distractor is incorrectly identified as a target (leading to the correct response but for the wrong reason) before the target is processed. If the target were evaluated in Position 1, it would not be possible to have previously misidentified a distractor (so the index m runs from 2 to N), and there may have been between k ⫽ 0 and k ⫽ m ⫺ 2 distractors that were correctly k identified before a distractor was misidentified [pD (1 ⫺ pD)], multiplied by the probability of having completed k ⫹ 1 comparisons by time t. Part c of the equation considers the cases in which a distractor is incorrectly identified as a target (leading to the correct response but for the wrong reason) after the target is 3
These models are not equivalent to high-threshold models, because it is possible to misclassify nontargets as targets.
DOSHER, HAN, AND LU
8
Figure 3. The elaborated probabilistic serial search model. Display elements are evaluated serially and in random order. PT and PD are the probability of correctly identifying a target (C) and distractor (O), respectively. The observer begins in the neutral information state (S0) and enters the positive information state (S⫹) when the target or any distractor (in error) is identified as a target or enters the negative information state (S⫺) when the target (in error) and/or all of the distractors are identified as distractors. The search times are drawn from a gamma distribution with an order determined probabilistically by the error-prone process. g is the probability of guessing yes in the no-information state. Y ⫽ yes; N ⫽ no.
processed but missed. In this case, m ⫺ 1 distractors are correctly processed prior to the processing of the missed target in search position m, followed by k distractors correctly processed after the missed target, and finally by the incorrectly identified distractor. The only other case is that in which all distractors are processed correctly and the target is missed, but this leads to the negative information state, which is considered next. The probability of entering the negative information state for displays containing a target requires that all distractors be correctly identified and that the target is misidentified (all comparisons end without identifying an element as a target): that is, P⫺ 共t兩TP兲 ⫽ pDN⫺1 共1 ⫺ pt兲G共t兩 , N兲.
(3)
For displays without a target, the formulations are simpler because it is not necessary to count cases with a target element separately. Without a target, the probability of entering the positive information state (in error) counts cases in which the error occurs in Position 1 to Position N and the probability of having completed m comparisons by time t. This leads to
冘 N
⫹
P 共t兩TA兲 ⫽
pDm⫺1 共1 ⫺ pD 兲G共t兩 , m兲.
(4)
m⫽1
Here, m is the first process in which a distractor is incorrectly identified as a target. For displays without a target, the probability of entering the negative information state requires all distractors to be correctly so identified. This leads to P⫺ 共t兩TA兲 ⫽ pDN G共t兩 , N兲.
(5)
Finally, the probability of yes and no responses is calculated by assuming that the observers say “yes” when in the positive information state, say “no” when in the negative information state, and otherwise guess “yes” with probability g: Pyes 共t兩TP or TA兲 ⫽ P⫹ 共t兩TP or TA兲 ⫹ g关1 ⫺ P⫹ 共t兩TP or TA兲 ⫺ P⫺ 共t兩TP or TA兲兴, and
(6)
Pno 共t兩TP or TA兲 ⫽ P⫺ 共t兩TP or TA兲 ⫹ 共1 ⫺ g兲关1 ⫺ P⫺ 共t兩TP or TA兲 ⫺ P⫹ 共t兩TP or TA兲兴.
(7)
A measure of bias-free accuracy, d⬘, for the model is calculated from the predicted hit and false alarm rates as a function of processing time: d⬘ ⫽ Z(Pyes) ⫺ Z(1 ⫺ Pno). This development assumes that guessing is constant throughout the time course of the search. An elaboration of this model that includes “Bayesian” (sophisticated) guessing based on the number of comparisons completed without finding a target, detailed in the Appendix, is also developed and evaluated in more detail in Experiment 2. The asymptotic levels of the model SAT functions are fully consistent with signaldetection theory. Probabilistic parallel model. An elaborated parallel search model, analogous to the elaborated serial search model, was developed (Figure 4). The accuracy of visual search (Eckstein, 1998; Palmer, 1994; Palmer et al., 2000; Shaw, 1982; Sperling & Dosher, 1986) follows a signal-detection model, in which display-size effects are accounted for by the inclusion of an increased number of sources of information. In this account of display-size effects, perceptual coding of individual items is unaffected by the display size (the coding capacity is unlimited), and reduced accuracy in larger display sizes solely reflects the statistics of information integration. In addition to assuming unlimited-capacity perceptual encoding, the model developed here also assumes unlimitedcapacity parallel temporal dynamics in that the speed of processing individual items does not depend on the number of elements in the display. In the parallel model, all comparisons begin simultaneously. The observer enters the positive information state when any comparison identifies a target (correctly or in error) and enters the negative information state once all items are identified (correctly or in error) as nontargets. PT and PD are the probability of correctly identifying a target and distractor, respectively, and N is the display size. Here, G(t兩, ␣) simply denotes the finishing-time
PARALLEL ASYMMETRIC SEARCH
9
Figure 4. The elaborated probabilistic parallel search model. Display elements are evaluated in parallel at the same time. PT and PD are the probability of correctly identifying a target (C) and distractor (O), respectively. The observer begins in the neutral information state (S0) and enters the positive information state (S⫹) when the target or the first of any distractors (in error) is identified as a target or enters the negative information state (S⫺) when the target (in error) and/or the last of all of the distractors is identified as a distractor. Completion times for each evaluation are drawn from a gamma distribution. g is the probability of guessing yes in the no-information state. Y ⫽ yes; N ⫽ no.
distribution for each comparison.4 Then, the probability of entering a positive information state for displays with a target is
冘冉
N⫺1
P⫹ 共t兩TP兲 ⫽
m⫽0
共N ⫺ 1兲! p pN⫺m⫺1 共1 ⫺ pD 兲 m m!共N ⫺ m ⫺ 1兲! T D
冊 冘冋 N⫺1
⫻ 兵1 ⫺ 关1 ⫺ G共t兩 , ␣ 兲兴 m⫹1 其 ⫹
m⫽1
potential misidentified distractor searches. Hence, the probability of entering a positive information state for displays without a target is
冘 N
P⫹ 共t兩TA兲 ⫽
m⫽1
共N ⫺ 1兲! m!共N ⫺ m ⫺ 1兲!
册
⫻ 共1 ⫺ pT 兲pDN⫺m⫺1 共1 ⫺ pD 兲 m共1 ⫺ 共1 ⫺ G共t兩 , ␣ 兲兲 m兲 .
⫻ 兵1 ⫺ 关1 ⫺ G共t兩 , ␣ 兲兴 m其.
(8)
This equation5 counts the cases in which the target is either correctly identified or not and the cases in which there are m (potentially) misidentified distractors.6 The factorial notation counts all the cases (m ⫽ 0 to m ⫽ N ⫺ 1) to calculate the probability of each state. These refer to latent processes that would ultimately complete correctly or in error, some of which may not actually run to completion if the first target-present element evaluation completes (correctly or in error) earlier. The timing is then implemented as a race model—the probability of having completed at least one of the elements (latently) identified (correctly or in error) as a target by time t is 1 minus the probability of all the m (latently) misidentified distractors (plus the target in some cases) having not yet completed by time t(1 ⫺ (1 ⫺ G(t兩, ␣))m⫹1). The first part of the equation considers cases in which the target would be correctly identified, and the second part considers cases in which the target would be incorrectly identified. Entering the negative information state requires that all items be classified (correctly or in error) as distractors and that all of these classifications are complete. Since there is only one case that meets this definition, the probability of entering a negative information state for displays with a target is simply P⫺ 共t兩TP兲 ⫽ 共1 ⫺ pT 兲pDN⫺1 G共t兩 , ␣ 兲 N.
N! pN⫺m共1 ⫺ pD 兲 m m!共N ⫺ m兲! D
(9)
For displays without a target, the positive information state is entered as soon as any distractor is misidentified as a target. Again, cases are counted for m (potential) misidentifications, and the time to the first (error) target identification is a race between the m
(10)
For displays without a target, the negative information state is entered if all N distractors are correctly identified and when the processing of all N items is complete. There is only one such case. The probability of entering the negative information state by time t is P⫺ 共t兩TA兲 ⫽ pDN G共t兩 , ␣ 兲 N.
(11)
Finally, as in the serial model, guessing operates according to the rules specified in Equations 6 and 7. From these values, accuracy (d⬘) as a function of processing time can be computed and compared to the observed time course of visual search measured by the SAT functions.7 Again, in this model, guessing is stable throughout the time course of processing. Equations for a Bayesian sophisticated-guessing
4 The completion times for each comparison reflect a distribution with an estimated average time and shape. The distribution of completion times for each individual comparison is drawn from a gamma distribution, G(t兩, ␣). Here, the gamma distribution is merely a convenient distribution of finishing times, where the and ␣ determine the mean, standard deviation, and degree of skew of the finishing-time distribution. 5 By standard convention in mathematics, the value of 0 factorial (0!) is defined as 1. 6 Because the first item to be classified as a target ends the search, this conceptualization counts cases by counting outcomes as though processes had run to completion and are known (latent outcomes) and then calculating the probability that at least one will have been classified as a target (correctly or in error) by time t. 7 In the parallel model, G(t兩, ␣) absorbs the initial encoding and RT. If an additional encoding and RT parameter T0 was used in the parallel model, it was possible to achieve an equivalent fit by setting this parameter to zero.
DOSHER, HAN, AND LU
10
model with parallel processing appear in the Appendix and are considered and compared to models without guessing in the treatment of Experiment 2.
Experiment 1: RT In this experiment, the asymmetric visual search tasks were to search for a C among Os or an O among Cs.8 Search for an O among Cs has previously been shown to yield larger RT increases as a function of display size than a search for C among Os (Triesman & Gormican, 1988). The previous reports used random displays with mixed eccentricity and heterogeneous orientations. The purpose of Experiment 1 was to replicate the search asymmetry for standard RTs under our annular, eccentricity- and densitymatched display conditions. Two variants of the C-and-O searches were evaluated, one in which the C appeared in only one orientation (gap right) and one in which the C randomly appeared in four orientations (gap right, gap left, gap up, and gap down), which is a form of distractor heterogeneity. The multiple-orientation, heterogeneous variant is the more typical. The results indicate that standard asymmetry effects could be obtained in the simpler homogeneous annular displays, which determined the test conditions for the speed–accuracy experiment (Experiment 2). In random or in grid displays, eccentricity effects may affect visual search results (Carrasco, Evert, Chang, & Katz, 1995; Carrasco, McLean, Katz, & Frieder, 1998). The average retinal eccentricity of targets in random and grid displays tends to confound eccentricity with display size, and targets in more eccentric locations are detected and identified less accurately and with longer RTs. In these studies, we chose annular displays that equated the eccentricity of all display items (see also Dosher et al., 1998). A sample trial is illustrated in Figure 5. Observers were instructed to fixate a central warning stimulus, but they were not specifically instructed to maintain fixation while searching the display (unlike in Experiment 2), which remained available until response. This corresponds with the most often tested (standard) form of the visual-search paradigm.
Method Observers. Twenty-two observers (10 in the multiorientation version in which Cs varied in orientation, 12 in the single-orientation version in which Cs were in a single orientation) participated in a 1-hr session for undergraduate course credit. All observers reported normal or correctedto-normal vision. Design. This experiment tested the C-among-Os (easy) and O-among-Cs (hard) conditions in separate blocks of trials. The tested display sizes were 4, 8, and 12 elements, arranged around an annulus to equate eccentricity and lateral interactions (see below). Half of the trials included a target and half did not. Trials with different display sizes and target presence–absence were presented in a random order. Blocks consisted of 480 trials, with 80 trials per condition. Blocks of easy and hard searches were alternated within a session. Stimuli. The stimuli consisted of Os and Cs. The O was a circle, and the C was a circle with a gap. They were rendered as grayscale images with antialiasing on a 32 ⫻ 32-pixel grid. The images were displayed on a Leading Edge Technology 1230V monitor controlled by a Vista image board on a PC computer. The stimuli subtended 0.98° ⫻ 0.98° at a viewing distance of approximately 60 cm. The elements were arranged on an annulus with radius of 4.12°. There were 15 possible equally spaced positions on the annulus, but the location of these positions was randomized (the annulus was rotated randomly) on each trial (see Figure 5).
Elements of displays of Size 4 were positioned at four adjacent locations; displays of Size 8 consisted of two sets of elements in four adjacent locations, with a one-location space separating the sets; displays of Size 12 consisted of three sets of elements in four adjacent locations, with a space between sets. This arrangement equated eccentricity and the lateral interactions for all displays (i.e., one half of elements were adjacent to a space, and one half were internal items). Finally, the fine position of each element was randomly “jittered” (a uniform distribution from ⫺4 to 4 pixels) in the horizontal and vertical directions. This fine position jittering is often used to minimize global contour cues. RT was measured from onset of the display until response. Procedure. The search type, C-in-Os or O-in-Cs, was blocked. A fixation plus sign appeared for 250 ms, followed by the test display, which remained available until the observer responded by pressing the J key for target-present trials or the F key for target-absent trials. Observers were instructed to respond “as quickly and accurately as possible.”
Results The results of the standard RT experiments are shown in Figure 6. As expected, searching for an O in Cs was more difficult than searching for a C in Os for both the multiple-orientation and single-orientation versions of the experiment. An analysis of variance (ANOVA) of the heterogeneousorientation RT data (Figures 6A and 6B) yielded significant effects of the type of search (C-in-O vs. O-in-C), F(1, 9) ⫽ 40.29, p ⬍ .01; target presence, F(1, 9) ⫽ 39.94, p ⬍ .01; display size, F(2, 18) ⫽ 51.42, p ⬍ .01; and all interactions (all ps ⬍ .01). An analysis of the accuracy data exhibited small but significant differences in the proportion of errors for target presence (0.98 vs. 0.94), F(1, 9) ⫽ 21.41, p ⬍ .01; display size (0.96, 0.96, 0.94), F(2, 18) ⫽ 11.54, p ⬍ .01; and several interactions. The RT slopes for the O-in-C searches were larger (39 ms and 81 ms, respectively, for target present and target absent) than for the C-in-O searches (14 ms and 37 ms, respectively), replicating the search asymmetry under the controlled display conditions. An ANOVA of the homogeneous-orientation RT data (Figures 6C and 6D) yielded significant effects of the type of search (C-in-O vs. O-in-C), F(1, 11) ⫽ 22.02, p ⬍ .01; target presence, F(1, 11) ⫽ 24.68, p ⬍ .01; display size, F(2, 22) ⫽ 36.05, p ⬍ .01; and all interactions (all ps ⬍ .01). An analysis of the accuracy data indicated very small but significant effects of target presence (0.97 vs. 0.94), F(1, 11) ⫽ 7.13, p ⬍ .02; display size (0.97, 0.95, 0.94), F(2, 22) ⫽ 5.01, p ⬍ .02, and the Target Presence ⫻ Display Size interaction, F(2, 22) ⫽ 8.54, p ⬍ .01. Again, the expected search asymmetry was found: The RT slopes for the C-in-O searches were larger (38 ms and 90 ms, respectively, for the target-present and target-absent conditions) than those for the O-in-C searches (16 ms and 43 ms, respectively). All of these slopes exceed the 10 ms per item heuristic cutoff for serial processing (in one case, only slightly so; Cave & Wolfe, 1990). 8
We also investigated several other sets of stimuli. The often-cited search asymmetry for tilted lines and vertical lines did not yield the signature asymmetry under the annular display conditions used in these experiments. We also pilot tested pseudocharacters consisting of a triangle and a triangle with a line (forming an arrow). This produced RT asymmetries but did not allow modification to control accuracy levels with the shorter, fixed viewing times used in the SAT experiments. Ellipses and circles were also pilot tested, but the accuracy of asymmetric searches was problematic. The C-and-O stimuli yielded RT asymmetries, yet search accuracy could be titrated by varying the size of the gap in the C.
PARALLEL ASYMMETRIC SEARCH
11
Figure 5. The stimulus layouts and sample trial sequences. A: This display of Size 4 illustrates a search for a C in Os. B: This sample display of Size 12 illustrates a search for an O in homogeneous Cs. In homogeneous displays, all Cs open to the right; in heterogeneous displays, Cs appear randomly open to the right, the left, up, or down. All display elements appear on an annulus at 4.12° of visual angle, with slight position jitter. Displays of Size 12 incorporate spaces between groups of 4 to equate the local interactions of the Size 4 displays. C: A sample trial sequence for the standard response time (RT) trials. D: A sample trial sequence for the speed–accuracy trade-off (SAT) displays.
Discussion These results document the existence of an asymmetry in search for the C–O stimuli for eccentricity-controlled display conditions. They replicate in annular displays previous reports of this asymmetry in grid arrays (Treisman & Gormican, 1988). The slopes (ms per item) for visual search were higher for O-in-C searches than for C-in-O searches. Generally, the visual searches were more difficult (yielding higher slopes) for the heterogeneous-orientation condition than for the homogeneous-orientation condition. The subsequent SAT analysis of this search asymmetry investigated the homogeneous, or single-orientation, stimuli. The primary reason for this was theoretical—the single-orientation C–O task yields a purely symmetric task structure. In the more traditional multiple-orientation case, the target O is known exactly and the distractors are heterogeneous (four orientations) in the O-in-Cs condition, whereas the target is unknown (one of four orientations)
and the distractors are homogeneous (of a single orientation) in the C-in-Os case. In the single-orientation case, however, the task is perfectly matched. The target is known exactly and the distractors are homogeneous in both forms of the task.
Experiment 2: Time Course of Search Experiment 1 documented a typical asymmetric pattern for visual search (Treisman & Gormican, 1988) in unlimited viewing conditions. Searching for an O in Cs was more difficult than searching for a C in Os, leading to larger RT slopes. Both O-in-C and C-in-O searches yielded significant increases in RT and accuracy per display item and, hence, would be associated with a serial search process. In Experiment 2 we measured the time course of these searches using speed–accuracy methods in order to evaluate serial and parallel search architectures. Time-limited displays guaranteed the measurement of covert attention.
12
DOSHER, HAN, AND LU
Figure 6. Average correct response times (RTs) and error rates as a function of display size for search with free viewing of unlimited-time displays in Experiment 1, for both homogeneous and heterogeneous conditions: RTs (A) and errors (B) in target-present and target-absent conditions of C-in-O and O-in-C displays for the heterogeneous (C-gap right, down, left, or up) conditions and RTs (C) and errors (D) for target-present and target-absent conditions of C-in-O and O-in-C displays for homogeneous (C-gap right) conditions. TP ⫽ target present; TA ⫽ target absent.
Method Observers. Six observers participated in a series of 10 –12 sessions and were paid for their participation. All observers reported normal or corrected-to-normal vision. Design. C-in-O and O-in-C searches were performed in separate blocks. Cs appeared in one orientation, with the gap on the right (see discussion in Experiment 1: RT). Target-present and target-absent displays of Sizes 4 and 12 were tested. Processing time was manipulated with seven cue delays of 0, 0.05, 0.15, 0.30, 0.50, 1.15, and 1.80 s after display duration offset, for net cue delays from stimulus onset of these values plus the display duration. All trial types within a block were tested in random order. After initial training in the SAT methods with display duration of 150 ms, observers participated for six blocks (n ⫽ 60 trials in each of the 28 conditions, or 1,680 trials) with a display duration of 100 ms, followed by six blocks (n ⫽ 60 trials per condition, or 1,680 trials) with a display duration of 50 ms. Stimuli and procedure. The display layout and stimuli were identical to those of Experiment 1. The procedure was similar to Experiment 1 but with several differences. The duration of the search display was limited to either 100 or 50 ms. Search was interrupted with a tone at one of seven cue delays. Observers were instructed not to respond until the tone cue and then to respond as quickly as possible. RT was measured from the onset of the display and from the onset of the response cue. The RT to the cue was presented as feedback for 500 ms following the response. Analyses. The percentage of yes (target-present) responses and mean RTs were tabulated for each display size, cue delay, and target present– absent condition. Percentage yes data were used to calculate d⬘, a bias-free measure of discrimination (d⬘ ⫽ zhit ⫺ zfa). Probabilities of zero or one were corrected (Macmillan & Creelman, 1991) by the factor 1/2N (or 1/120) to yield measurable values. This factor also limited the predicted d⬘
in model fits. Time–accuracy functions graph d⬘ as a function of total processing time, or cue delay plus RT to the cue, corresponding to the total average time between display onset and response. Although serial and parallel models are fit to the SAT data, the asymptotic accuracy and dynamics (speed of information accumulation) are also estimated from a description of the data as an exponential approach to an asymptotic level: d⬘ ⫽ 关1 ⫺ e⫺  共t⫺ ␦ 兲 兴,
t ⬎ ␦ ; 0 otherwise.
(12)
Here, is the asymptotic (maximal) accuracy, the intercept ␦ is the point at which accuracy first rises above chance, and the rate  describes the speed of rise from chance to asymptote. This equation provides an excellent empirical summary of time–accuracy functions and also allows comparison to other published data (Dosher, 1976, 1979, 1981, 1982; McElree & Dosher, 1989, 1993; Reed, 1973; Sutter & Graham, 1995; Sutter & Hwang, 1999). Both the exponential model and the probabilistic serial and parallel search models were fit to time–accuracy d⬘ data by minimizing the squared deviations between the model and the data:
冘 n
共di ⫺ dˆi兲 2 ,
i⫽1
where di is the observed d⬘ value and dˆi is the d⬘ value predicted by the model. The majority of the model fits were applied to aggregate data, which was computed by first calculating a d⬘ value for each observer and then averaging these values. A Monte Carlo estimation of the standard deviation of the mean d⬘s, averaged over observers as were the data, was 0.12 ⫾ 0.02. Thus, the unweighted least squares model fits are a very good
PARALLEL ASYMMETRIC SEARCH approximation to a weighted least squares fit and, hence, to maximum likelihood solutions.9 Minimization was accomplished using either an iterative hill-climbing algorithm (Reed, 1976) similar to STEPIT (Chandler, 1969) or, for the serial and parallel models, by nonlinear minimization functions in MATLAB. The quality of the fit is summarized by
冘 n
共di ⫺ dˆ i兲 2
i⫽1
R2 ⫽ 1 ⫺
共n ⫺ k兲
冘 n
,
(13)
共di ⫺ d 兲 2
i⫽1
共n ⫺ 1兲 where di and dˆ i are as described above, d is the mean of the observed d⬘ values, n is the total number of predicted data values, and k is the number of model parameters. The fidelity index r2 is the proportion variance accounted for by the model (calculated by replacing n ⫺ k in the R2 equation by n ⫺ 1), R2 is the percent variance accounted for by the model, adjusted by the number of free parameters (Wannacott & Wannacott, 1981). Nested models were compared using an F test: 共SSErestricted ⫺ SSEfull 兲 共kfull ⫺ krestricted 兲 Fdf1,df 2 ⫽ . 共SSEfull 兲 共n ⫺ kfull 兲
(14)
The SSEs are the sum of squared errors for a more restricted and fuller model, and the ks are the number of model parameters. The degrees of freedom are df1 ⫽ (kfull ⫺ krestricted) and df2 ⫽ (n ⫺ kfull).
Results Speed–accuracy functions. The average RTs to the cues were essentially unaffected by display size or search difficulty, but they varied slightly over the shortest few cue delays, as is typical in the SAT paradigm (e.g., Dosher, 1976; Reed, 1973). Total processing time is the average time from display onset to response. Figure 7 shows the proportions of yes (target-present) responses, averaged over observers, as a function of total processing time for target-present and target-absent displays of Size 4 and 12 for C-in-Os (easy) and O-in-Cs (difficult) searches. For the easy C-in-O searches, both hit performance and false alarm performance were better for display sizes of 4 than of 12. For the more difficult O-in-C searches, there were small differences in false alarm rates and larger differences in hit rates for the two display sizes. The shift to compensate for false alarms may be characteristic of the more difficult search. The corresponding average time–accuracy functions (d⬘ vs. total processing time) are shown in Figure 8. The data for 100-ms displays and for 50-ms displays are displayed separately. The average data are representative of the individual observer data (available from the authors). The smooth functions are best-fitting exponential models. The data for the 100-ms and 50-ms display conditions are quite similar. The 100-ms data were collected first, and the 50-ms data were collected second. The small quantitative differences between these two conditions reflect both the difference in display duration and the different levels of practice. The 50-ms display duration allowed us to cue responses earlier during the search process. We treat the two sets of data as independent replications.
13
Empirical estimates of asymptotic (maximal) d⬘ accuracy were calculated by averaging the last three cue delays (e.g., Dosher, 1982). These accuracy data were consistent with the difficulty patterns usually exhibited in RT. The C-in-O searches achieved higher asymptotic accuracy than the O-in-C searches (for 100-ms displays: average d⬘ ⫽ 3.08 vs. d⬘ ⫽ 2.36, ⌬ ⫽ 0.72; for 50-ms displays: average d⬘ ⫽ 3.20 vs. d⬘ ⫽ 1.98, ⌬ ⫽ 1.22), showing the expected relative search difficulty. Similarly, displays of Size 4 yielded higher accuracy than displays of Size 12 (for 100 ms: average d⬘ ⫽ 3.23 vs. d⬘ ⫽ 2.21, ⌬ ⫽ 1.01; for 50 ms: average d⬘ ⫽ 3.04 vs. d⬘ ⫽ 2.13, ⌬ ⫽ 0.91), revealing the expected increase in difficulty with display size. Finally, the impact of display size was larger in the O-in-C search compared with the C-in-O search (for 100-ms displays: ⌬ ⫽ 1.11 vs. ⌬ ⫽ 0.92; for 50-ms displays: ⌬ ⫽ 1.04 vs. ⌬ ⫽ 0.78), showing asymmetry in asymptotic accuracy in the time–accuracy functions. In all cases, the standard error of these differences was approximately 0.07. The results of exponential model fits (see the Analyses section) are summarized in Table 1. The exponential fits provide a standard description of time–accuracy functions for individual observer data and average data. (The next section considers direct fits of the probabilistic search models.) Exponential models parameterize each time–accuracy function with an asymptote (), a rate (), and an intercept (␦). Asymptotic accuracy differed significantly between conditions. A 4 , 1 , 1 ␦ model (common  and ␦) fit the data quite well, yielding R2 for the average data of .975 (range over observers: .835–.948) for 100-ms displays and .961 (range over observers: .896 –.942) for 50-ms displays. This simplest model, in which the two different forms of searches (and, hence, search asymmetry) had identical temporal dynamics (identical starting points and identical rates of increase), provided the most parsimonious best fit for 8 of the 12 individual observer fits listed in Table 1. In 4 of 12 individual observer fits, however, there was some evidence that the speed of search, as measured by the exponential rate, was somewhat faster for the C-in-O searches compared with the O-in-C searches.10 The parameter values associated with a model (4 , 2 , 1 ␦) in which rate parameters (search speeds) are slightly different for C-in-O and O-in-C searches are listed in Table 1 for individual observers and for the average data. Significance was evaluated using nested F tests. In no case was there systematic evidence of the slower search speed in larger display sizes. Thus, these results are qualitatively more consistent with parallel than with serial processing architectures. This is because parallel search architectures, in which all display elements are processed at the same time, predict that the time course is nearly independent of display size, whereas serial 9
As noted by Miller (1996), the standard error of observed d⬘s can vary fairly substantially. Here, however, the serial and parallel models are fit to d⬘s averaged over observers. The standard errors of the average d⬘s were estimated assuming binomial variability on the observed proportions of hits and false alarms from each observer’s data, and then the d⬘s were averaged over observers as in the actual data. The estimated variability of these average values was essentially identical for all observed d⬘s. The reason for this is that the overall variability is largely controlled by variability between observers. 10 In three cases, display size had a marginal effect, but in each of these the pattern was inconsistent with a standard display-size effect, and in none of these cases was this finding replicated in both the 50- and 100-ms display conditions for the same observers.
14
DOSHER, HAN, AND LU
Figure 7. Proportion yes (hits and false alarms) as a function of total processing time (test onset to response) for target-present and target-absent conditions, for display sizes of 4 (open circles) and 12 (open squares) from Experiment 2, for 100-ms display, C-in-O search (A); 100-ms display, O-in-C search (B); 50-ms display, C-in-O search (C); and 50-ms display, O-in-C search (D). The individual symbols show the corresponding points for display-limited homogeneous-orientation for Display Sizes 4 (⫹) and 12 (*) from the response-time (RT) paradigm of Experiment 3. The RT-percent yes data from the RT paradigm fall on or near the corresponding speed–accuracy trade-off (SAT) functions for 50-ms display durations and exhibit slightly better performance than the SAT functions for 100-ms display durations. The small deviation of the RT points from the SAT functions for 100-ms display conditions reflects improvements in performance due to practice.
search architectures predict a slower time course as display size increases. Search asymmetry is a classic case generally associated with serial search mechanisms, yet there is no evidence for dynamic slowing with increased display size in the speed–accuracy data. In the next section, we explicitly evaluate probabilistic search models, which provide a quantitative test of the detailed predictions of parallel and serial models of visual search. Probabilistic parallel search models. In this section, we provide a direct test of an elaborated parallel search model (PSM), incorporating target and distractor classification errors. The PSM was fit to the time–accuracy functions (d⬘ versus total processing time). The speed–accuracy functions characterize the global time course or dynamics (rate of accumulation of evidence) of visual search. The predicted time course is controlled by the temporal parameters of individual comparison operations, error probabilities, and a decision rule. The PSM accounted quite well for the time course of visual search, providing a good description of visual search for conditions generally associated with serial search processes. The models were tested separately on d⬘ data for the 100and 50-ms exposure durations, averaged over observers. Each model was implemented in MATLAB, using nonlinear minimization methods to find the best least-squares fit to the d⬘ data. A lattice of PSM models was considered, from most highly constrained to less constrained. The most constrained model included only two probability parameters (P1 and P2), one for the proba-
bility of correctly classifying Cs and the other for the probability of correctly classifying Os—search asymmetry is accounted for solely by changes in the assignment of the two stimuli to target and distractor. This minimal model also includes three other parameters: a time parameter and parameter ␣, which jointly determine the gamma distribution characterizing the completion times of any single visual search comparison,11 and g as a guessing or bias parameter, for five total parameters (2 P, 1 , 1 ␣, 1 g model). In a less constrained model, four classification probabilities of Cs and Os depended on the asymmetry condition, for a seven-parameter model (4 P, 1 , 1 ␣, 1 g). Finally, in the most elaborate variant, all parameters—probabilities, timing, and bias parameters— differed for the two forms of the asymmetric search, for a 10parameter model (4 P, 2 , 2 ␣, 2 g). Several additional intermediate cases were also considered. The best-fitting model (4 P, 1 , 1 ␣, 1 g) allowed independent estimates of the identification probabilities for the C-in-O and O-in-C conditions but identical temporal dynamics, yielding an r2 of .98 –.99. This was superior ( ps ⬍ .02) to the simplified model 11
As described in the introduction, the gamma distribution simply generates completion time distributions of arbitrary skew. In general, the estimated ␣ parameter was sufficiently large (⬎15) that the distribution was similar to the normal distribution.
PARALLEL ASYMMETRIC SEARCH
15
Figure 8. Discrimination performance (d⬘) as a function of total processing time (test onset to response) for display sizes of 4 and 12 from Experiment 2, for 100-ms display, C-in-O searches (A); 100-ms display, O-in-C searches (B); 50-ms display, C-in-O searches (C); and 50-ms display, O-in-C searches (D). The symbols are observed data points, and the smooth curves are best-fitting descriptive exponential functions.
(2 P, 1 , 1 ␣, 1 g)—r2 ⬇ .96 —for both the 100- and 50-ms duration data, as assessed by the nested F test.12 A full model with completely independent parameter sets for the different asymmetry conditions and a total of 10 free parameters (4 P, 2 , 2 ␣, 2 g) did not provide reliable improvements in fit compared with the 7-parameter model, nor did other intermediate model variants. Thus, the best-fitting model included four independent probabilities of accurate identification (4 P, 1 , 1 ␣, 1 g). The bestfitting parameters for this model were PT ⫽ 0.99 and PD ⫽ 0.96 for the easier C-in-O searches and PT ⫽ 0.99 and PD ⫽ 0.82 for the more difficult O-in-C conditions, with a mean search time of 360 ms (corresponding to the average search time, defined by the product of the parameters of 0.009 and ␣ of 39.7 for the gamma distribution) and guessing parameter of 0.301, for the d⬘ data for the 100-ms display duration. The values were PT ⫽ 0.99 and PD ⫽ 0.97 for the easier C-in-O searches and PT ⫽ 0.99 and PD ⫽ 0.80 for the more difficult O-in-C conditions, with a mean search time of 334 ms ( of 0.008 and ␣ of 41.9) and guessing parameter of 0.338 for the d⬘ data for the 50-ms display duration. Without loss of generality, it was possible to fix ␣ at a value of 40 and use alone13; this yielded equivalent r2 and probability and guessing estimates. The 4 P, 1 , 1 g, ␣ ⫽ 40 model yielded equivalent parameter estimates, with r2 ⫽ 0.98 for both the 100- and 50-ms display data. The best fitting model is shown by the smooth curves in Figure 9. This unlimited-capacity probabilistic PSM provides an extremely good account of the entirety of SAT functions in visual search, as measured by d⬘. The probabilistic PSM constrains the relative asymptotic search accuracy over display sizes, consistent with an unlimited-capacity
decision process (e.g., Palmer, 1994). These decision models account for the reductions in search accuracy with increased display size in terms of the reductions predicted by the decision structure of an ideal observer. Additionally, the PSM provides one model of time course that is also consistent with the signal-detection account. This model estimated probabilities of accurate evaluation for individual target and distractor items in C-in-O (easy) and O-in-C (hard) search conditions. Without altering the core parallel processing architecture of the model, we can consider how these estimated probabilities (hits and false alarms) can be remapped from various signal-detection assumptions, leading to implications for theories of search asymmetry. The probability estimates for O-in-C from the best four-P model yielded an estimated equalvariance d⬘ for each display item in the C-in-O condition of approximately 4.1, whereas the equal-variance d⬘ of the same items in the O-in-C condition was approximately 3.5. This difference was the basis for rejecting the two-P model, which attempted to fit the asymmetry conditions with the hit and false alarm rates in one condition mapped to the false alarm and the hit rates, respectively, in the other. A remapping that constrained the four Ps to arise from a single distance d between the coded distributions for C and O and with equal variances but allowed the hit and false 12 Although this baseline model achieved a reasonably high r2, the visual quality of the fit showed systematic deviation. 13 The value of ␣ ⫽ 40 is somewhat flexible; values between 25 and 50 would be acceptable.
DOSHER, HAN, AND LU
16
Table 1 Exponential Descriptive Parameters for Experiment 2 Observer Parameter
Av.
C.L.
3.59 2.65 2.99 1.85 9.91 6.67
3.46 2.74 3.27 2.52 14.00 9.30
I.C.
E.H.
P.T.
R.A.
D.W.
3.81 2.75 2.07 1.09 13.00 5.10
3.70 3.13 3.25 1.55 10.00 4.61
3.16 1.75 3.98 2.18 7.16 6.53
3.50 2.19 3.43 1.88 8.58 12.01
100-ms display C-in-O: C-in-O: O-in-C: O-in-C: C-in-O: O-in-C:
4 12 4 12  
Common ␦ Adjusted R2
.333 .984
Significance
*
4.08 3.44 2.36 2.15 6.36 3.90
.326 .858
.328 .929
.341 .959
.358 .913
.358 .915
.320 .908
ns
ns
*
*
ns
ns
4.14 2.85 2.19 1.14 11.51 8.11
4.42 3.45 3.67 1.78 8.61 4.34
4.50 3.47 4.08 2.81 6.99 5.91
3.79 2.43 3.33 1.92 9.64 8.98
50-ms display C-in-O: C-in-O: O-in-C: O-in-C: C-in-O: O-in-C:
4 12 4 12  
4.01 3.16 2.91 1.77 8.62 6.46
Common ␦ Adjusted R2
.295 .981
Significance
†
4.07 3.55 3.06 2.49 11.05 7.79
3.67 3.40 1.42 0.61 5.67 6.28
.278 .931
.288 .902
.301 .930
.309 .943
ns
ns
†
ns
.309 .908 †
.304 .919 ns
Note. Parameters are listed for a 4 , 2 , 1 ␦ exponential model in which each condition has a separate asymptote (), rate () may vary for C-in-O (easy) versus O-in-C (hard) searches, and the intercept (␦) is common. Adjusted R2 is the percentage variance accounted for, adjusted for the number of free parameters. Av. ⫽ average; * ⫽ easy rate is significantly higher than hard rate ( p ⬍ .05); † ⫽ easy rate is significantly higher than hard rate, and display size also has a significant but erratic effect on intercept.
alarm rates to differ through different placement of criteria in the two search conditions (e.g., four Ps were replaced with one d, ⫽ 1.0, and two criteria, one for C-in-O and one for O-in-C searches, from which the four Ps were calculated) was also rejected. However, it was possible to remap the four independently estimated Ps into a model with one distance d, a standard deviation for the identification distribution of Cs (the standard deviation for the identification distribution of Os set to 1.0), and two criteria, one for C-in-O and one for O-in-C searches. This six-parameter model (1 d, 1 , 2 criteria, 1 , 1 g, ␣ ⫽ 40) yielded an equivalent fit to the best-fitting six-parameter model (4 P, 1 , 1 g, ␣ ⫽ 40), of which it is a closely equivalent but more constrained remapping. For the 100-ms data, the 4 Ps were calculated from an estimated d⬘ ⫽ 3.33 and ⫽ 0.71; for the 50-ms data, the 4 Ps were calculated from an estimated d⬘ ⫽ 3.05 and ⫽ 0.50. This yielded r2s of .98 for both data sets. In either case, the overall accuracy in the C-in-O searches was higher than that in the O-in-C searches. The PSM provides a good account of visual search performance in this classic example of asymmetric search, in which performance is generally attributed to serial search processes. The relationship between the two asymmetric search conditions was also evaluated within the framework of the PSM. The accuracy of identification for Cs and Os differed depending on the assignment of C or O as the target. The analysis that remapped the four probabilities of correct identification (PT and PD for C-in-O and for O-in-C) in a signal-
detection analysis was consistent with a generalized signaldetection structure in which either (a) the distance d between the C and O distributions depended on the search condition (e.g., dC-in-O ⫽ dO-in-C), with a single standard deviation, or (b) the distance d between the C and O distributions was independent of the search condition, but the standard deviation of the C distribution and the O distribution differed (C ⫽ O, O ⫽ 1.0). In both cases, it is necessary to assume that different criteria for classification are operative in the two search conditions (cC-in-O ⫽ cO-in-C). These two interpretations require the same number of free parameters. We prefer the second interpretation because it is structurally less complex—it allows the sensory coding processes to be identical in the two search conditions. The theoretical implications for theories of search asymmetry are considered in the discussion. Probabilistic serial search models. The probabilistic PSM provided a very good account of the time course and accuracy of search. Yet the difficult form of asymmetric visual search is usually associated with a serial search model (SSM). Many attention-based search models include a serial component. The probabilistic SSM instantiates a quantitative formulation of the time–accuracy profiles. The probabilistic SSM does not provide a competitive fit to the data from the SAT experiment. Even the most general form of the probabilistic SSM, which included independent parameters for processing speed ( and encoding–RT offsets t0) and bias for the two forms of asymmetric search (4 P, 2 , 2 g, 2 t0, or 10 parameters) failed to fit the data well; the
PARALLEL ASYMMETRIC SEARCH
17
Figure 9. Fit of the probabilistic parallel search model (PSM) to the discrimination data (d⬘) in Figure 8. The symbols are observed data points, and the smooth curves are best-fitting model functions. Panel layout corresponds to Figure 8. The PSM gives a good account of the time-course data.
10-parameter model yielded r2s of .80 and .85, respectively, for the d⬘ data for the 100- and 50-ms displays. This compares very unfavorably with the more parsimonious parallel model (4 P, 1 , 1 g, or 6 free parameters [␣ set at 40]), with r2s of .98 and .98, respectively, for the d⬘ data for the 100- and 50-ms displays. The estimated parameter values for the fit of the probabilistic SSM exhibited inconsistencies (e.g., for the more difficult O-in-C searches, estimated time offset t0 ⫽ 240 –250 ms, whereas for the easier C-in-O searches, estimated time offset t0 ⫽ 263–277 ms, with inconsistent time constants s over display conditions). Finally, these fits visually provided less good fits of the model to data, as seen in Figure 10. The SSM predicts a slower time course for larger display conditions, and this is true of the probabilistic SSM, even if the moderating effect of errors on time course is incorporated. It is visually evident that the display-size effects on the time course of visual search are inconsistent with the near equivalence of temporal dynamics for the different display sizes. Bayesian serial and parallel search models. A more complex form of the SSM that incorporated sophisticated guessing was also developed (see the Appendix) to test the intuition that using information about the already completed search stages might allow the SSM to account for the time-course data.14 The model we considered modified the guessing process to incorporate the number of completed comparisons. In the original SSM, the guessing probability—which applies either before some item is identified as a target or before all items are identified as distractors—was identical throughout the search process. In the Bayesian SSM, the probability of guessing yes at any given time depends on how many comparisons are complete: 共N ⫺ l兲 P(guess yes) ⫽  , where l is the number of comparisons N
completed without (correctly or incorrectly) identifying a display element as a target. This corresponds to the intuition that the probability of guessing yes should be lower if 11 of 12 display elements have been searched without finding a target than if only 1 of 12 display elements have been searched. If the initial guessing parameter is 50%, this would correspond to rates of guessing yes of 46% after 1 of 12 comparisons is completed and 4% after 11 of 12 are completed. Although intuition might suggest a moderation of the dynamic predictions due to sophisticated guessing, in fact the impact on predicted d⬘ is very small.15 The reason is that, although the guessing rate might reduce from, say, 50% to 46% after the first comparison is completed, this is equally true for the target-absent and the target-present cases. These two cases deviate only at the point where some item is identified as a target. The similarity of the predictions of the original and the Bayesian form of the probabilistic SSM is shown for an example set of parameters (PT ⫽ 0.95, PD ⫽ 0.98, ⫽ 0.05,  ⫽ 0.50, for N ⫽ 4 or 12) in Figure 11. The differences between the two models are very small, as shown by the close identity between the predicted d⬘s for the Bayesian and the original SSM (Figure 11A) and the nearly identical predicted time courses (Figure 11B). A similar relationship holds in the parallel model for the same reasons. The similarity of the predictions of the two forms of the probabilistic parallel search model is shown in Figures 11C and 11D for an 14
Thanks to Jeff Miller and an anonymous reviewer for this suggestion. A process of sophisticated guessing was suggested by reviewers as a mechanism to allow a serial model to accommodate the very small or null effects of set size on dynamics of the time-course functions. 15
18
DOSHER, HAN, AND LU
Figure 10. Fit of the probabilistic serial search model (SSM) to the discrimination data (d⬘) in Figure 8. The symbols are observed data points, and the smooth curves are best-fitting model functions. Panel layout corresponds to Figure 8. The SSM gives a poor account of the time-course data.
example set of parameters (PT ⫽ 0.95, PD ⫽ 0.98, ⫽ 0.02, ␣ ⫽ 20,  ⫽ 0.50, for N ⫽ 4 or 12). Due to this close correspondence for both serial and parallel models, the fitted solutions of the Bayesian, sophisticated-guessing form of the models and the original forms of models are not distinguishable with realistic experimental sample sizes. Indeed, as expected based on this analysis, model fits for the guessing-augmented models yielded essentially equivalent parameter estimates and fits.
Discussion Search asymmetry is one of the major empirical examples of visual search that has been historically associated with serial search for the more difficult condition. Yet the probabilistic PSM provided a very good account of visual search performance in the absence of eye movements for this case of asymmetric search. A simple form of the model was sufficient to provide a good fit of the time-course data. In contrast, a probabilistic SSM, despite the incorporation of errors and guessing into early time-course predictions, did not provide a satisfactory account of the data. A Bayesian serial model incorporating sophisticated guessing made nearly identical predictions and so was similarly unable to account for the time-course data. Both forms of serial model overpredicted slowing due to increases in the display size. We believe that this rejection of the serial models is quite general. Of course, in the limit, some form of hybrid serial–parallel process would ultimately be indiscriminable from a pure parallel process. For example, if the displays were organized into only two groups, processed one after the other but with parallel processing within groups, this model might not make quantitative predictions that would be distinguishable from the pure parallel case. The point here is that a pure
parallel mechanism provides an excellent account, and models with a significant serial component do not. The two forms of search asymmetry, relatively easy C-in-O searches and relatively difficult O-in-C searches, exhibited a common processing time course but different estimated itemidentification accuracies. It was necessary to assume either (a) different levels of limiting discrimination (d⬘) for the C-in-O and O-in-C conditions, which could be achieved by assuming different distances (d) between the representations for Cs and Os, with equal variances or (b) identical distances between the representations for Cs and Os but with unequal variance. Of these two options, we prefer the latter because it is structurally parsimonious—it assumes that the coding and representations in the two forms of search asymmetry are identical and that the different hits and false alarms in the two conditions reflect only differences in criteria applied to the same representations. Therefore, we attribute search asymmetry to less variance in sensory coding of C than of O. This analysis of visual search asymmetries is consistent with model approaches that focus on a signal-detection framework and variances of computed feature representations (Rosenholtz, 2001; Rubenstein & Sagi, 1990). The effective accuracy of the overall asymmetric search process, however it is conceptualized, favors the C-in-O searches over the O-in-C searches. Nonetheless, time courses of search are remarkably similar in the two asymmetry conditions (e.g., information about these displays first becomes available at essentially the same time, and the availability of new information accrues over essentially the same period of time). In the absence of eye movements, visual search— even in cases of search asymmetry—reflects accuracy-limited, not time-limited, processes.
PARALLEL ASYMMETRIC SEARCH
19
Figure 11. Predictions of the serial search models (SSMs) and parallel search models (PSMs) with and without Bayesian (Bayes) sophisticated guessing. Panels A and B show the results for the SSM for a sample set of parameters (PT ⫽ 0.95, PD ⫽ 0.98, ⫽ 0.05,  ⫽ 0.50, for N ⫽ 4 and 12). A: Predicted d⬘ for the Bayesian SSM versus the original SSM. B: Predicted d⬘ for the original (solid line) and sophisticated-guessing (dashed line) versions of the SSM for set sizes of 4 and 12. Panels C and D show the results for the PSM for a sample set of parameters (PT ⫽ 0.95, PD ⫽ 0.98, ⫽ 0.02, ␣ ⫽ 20,  ⫽ 0.50, for N ⫽ 4 and 12). C: Predicted d⬘ for the Bayesian PSM versus the original PSM. D: Predicted d⬘ for the original (solid line) and sophisticatedguessing (dashed line) versions of the PSM for set sizes of 4 and 12. The close relationship between the two forms of model is very general.
Experiment 3 Experiment 3 tested the SAT observers in several RT conditions, following the completion of Experiment 2. We tested the observers in time-unlimited display conditions (standard RT) to evaluate whether the extensive practice in the SAT task altered search performance. They were tested in time-limited display conditions to evaluate the relationship of RT under these conditions with the corresponding results in the SAT task. RT testing in these observers occurred after participation in the SAT task.
Method The method for the limited-display conditions was equivalent to that of Experiment 2, except that the tone cues to respond were eliminated and display sizes of 4, 8, and 12 were tested. In separate blocks, both homogeneous- and heterogeneous-orientation conditions were evaluated. The method for the unlimited-display conditions was identical to that of the limited-display conditions, except that the stimulus remained on until response. In both cases, observers were instructed to respond as quickly and accurately as possible. Observers participated in a total of four sessions, yielding a sample size per observer per condition of 80 in each of the display conditions.
Results Time-limited display RT data. The RTs and errors for the time-limited displays, averaged over observers, are shown in Figure 12 for homogeneous visual search (all Cs with the gap on the right). This was the search condition tested in the SAT experiment. For time-limited displays for these practiced observers, the RT and error functions of display size exhibited relatively flat RT slopes and relatively higher error rates. An ANOVA of the RT data for
homogeneous searches yielded significant effects of search conditions (O in C vs. C in O), F(1, 5) ⫽ 7.93, p ⬍ .05; target presence, F(1, 5) ⫽ 15.93, p ⬍ .01; and display size, F(2, 10) ⫽ 6.33, p ⬍ .05. In the time-limited displays, the effect of display size was larger on error rates (see also McElree & Carrasco, 1999). An ANOVA of the error data supported these conclusions. The error rates for these time-limited displays were higher than the asymptotic error rates in the SAT data. Instead, the mean RTs and error rates corresponded to performance earlier on the SAT functions. This can be seen in Figure 7, where the performance from the RT paradigm is indicated for Display Sizes 4 and 12 for target-present and target-absent conditions. The relationship between the RT data and the SAT data for the 50-ms display conditions is exceptionally close, indicating a close consistency between performance in the SAT and in the RT paradigm under the identical display conditions. For the 100-ms display conditions, the RT performance is slightly better than would be expected on the basis of the SAT data. This relatively small deviation almost certainly reflects improved performance due to practice. For the SAT data, a short initial practice phase was carried out in 150-ms displays, followed by collection of the full data set for 100-ms displays and then for 50-ms displays. Finally, data from the practiced SAT observers were collected in the RT paradigms. Hence, the 50-ms display conditions in the SAT and the RT paradigm were at adjacent and perhaps at asymptotic levels of practice in this search task, whereas the 100-ms display data were collected at an earlier stage of practice. This remarkable consistency between the RT data and the SAT data from comparable display conditions strongly suggests that the two paradigms are measuring the same processes.
20
DOSHER, HAN, AND LU
Figure 12. Average response times (RTs) and errors for time-limited homogeneous (C-gap right) displays as a function of display size and target present–absent for C-in-O and O-in-C searches, from Experiment 3, with observers practiced in the speed–accuracy trade-off experiment. A: RT for 100-ms displays. B: Errors for 100-ms displays. C: RT for 50-ms displays. D: Errors for 50-ms displays. TP ⫽ target present; TA ⫽ target absent.
The RTs and errors for the time-limited displays for heterogeneous displays are shown in Figure 13. For the 100-ms displays, the slopes of RT as a function of display size were longer for O-in-C searches (8 ms and 3 ms per item) than for C-in-O searches (4 ms and 5 ms per item). The accuracy levels for the three display sizes were .88, .83, and .80. For the 50-ms displays, the slopes of RT as a function of display size were similar and longer for the O-in-C searches (8 ms and 3 ms per item) than the C-in-O searches (3 ms and 3 ms per item). The accuracy levels for the three display sizes were .85, .81, and .77. Unlimited-display RT data. The RTs and errors for the unlimited-duration, free-viewing condition, averaged over observers, are shown in Figure 14. An ANOVA of the heterogeneousorientation RT data yielded significant effects of the type of search (C-in-O vs. O-in-C), F(1, 5) ⫽ 17.88, p ⬍ .01; target presence, F(1, 5) ⫽ 12.16, p ⬍ .01; display size, F(2, 10) ⫽ 12.14, p ⬍ .01; and all interactions (all ps ⬍ .01). An analysis of the accuracy data exhibited small but significant differences in proportion of errors for target presence (0.97 vs. 0.93), F(1, 5) ⫽ 12.88, p ⬍ .02, and Search Type ⫻ Target Presence, F(1, 5) ⫽ 8.63, p ⬍ .05, and Target Presence ⫻ Display Size, F(2, 10) ⫽ 4.38, p ⬍ .01, interactions. The RT slopes of the O-in-C searches were larger (28 ms and 73 ms, respectively, for target present and target absent) than for the C-in-O searches (9 ms and 21 ms, respectively, for target present and target absent). An ANOVA of the homogeneous-orientation (C-gap right) RT data yielded significant effects of the type of search (easy vs. hard), F(1, 5) ⫽ 8.47, p ⬍ .05; target presence, F(1, 5) ⫽ 12.01, p ⬍ .05; display size, F(2, 10) ⫽ 13.36, p ⬍ .01, and several interactions. An analysis of the accuracy data exhibited a significant Target Presence ⫻ Display
Size interaction F(2, 10) ⫽ 4.94, p ⬍ .05. No other effects were significant. The RT slopes of the O-in-C searches were larger (16 ms and 34 ms, respectively, for target present and target absent) than for the C-in-O searches (6 ms and 21 ms, respectively, for target present and target absent).
Discussion For the very well-practiced SAT observers, the pattern of mean RTs and errors in the unlimited-display condition, in which eye movements are not controlled, was essentially equivalent to the pattern for unpracticed observers, although the RT and RT slopes were shorter and the error rates were somewhat lower. Although there is some evidence that the extended practice improved performance somewhat, there is no evidence that it produced a change in the pattern of visual search. Instead, it appears that the unlimited-display conditions differ from the limited-display conditions primarily in the opportunity to continue with a sequence of additional episodes of information acquisition—very likely associated with the serial deployment of eye fixation in many cases.
General Discussion Empirical Summary Experiment 1 replicated standard RT results for asymmetric visual search in the annular displays that controlled for eccentricity and for lateral masking—search for a C in Os is more efficient than search for an O in Cs. The substantial effect of display size on RT
PARALLEL ASYMMETRIC SEARCH
21
Figure 13. Average response times (RTs) and errors for time-limited heterogeneous (C-gap right, down, left, or up) displays as a function of display size and target present–absent for C-in-O and O-in-C searches, from Experiment 3, with observers practiced in the speed–accuracy trade-off experiment. A: RT for 100-ms displays. B: Errors for 100-ms displays. C: RT for 50-ms displays. D: Errors for 50-ms displays. TP ⫽ target present; TA ⫽ target absent.
and accuracy in these searches is the pattern of performance typical of asymmetric search and is widely interpreted as a reflection of serial search processes. Experiment 2 evaluated the time course of visual search for time-limited (100- or 50-ms) display conditions using speed– accuracy methods. Time-limited displays have been used extensively in the testing of signal-detection models of visual search, in which search accuracy is the measure of performance. We extended this analysis to the time course of visual search. The asymptotic accuracy of visual search was higher for C-in-O searches than for O-in-C searches, and higher for Display Size 4 than Display Size 12 conditions. In this sense, difficult search was accuracy limited. However, the time course of processing was independent of display size, a result generally consistent with parallel models of visual search. There was no evidence of timelimited processing. Probabilistic serial and parallel processing models, as well as Bayesian sophisticated-guessing variants of these models, were tested by quantitative model fitting (discussed below). Experiment 3 measured the RTs and accuracies for C-in-O and O-in-C searches in time-limited and time-unlimited displays for the highly practiced observers who had participated in Experiment 2. The accuracies and RTs for the time-unlimited displays were consistent with, though somewhat more efficient than, those of the unpracticed observers of Experiment 1. Accuracies and RTs for the time-limited displays were in close registration with the corresponding conditions in the time–accuracy data from the SAT experiment.
Probabilistic Parallel and Serial Models Probabilistic forms of serial and parallel search models, as well as sophisticated-guessing variants, were developed in this article. These models were fit to the full time-course data in order to provide a quantitative test of visual search processes. The models incorporated errors in the identification of display items as targets or distractors. The probabilistic PSM provided an explicit quantitative form of parallel model based in signal-detection principles. This model provided a very good account of the time-course data. The probabilistic SSM predicted smaller effects of display size on the rising portion of the time course than the simple serial model but nonetheless failed to provide a good account of the time-course data for search asymmetry. The elaborated probabilistic parallel model provided a very good account of both the time course and the asymptotic accuracy of visual search for both the C-in-O and the O-in-C conditions. The 50-ms and the 100-ms display conditions, which yielded independent replications of the estimated parameters, exhibited consistent fits and closely similar parameter estimates. In contrast with the success of the elaborated parallel model, the elaborated serial model was not able to provide an adequate fit to the time–accuracy data. Even in the most overelaborated form, the data fits were unacceptable, and the parameter estimates exhibited internal inconsistencies. The analysis of the time course of visual search asymmetry provided strong evidence in favor of the operation of a parallel comparison process and against a serial comparison process in visual search in time-limited displays.
22
DOSHER, HAN, AND LU
Figure 14. Average response times (RTs) and errors as a function of display size for unlimited-time displays with free viewing in Experiment 3, with observers practiced in the speed–accuracy trade-off experiment. A: RT for the heterogeneous (C-gap right, down, left, or up) condition. B: Errors for the heterogeneous condition. C: RT for homogeneous (C-gap right) condition. D: Errors for the homogeneous condition.
These observations are consistent with earlier studies of visual search accuracy in time-limited displays (Palmer, 1994, 1995; Palmer et al., 1993, 2000). Those studies focused on statisticaluncertainty models for search accuracy, in which display size increases corresponded to increased possibilities for false alarms. The asymptotic forms of both our probabilistic serial and probabilistic parallel models are equivalent to the statistical-uncertainty models. Palmer and colleagues found that the display-size effects on untimed accuracy were consistent with simple statisticaluncertainty losses for many primary visual features such as line length, brightness, or orientation. Our observations go beyond those analyses of search accuracy to provide a systematic evaluation of the temporal properties of search. The untimed accuracy results are compatible with unlimited-capacity search processes coupled with either a parallel or a serial processing architecture— our results are consistent with the former. McElree and Carrasco (1999) documented that the time course of conjunction search was slowed for larger display sizes yet not to the extent predicted by a simple form of SSM. They concluded, without fully specifying the parallel models, that both feature and conjunction searches reflect parallel processes of visual search but that conjunction searches were substantially slower for larger display sizes, indicating load dependence. In this article, we applied probabilistic models of parallel and serial search, differing only in the scheduling of comparisons, to asymmetric visual search, a theoretically interesting but structurally simple form of search. Dosher et al. (1998, 2003) applied the probabilistic parallel and serial models to homogeneous and heterogeneous searches for oriented line targets and found similar evidence for a pure parallel search. The models provided adequate first-order approximations
to heterogeneous search. Applications to conjunction search may be intrinsically more complex because of the importance of subset evaluation processes (Dosher, 1998; Egeth et al., 1984) or, alternatively, substantial differences in processing speed or accuracy for different distractor subsets (Dosher, 1998). In the case of the McElree and Carrasco (1999) data, however, the probabilistic parallel search model provides a very good account of the results. Further work would be required to determine whether this is a general result for conjunction searches.
Other Models of Visual Search The probabilistic parallel search model was chosen in such a way that the probabilistic parallel and serial models differed only in the scheduling of item evaluations but were otherwise identical. A range of other models based in the same principles and decision rules as the probabilistic parallel model, such as diffusion models (Ratcliff, 1978), should exhibit similar properties. Finally, it is possible that other forms of parallel models might be modified and elaborated to account for these results. Humphreys and Muller (1993) postulated that groups of like distractors are rejected in parallel. Since distractors are identical in both forms of asymmetric visual search, it is possible that this model might predict a singlepass parallel rejection for both, but then it should also predict flat RT and accuracy functions of display size in the RT venues. In contrast, many serial models make predictions about display size effects that are as extreme or more extreme than those of the probabilistic serial model. Models that include a serial deployment of covert attention during visual search include the feature integration model (Treisman, 1988; Treisman & Gelade, 1980; Treis-
PARALLEL ASYMMETRIC SEARCH
man & Gormican, 1988). Standard feature integration theory, in which all item comparisons occur in series, appears to be incompatible with the current results. Selective search models (Dosher, 1998; Egeth et al., 1984) that assume serial deployment of covert attention over a selected subset of items would make similar predictions, scaled to the number of items in the selected subset. In any event, selective search models have no obvious applicability to the asymmetric visual search studied here. Other models, such as the guided search model (Cave & Wolfe, 1990; Wolfe, 1994), account for the positive RT slopes in free-viewing paradigms by serial deployment of covert attention to items selected through parallel preprocessing of all items. Again, there is no basis in the current asymmetric visual search for distinguishing between distractors; only a form of the model that defaulted to pure parallel processing would be compatible with the time-course data. Overall, then, we believe that many of these model approaches are inconsistent with our data. In a few cases, it is possible that an elaborated or modified form of the model might account for these data, but those elaborations would constitute significant model modifications. We defer these modifications to the original authors. Finally, contrary to intuition, sophisticated guessing does not contribute significantly to the dynamic properties of visual search. While we cannot rule out the deployment of complex Bayesian sophisticated guessing on the basis of partial completion of the search process, it is clear that sophisticated guessing, if it occurs, has little impact on the time course (d⬘ vs. processing time) of visual-search performance. This is because visual search is conceived as a process that self-terminates upon finding a target, and so completed comparison stages have an exactly equal effect in target-present and target-absent displays until a target is found or a distractor is misidentified.
Visual Search Asymmetry The Probabilistic Parallel Model provided estimates of the identification accuracy for individual C and O stimuli in the C-in-O and O-in-C visual searches. The model calculated overall accuracy and time course from these (estimated) accuracies of identification of individual tokens. Identification of Os and Cs, as estimated by the model, depended on the search context. The performance favored C-in-O search displays over O-in-C search displays. These results can be remapped into a signal-detection framework in which the four identification probabilities (O and C in C-in-O searches and O and C in O-in-C searches) arise from strength distributions for O and C with a separation (d), different variances, and different criteria in the two search environments. Two such models were compatible with the four estimated identification probabilities: Model 1, in which C and O are separated by a smaller d in the context of the O-in-C search than in the context of the C-in-O search, and the strength distributions are of equal variance; and Model 2, in which C and O are separated by an equal d in the two search contexts, but the standard deviation is smaller for Cs than for Os. C is the preferred token. Although both interpretations involve the same number of free parameters in the signal-detection model, we believe that Model 2 offers a more structurally parsimonious account. It is parsimonious in the sense that the underlying coded representations of C and O stimuli remain the same in the two search contexts, and only the criteria
23
applied to the space is altered. In this form, the two stimuli differ by virtue of their relative variability in coding. Overall, then, the model of limiting accuracies is consistent with the signal-detection framework, and the relative difficulties of conditions depend on the variance structure of the coded representations of individual stimuli. The C stimuli are coded with less variability than O stimuli, which confers (or reflects) the advantages of detecting Cs. Our theoretical view of the limiting accuracy structure is directly related to signal-detection and variance formulations of search asymmetry promoted by several previous groups. For example, Rubenstein and Sagi (1990) proposed a related model of asymmetry in texture segregation that was more specifically grounded in early visual system analysis by Gabor channel operators, but ultimately they argued that asymmetries in texture segregation arose from imbalances in coded variances of texture elements. Our view is also somewhat related to more recent proposals by Rosenholtz (2001) that emphasize the variability and relationships of coded representations of the stimuli and induced positions of criterion boundaries. In the temporal domain, the conclusions of this article are quite distinct from prior approaches. The pattern of results in the current studies was generally consistent with the classic reports of asymmetric search in the visual search literature (Treisman & Gormican, 1988), which are typically associated with serial-processing architectures for the more difficult form of asymmetric search. Instead of concluding that the search asymmetries reflect serial scrutiny of the search displays for nonpreferred target tokens, we conclude that the form and temporal properties of the search performance revealed by measurements of time course were well accounted for by a probabilistic PSM with closely equivalent temporal parameters and common model structure, allowing only variations in identification probabilities. Thus, in the temporal domain, our results provide strong evidence for parallel processes and fully overlapping time course. This contrasts with the classic explanations in terms of a contrast between parallel or nearparallel processing of preattentive features and serial processing of the difficult form of the search asymmetry. In this sense, our results contradict a common assumption of serial processes in visual search.
RT Data and the Role of Eye Movements in Visual Search The RT data were closely consistent with the time-course data. For time-limited displays, condition differences were primarily expressed in different accuracies, with modest RT differences. In fact, the combined RT and error rates (RT–d⬘ pairs) were close to—though not precisely on—the corresponding time–accuracy curves for time-limited displays. In contrast, RTs to unlimited-time displays showed substantial sensitivity to display size and target presence and absence, whereas here the differences in error rates were less than those found with time-limited displays. This pattern of RTs and errors in time-limited and time-unlimited displays is typical for these conditions (Dosher et al., 1998; McElree & Carrasco, 1999). A number of facts suggest that eye movements as well as covert attention processes may play important roles in visual search in free-viewing paradigms. The substantial differences between timelimited and time-unlimited displays in both accuracy and RTs suggest a further analysis of the role of eye movements in visual search. The accuracy limitations in time-limited displays suggest
DOSHER, HAN, AND LU
24
that information may not be fully extracted from brief displays, despite persistence of those displays in visual memory. Search within this single episode of information acquisition is parallel but accuracy limited, as documented in the analysis of the speed– accuracy data. One might study improvements in visual-search accuracy under conditions of continued fixation to further evaluate search processes associated with covert attention. Of course, overt movements of the eyes in visual search (Geisler & Chou, 1995; Motter & Belky, 1998) are intrinsically serial.
Conclusions In this example of asymmetric visual search (C in Os or O in Cs), covert attention was deployed in parallel over the items in the visual field. Eye movements were precluded by brief displays, and the full time course of processing was measured by SAT methods. Information processing without eye movements is accuracy limited, not processing-time limited in nature. In standard RT studies of visual search with time-limited displays, conditions differed in error rates, with more modest differences in mean RT as a function of display size. In standard RT experiments with unlimitedduration displays, display-size effects on RT were larger and effects on accuracy much smaller. We believe that attention processes within each eye fixation operate in parallel, whereas serial eye-movement processes are used to overcome limitations in visual coding. Search asymmetry results from a signal-detection model with different variances in coding for different features or stimuli. There are three lines that future research might take: (a) further developments and applications of the models to more complex visual-search designs, (b) measurements that evaluate the applicability of parallel processing models for covert attention in time-unlimited processing with the fixated eye, and (c) further evaluations of the relation of covert attention and subsequent information acquisition with the eye free to move in visual search.
References Carrasco, M., Evert, D. L., Chang, I., & Katz, S. M. (1995). The eccentricity effect: Target eccentricity affects performance on conjunction searches. Perception & Psychophysics, 57, 1241–1261. Carrasco, M., McLean, T. L., Katz, S. M., & Frieder, K. S. (1998). Feature asymmetries in visual search: Effects of display duration, target eccentricity, orientation and spatial frequency. Vision Research, 38, 347–374. Cave, K. R., & Wolfe, J. M. (1990). Modeling the role of parallel processing in visual search. Cognitive Psychology, 22, 225–271. Chandler, J. D. (1969). Subroutine STEPIT: Finds local minima of a smooth function of several parameters. Behavioral Science, 14, 81– 82. Dosher, B. (1976). The retrieval of sentences from memory: A speed– accuracy study. Cognitive Psychology, 8, 291–310. Dosher, B. (1979). Empirical approaches to information processing: Speed–accuracy tradeoff functions or reaction time. Acta Psychologica, 43, 347–359. Dosher, B. (1981). The effect of delay and interference: A speed–accuracy study. Cognitive Psychology, 13, 551–582. Dosher, B. (1982). Effect of sentence size and network distance on retrieval speed. Journal of Experimental Psychology: Learning, Memory, and Cognition, 8, 173–207. Dosher, B. (1984). Degree of learning and retrieval speed: Study time and multiple exposures. Journal of Experimental Psychology: Learning, Memory, and Cognition, 10, 541–574. Dosher, B. (1998). Models of visual search: Finding a face in the crowd. In D. N. Osherson (Series Ed.) & D. Scarborough & S. Sternberg (Vol.
Eds.), Invitation to cognitive science: Vol. 4. Methods, models, and conceptual issues (2nd ed., pp. 455–521). Cambridge, MA: MIT Press. Dosher, B., Han, S., & Lu, Z.-L. (1998, November). Time course of visual search among homogeneous and heterogeneous distractors. Paper presented at the 39th Annual Meeting of the Psychonomic Society, Dallas, TX. Dosher, B., Han, S., & Lu, Z.-L. (2003). Time course of homogeneous and heterogeneous visual search. Unpublished manuscript. Dosher, B., & McElree, B. (1992). Memory search: Retrieval processes in short-term and long-term recognition. In L. R. Squire (Ed.), Encyclopedia of learning and memory (pp. 398 – 406). New York: Macmillan. Duncan, J., & Humphreys, G. W. (1989). Visual search and stimulus similarity. Psychological Review, 96, 433– 458. Eckstein, M. P. (1998). The lower visual search efficiency for conjunctions is due to noise and not serial attentional processing. Psychological Science, 9, 111–118. Egeth, H., Virzi, R. A., & Garbart, H. (1984). Searching for conjunctively defined targets. Journal of Experimental Psychology: Human Perception and Performance, 10, 32–39. Geisler, W. S., & Chou, K. L. (1995). Separation of low-level and highlevel factors in complex tasks: Visual search. Psychological Review, 102, 356 –378. Humphreys, G. W., & Muller, H. J. (1993). Search via recursive rejection (SERR): A connectionist model of visual search. Cognitive Psychology, 25, 43–110. Luce, R. D. (1986). Response times. Oxford, England: Oxford University Press. Macmillan, N., & Creelman, C. D. (1991). Detection theory: A user’s guide. New York: Cambridge University Press. McElree, B., & Carrasco, M. (1999). The temporal dynamics of visual search: Evidence for parallel processing in feature and conjunction searches. Journal of Experimental Psychology: Human Perception and Performance, 25, 1517–1539. McElree, B., & Dosher, B. (1989). Serial position and set size in short-term memory: Time course of recognition. Journal of Experimental Psychology: General, 118, 346 –373. McElree, B., & Dosher, B. (1993). Serial retrieval processing in the recovery of order information. Journal of Experimental Psychology: General, 122, 291–315. Miller, J. (1991). Channel interaction and the redundant-targets effect in bimodal divided attention. Journal of Experimental Psychology: Human Perception and Performance, 17, 160 –169. Miller, J. (1996). The sampling distribution of d⬘. Perception & Psychophysics, 58, 65–72. Motter, B. C., & Belky, E. J. (1998). The zone of focal attention during active visual search. Vision Research, 38, 1007–1022. Murdock, B. B., Jr. (1971). A parallel-processing model for scanning. Perception & Psychophysics, 10, 289 –291. Nagy, A. L., & Cone, S. M. (1996). Asymmetries in simple feature searches for color. Vision Research, 36, 2837–2847. Neisser, U. (1967). Cognitive psychology. New York: Appleton-CenturyCrofts. Palmer, J. (1994). Set-size effects in visual search: The effect of attention is independent of the stimulus for simple tasks. Vision Research, 34, 1703–1721. Palmer, J. (1995). Attention in visual search: Distinguishing four causes of a set-size effect. Current Direction in Psychological Science, 4, 118 – 123. Palmer, J., Ames, C. T., & Lindsey, D. T. (1993). Measuring the effect of attention on simple visual search. Journal of Experimental Psychology: Human Perception and Performance, 19, 108 –130. Palmer, J., Verghese, P., & Pavel, M. (2000). The psychophysics of visual search. Vision Research, 40, 1227–1268. Pashler, H. (1987). Detecting conjunctions of color and form: Reassessing the serial search hypothesis. Perception & Psychophysics, 41, 191–201.
PARALLEL ASYMMETRIC SEARCH Ratcliff, R. (1978). A theory of memory retrieval. Psychological Review, 85, 59 –108. Reed, A. V. (1973, August 10). Speed–accuracy trade-off in recognition memory. Science, 181, 574 –576. Reed, A. V. (1976). List length and the time course of recognition in immediate memory. Memory & Cognition, 4, 16 –30. Rosenholtz, R. (2001). Search asymmetries? What search asymmetries? Perception & Psychophysics, 63, 476 – 489. Rubenstein, B. S., & Sagi, D. (1990). Spatial variability as a limiting factor in texture-discrimination tasks: Implications for performance asymmetries. Journal of the Optical Society of America A, 7, 1632–1643. Rumelhart, D. E. (1970). A multicomponent theory of the perception of briefly exposed visual displays. Journal of Mathematical Psychology, 7, 191–218. Shaw, M. L. (1982). Attending to multiple sources of information: I. The integration of information in decision making. Cognitive Psychology, 14, 353– 409. Shaw, M. L., & Shaw, P. (1977). Optimal allocation of cognitive resources to spatial locations. Journal of Experimental Psychology: Human Perception and Performance, 3, 201–211. Sperling, G. (1960). The information available in brief visual presentation. Psychological Monographs, 74(11, Whole No. 498). Sperling, G., Budiansky, J., Spivak, J. G., & Johnson, M. C. (1971, October 15). Extremely rapid visual search: The maximum rate of scanning letters for the presence of a numeral. Science, 174, 307–311. Sperling, G., & Dosher, B. (1986). Strategy and optimization in human information processing. In K. R. Boff, L. Kaufman, & J. P. Thomas (Eds.), Handbook of perception and human performance (Vol. 1, pp. 1– 65). New York: Wiley. Sperling, G., & Weichselgartner, E. (1995). Episodic theory of the dynamics of spatial attention. Psychological Review, 102, 503–532. Sutter, A., & Graham, N. V. (1995). Investigating simple and complex
25
mechanisms in texture segregation using the speed–accuracy tradeoff method. Vision Research, 35, 2825–2843. Sutter, A., & Hwang, D. (1999). A comparison of the dynamics of simple (Fourier) and complex (non-Fourier) mechanisms in texture segregation. Vision Research, 39, 1943–1962. Townsend, J. T., & Ashby, F. G. (1983). The stochastic modeling of elementary psychological processes. New York: Cambridge University Press. Treisman, A. M. (1988). Features and objects: The Fourteenth Bartlett Memorial Lecture. Quarterly Journal of Experimental Psychology: Human Experimental Psychology, 40(A), 201–237. Treisman, A., & Gelade, G. (1980). A feature-integration theory of attention. Cognitive Psychology, 12, 97–136. Treisman, A., & Gormican, S. (1988). Feature analysis in early vision: Evidence from search asymmetries. Psychological Review, 95, 15– 48. Wannacott, T. H., & Wannacott, R. J. (1981). Regression: A second course in statistics. New York: Wiley. Williams, D., & Julesz, B. (1992). Perceptual asymmetry in texture perception. Proceedings of the National Academy of Sciences, USA, 89, 6531– 6534. Wolfe, J. M. (1994). Guided search 2.0: A revised model of visual search. Psychonomic Bulletin & Review, 1, 202–238. Wolfe, J. M. (2001). Asymmetries in visual search: An introduction. Perception & Psychophysics, 63, 381–389. Wolfe, J. M., & Friedman-Hill, S. R. (1992). Visual search for orientation: The role of angular relations between targets and distractors. Spatial Vision, 6, 199 –208. Wolfe, J. M., Friedman-Hill, S. R., Stewart, M. I., & O’Connell, K. M. (1992). The role of categorization in visual search for orientation. Journal of Experimental Psychology: Human Perception and Performance, 18, 34 – 49.
(Appendix follows)
DOSHER, HAN, AND LU
26
Appendix “Bayesian” Sophisticated-Guessing Models The probabilistic parallel search model (PSM) and the probabilistic serial search model (SSM) were extended to incorporate sophisticated guessing into the search models. In these models, partial information about the completed comparison operations is incorporated into the guessing processes for the visual search models. Categorizing a display element as a target, correctly or in error, terminates the process by moving the observer into a positive information state, leading to a yes response. By definition, then, only prior comparisons ending, correctly or in error, in a “distractor” identification lead to sophisticated guessing. The Bayesian sophisticated-guessing models are straightforward elaborations of the simpler PSM or SSM. The impact of the modified guessing is nearly identical for target-present and target-absent displays until quite late in the process (when target-present trials are likely to have completed), and these models have little effect in reducing the impact of serial processing early in the time course of processing. In consequence, the quantitative fits of the guessing-elaborated and the standard probabilistic models to time-course (d⬘) data are very similar to one another. The equations for the sophisticated-guessing model appear below. In these equations, all of the guessing is integrated into each equation part (unlike those for the probabilistic serial and parallel models in the body of the article, in which a common guessing component was implemented separately). As in the previous developments, cases and probabilities are counted for latent processes (i.e., those that would have gone to a correct or incorrect classification if they had gone to completion), and then the probabilities of completing particular cases first are factored in for each.
Bayesian Serial Model: Target Present
PYes 共t兩TP兲 ⫽
再
1 N
冋
冘 N
m⫽1
⫺ G共t兩 , l ⫹ 1兲兲
冋 再 冘冘 冘 l⫽0
冘 l⫽0
N
m⫽1

p
m⫹k⫺1 D

l⫽0

冘
冋
册 冋冘
册冎
册冎
共N ⫺ l兲 (G共t兩 , l兲 ⫺ G共t兩 , l ⫹ 1兲)  N
⫹ pDN
l⫽0

l⫽0
N⫺1
⫺ G共t兩 , l ⫹ 1兲
冘
m⫺1
pDm⫺1 共1 ⫺ pD兲 G共t兩 , m兲 ⫹
m⫽1
pNo 共t兩TP兲 ⫽ 1 ⫺ pYes 共t兩TP兲.
共N ⫺ l兲 N
moves guessing from  when no comparisons are completed toward (N ⫺ N)/N ⫽ 0 when all comparisons are completed without finding a target. The response rates, of course, go immediately to 1.0 when a target is (correctly or incorrectly) identified.
pDk 共1 ⫺ pD兲
冋
冋冘
where (G(t兩, l) ⫺ G(t兩, l ⫹ 1)) is the probability that l but not yet l ⫹ 1 comparisons have completed. This counts all comparison completions in succession. The term
N
m⫺2
共N ⫺ l兲 共G共t兩 , l兲 ⫺ G共t兩 , l ⫹ 1兲兲 N
⫹ pDN⫺1 共1 ⫺ pT兲
共N ⫺ 1兲 共G共t兩 , l兲 ⫺ G共t兩 , l ⫹ 1兲兲, N
Bayesian Serial Model: Target Absent

共N ⫺ l兲 G共t兩 , l兲 N
共N ⫺ l兲 共G共t兩 , l兲 ⫺ G共t兩 , l ⫹ 1兲兲 N
册
pNo 共t兩TA兲 ⫽ 1 ⫺ pYes 共t兩TA兲. For target-absent displays leading to a yes response, the equation is broken into two parts: (a) cases in which m ⫺ 1 distractors are correctly identified before a distractor is misidentified as a target and (b) cases in which all distractors are ultimately correctly identified and the term calculates the probabilities of guessing.
共1 ⫺ pT兲共1 ⫺ pD兲 G共t兩 , m ⫹ k ⫹ 1兲
N⫺1

l⫽0
pYes 共t兩TA兲 ⫽
共N ⫺ l兲 共G共t兩 , l兲 ⫺ G共t兩, l ⫹ 1兲兲  N
k⫽0
冘
m⫺1
共N ⫺ 1兲 共G共t兩 , l兲 N
m⫽2 k⫽0
N⫺1 N⫺m⫺1
m⫹k
⫹
1 N
k
⫻ G共t兩 , k ⫹ 1兲 ⫹
1 ⫹ N
l⫽0
册冎 再 冘 冘 ⫹
冘
m⫺1
pDm⫺1 pT G共t兩 , m兲 ⫹
For target-present displays leading to a yes response, the equation is broken into four parts: (a) cases in which m ⫺ 1 distractors are correctly identified before the target is correctly identified; (b) cases in which k distractors are correctly identified before a distractor is identified in error as a target, all before the target is processed; (c) cases in which m ⫹ k ⫺ 1 distractors are correctly identified, and the target is incorrectly identified as a distractor before a distractor is incorrectly classified as a target; (d) all N ⫺ 1 distractors are correctly classified, and the target is incorrectly classified as a distractor. The probability of responding no is simply the converse of the probability of responding yes. The sequence of serial comparison operations continues until a target is found (correctly or in error) or until all comparisons are completed without finding a target. Bayesian, or sophisticated, guessing reduces the probability of saying “yes” every time a comparison is completed without finding a target. These all take a form like the following:
Bayesian Parallel Model: Target Present
册
In the parallel model, again, performance is computed based on the latent outcomes of the identifications of all items in the display. For each part, the number and probability of items identified (correctly or incorrectly) as targets is calculated, and the time course depends on a race between each of these processes, which determines the first time at which a “target” is identified:
PARALLEL ASYMMETRIC SEARCH
冘
N⫺1
pYes 共t兩TP兲 ⫽
m⫽0
冤
共1 ⫺ 共1 ⫺ G共t兩 , ␣ 兲兲
兲

l⫽0
冘
N⫺m⫺1
l⫽0
冘
N⫺1
⫹
m⫽1

冥
冘 l⫽0

K! 共N ⫺ l兲 共G共t兩 , l兲 l共1 ⫺ G共t兩 , l ⫹ 1兲 K⫺l 兲兲, N l!共K ⫺ l兲!
where K is the number of parallel processes (latent target identifications) racing for the first target identification, l is the number of completed processes,
共N ⫺ l兲 共N ⫺ m ⫺ 1兲! 共G共t兩 , ␣ 兲兲 l(共1 ⫺ G共t兩 , ␣ 兲兲 N⫺l N l!共N ⫺ m ⫺ l ⫺ 1兲!
K! l!共K ⫺ l兲!
共N ⫺ 1兲! 共1 ⫺ pT兲pN⫺m⫺1 共1 ⫺ pD兲 m· · · D m!共N ⫺ m ⫺ 1兲!
calculates the probabilities of these cases, and (G(t兩, l)l(1 ⫺ G(t兩, l ⫹ 1)K⫺1)) is the probability that l of K parallel processes have completed. The term
共1 ⫺ 共1 ⫺ G共t兩 , ␣ 兲兲 m兲
N⫺m
⫹
冘
K⫺1
⫹
冤
where N is the total number of items and l is the number of identification processes that have been completed. These guessing components all take a form like
共N ⫺ 1兲! p pN⫺m⫺1 共1 ⫺ pD兲 m· · · m!共N ⫺ m ⫺ 1兲! T D
m⫹1

冥
共N ⫺ l兲 共N ⫺ m兲! 共G共t兩 , ␣ 兲兲 l共1 ⫺ G共t兩 , ␣ 兲兲 N⫺l N l!共N ⫺ m ⫺ l兲!
冤冘 N
⫹ 共1 ⫺ pT兲pN⫺1 D
l⫽0

27
moves guessing from  when no comparisons are completed towards (N ⫺ N)/N ⫽ 0.
冥
共N ⫺ l兲 N! 共G共t兩 , ␣ 兲兲 l共1 ⫺ G共t兩 , ␣ 兲兲 N⫺l N l!共N ⫺ l兲!
PNo 共t兩TP兲 ⫽ 1 ⫺ pYes 共t兩TP兲. For target-present displays leading to a yes response, the equation is broken into three parts: (a) cases in which the target and m of N ⫺ 1 distractors would all (latently) be identified (or misidentified) as a target, and the time course represents a race between m ⫹ 1 parallel identification processes; (b) cases in which the m distractors would (latently) be misidentified as targets, the target would be missed, and the time course represents a race between m parallel identification processes; (c) all N ⫺ 1 distractors are correctly classified and the target is missed, and a race between N identifications determines the guessing factors. As in the serial model, the Bayesian or sophisticated-guessing correction depends on the number of identifications completed prior to finding a target, 共N ⫺ l兲 ,  N
共N ⫺ l兲 N
Bayesian Parallel Model: Target Absent
冘 N
pYes 共t兩TA兲 ⫽
m⫽0
冘
N⫺m
⫹
l⫽0

冋
N! pN⫺m(1 ⫺ pD)m· · · 共1 ⫺ 共1 ⫺ G共t兩 , ␣ 兲兲 m兲 m!共N ⫺ m兲! D 共N ⫺ l兲! 共N ⫺ l兲 共G共t兩 , ␣ 兲兲 l共1 ⫺ G共t兩 , ␣ 兲兲 N⫺l N l!共N ⫺ m ⫺ l兲!
册
PNo 共t兩TA兲 ⫽ 1 ⫺ pYes 共t兩TA兲. For target-absent displays leading to a yes response, performance depends on a race between m distractors that are (latently) identified incorrectly as a target.
Received September 20, 2001 Revision received November 21, 2002 Accepted April 4, 2003 䡲