Clinical Trial published: 29 November 2017 doi: 10.3389/fpsyt.2017.00259
Parameter-Based Evaluation of attentional impairments in Schizophrenia and Their Modulation by Prefrontal Transcranial Direct Current Stimulation Nadine Gögler 1*, Irina Papazova2, Tatiana Oviedo-Salcedo 2, Nina Filipova 2, Wolfgang Strube 2, Johanna Funk1, Hermann J. Müller1, Kathrin Finke1,3† and Alkomiet Hasan2† 1 Department of Psychology, Ludwig-Maximilians-Universität München, München, Germany, 2 Department of Psychiatry and Psychotherapy, Ludwig-Maximilians-Universität München, München, Germany, 3 Hans-Berger-Department of Neurology, Friedrich-Schiller-Universität Jena, Jena, Germany
Background: Attentional dysfunctions constitute core cognitive symptoms in schizophrenia, but the precise underlying neurocognitive mechanisms remain to be elucidated. Edited by: Paul Croarkin, Mayo Clinic Minnesota, United States Reviewed by: Raymond Young-Jin Cho, Baylor College of Medicine, United States George Foussias, Centre for Addiction and Mental Health, Canada *Correspondence: Nadine Gögler
[email protected] †
These authors have contributed equally as senior authors. Specialty section: This article was submitted to Neuroimaging and Stimulation, a section of the journal Frontiers in Psychiatry
Received: 11 October 2017 Accepted: 14 November 2017 Published: 29 November 2017 Citation: Gögler N, Papazova I, OviedoSalcedo T, Filipova N, Strube W, Funk J, Müller HJ, Finke K and Hasan A (2017) Parameter-Based Evaluation of Attentional Impairments in Schizophrenia and Their Modulation by Prefrontal Transcranial Direct Current Stimulation. Front. Psychiatry 8:259. doi: 10.3389/fpsyt.2017.00259
Frontiers in Psychiatry | www.frontiersin.org
Methods: In this randomized, double-blind, sham-controlled study, we applied, for the first time, a theoretically grounded modeling approach based on Bundesen’s Theory of Visual Attention (TVA) to (i) identify specific visual attentional parameters affected in schizophrenia and (ii) assess, as a proof of concept, the potential of single-dose anodal transcranial direct current stimulation (tDCS; 20 min, 2 mA) to the left dorsolateral prefrontal cortex to modulate these attentional parameters. To that end, attentional parameters were measured before (baseline), immediately after, and 24 h after the tDCS intervention in 20 schizophrenia patients and 20 healthy controls. results: At baseline, analyses revealed significantly reduced visual processing speed and visual short-term memory storage capacity in schizophrenia. A significant stimulation condition × time point interaction in the schizophrenia patient group indicated improved processing speed at the follow-up session only in the sham condition (a practice effect), whereas performance remained stable across the three time points in patients receiving verum stimulation. In healthy controls, anodal tDCS did not result in a significant change in attentional performance. Conclusion: With regard to question (i) above, these findings are indicative of a processing speed and short-term memory deficit as primary sources of attentional deficits in schizophrenia. With regard to question (ii), the efficacy of single-dose anodal tDCS for improving (speed aspects of visual) cognition, it appears that prefrontal tDCS (at the settings used in the present study), rather than ameliorating the processing speed deficit in schizophrenia, actually may interfere with practice-dependent improvements in the rate of visual information uptake. Such potentially unexpected effects of tDCS ought to be taken into consideration when discussing its applicability in psychiatric populations. The study was registered at http://apps.who.int/trialsearch/Trial2.aspx?TrialID=DRKS00011665. Keywords: transcranial direct current stimulation, schizophrenia, visual processing speed, visual short-term memory, theory of visual attention, dorsolateral prefrontal cortex
1
November 2017 | Volume 8 | Article 259
Gögler et al.
Influence of tDCS on Attention in Schizophrenia
attentional impairments (13, 21–25). Accordingly, modulation of intrinsic prefrontal networks through tDCS has recently been proposed as potential non-invasive and safe treatment option for the remediation of cognitive dysfunctions in schizophrenia patients (26, 27). tDCS modulates cortical excitability by passing small direct currents on to the scalp via electrodes with anodal and cathodal polarity. While short-term tDCS effects are attributed to tonic modulations of the resting membrane potential of cortical neurons affecting their firing rates, prolonged after-effects are presumed to be controlled by protein synthesis-dependent processes at the synaptic level (28–31). Preliminary studies already provided promising results regarding the potential of tDCS to remediate cognitive deficits in psychiatric diseases, for example, in patients with major depression (18, 32, 33) or alcohol dependence (34). However, with respect to schizophrenia, the available evidence is scarce and mixed (35, 36): one study applied 20 min of anodal tDCS with 2 mA to the left dlPFC and could not show that anodal tDCS improves performance on a procedural learning task in the whole sample, but still had a beneficial effect in a subgroup of patients (37). Another single-session experiment reported a positive effect of 2 mA anodal, but not 1 mA or sham, tDCS to the left dlPFC on a WM task, 20 and 40 min after stimulation (38). By contrast, in another study, a similar stimulation protocol was shown to be ineffective to influence cognitive functions measured by the MATRICS consensus cognitive battery composite score (39). To expand our knowledge about the possible efficacy of tDCS in schizophrenia, in the second step of this proof-of-principle study, we explored whether the modulation of intrinsic networks through single-dose tDCS can have a functional significance for cognitive, and more specifically, visual attentional processes in schizophrenia (40). As anodal tDCS applied to the left dlPFC was previously shown to modulate intrinsic fronto-parietal networks in healthy humans, the beneficial cognitive effect of prefrontal tDCS has been attributed to an increase of the state of alertness (41). Consequently, we hypothesized that prefrontal tDCS would influence particularly alertness-dependent cognitive processes, such as the speed by which visual stimuli are processed (42–44). On the other hand, tDCS could also affect other attentional components such as vSTM storage capacity or attentional selectivity, subserved, at least partly, by prefrontal cortex and its functional and structural connections. Measures assessing tDCS-induced benefits should be able to disentangle the potential effects on different attentional component processes subserved by prefrontal cortex (13, 38, 45, 46). Furthermore, as the effects induced by single-dose tDCS are subtle (47, 48), highly sensitive tools are a prerequisite for reliably detecting any (likely small) modulations of the various cognitive sub-processes. Previous studies using pharmacological interventions or cue stimuli have already revealed the high sensitivity of TVA parameters even to small manipulations of the alertness level (19, 42–44). In this respect, TVA-based parametric attentional assessment provides, arguably, the best available tool for the aims of the present study, to (i) create a meaningful “attentional profile” of schizophrenia patients and (ii) to examine for (subtle) tDCS-induced changes in attentional functions in these patients.
INTRODUCTION Visual attention dysfunctions, ranging from impairments in processing speed and visual short-term memory (vSTM) capacity to deficient top-down control (1–6), are commonly reported in schizophrenia and schizophrenia-spectrum disorders. However, the question of the precise neurocognitive mechanisms underlying the difficulties in attention tasks has not yet been resolved conclusively. For instance, it remains elusive whether both processing speed and working memory (WM) functions are affected in schizophrenia (7) or whether slowed encoding processes are responsible for the reduced vSTM storage capacity in the respective attention tasks (2, 8, 9). Likewise, it is not clear whether the impaired encoding processes arise from impaired top-down controlled distractor inhibition (10–14). To determine whether these deficits can be attributed to losses of specific fundamental attention functions, a theoretically grounded modeling approach is required that can isolate and quantify (potentially compromised) core functions in an unconfounded measurement. Such an approach is provided by Bundesen’s Theory of Visual Attention [TVA; (15)], which already proved valuable for systematically characterizing cognitive deficits in diverse neuropsychiatric and neurological disorders (16–18). By combining this framework theory with simple psychophysical tests of whole- and partial-report of briefly presented letters, it is possible to derive independent estimates of parameters reflecting the individual efficiency of core visual attention functions. Two of these parameters, visual processing speed, the rate of information uptake per second (C), and vSTM storage capacity, the maximum number of visual objects that can be represented at one time (K), capture general capacity aspects of the system; and the top-down control parameter (α) describes the system’s (top-down) attentional selectivity. The ability of the TVA-based approach to provide “process-pure” and independent measures of the various attention functions has been demonstrated in a range of studies revealing disorder-specific patterns of attentional deficits, for instance, selective impairment in only one parameter but not the others (16, 17). Similarly, in healthy individuals, externally induced modulations of the alertness level have been shown to specifically increase processing speed, without influencing vSTM storage capacity (19). Furthermore, as the tasks do not require speeded responses, the parameters can be estimated uninfluenced by (e.g., antipsychotic drug-induced) motor side effects. Importantly also, unlike most standard neurocognitive tests, TVA-based assessment is highly sensitive so that even subtle deviations of cognitive performance from the norm can reliably be detected (20). Given these advantages, the TVAbased approach is well suited for the prime purpose of the present study: to identify the specific attentional functions that are compromised in schizophrenia. A secondary aim of this study was to investigate whether the compromised attentional performance in schizophrenia patients can be modulated by means of prefrontal transcranial direct current stimulation (tDCS). On a neuronal level, abnormal activation patterns within dorsolateral prefrontal cortex (dlPFC) attention networks are discussed as the underlying source of these
Frontiers in Psychiatry | www.frontiersin.org
2
November 2017 | Volume 8 | Article 259
Gögler et al.
Influence of tDCS on Attention in Schizophrenia
METHODS
Calgary Depression Rating Scale for Schizophrenia (CDSS)] (49, 50), disease severity [Clinical Global Impression Scale (CGI)] (51), and functioning [Global Assessment of Functioning Scale (GAF)] (52). The clinical rater (Irina Papazova) was not involved in any other aspects of the study and had undergone extensive training in the use of the scales. Participants with a contraindication to tDCS were excluded. Further exclusion criteria were an IQ below 86 (German Multiple-Choice Vocabulary Test MWT-B) (53), red–green color blindness, and suicidal intent. All except one patient received second-generation antipsychotics and one patient received an additional first-generation antipsychotic medication. 68% of the patients received antipsychotic monotherapy. Furthermore, all patients were clinically stable as indicated by the PANSS values (see Table 2). This study was carried out in accordance with the recommendations of LMU Munich Medical Faculty ethics committee with written informed consent from all participants. All participants gave written informed consent in accordance with the Declaration of Helsinki. The protocol was approved by the LMU Munich Medical Faculty ethics committee. Participants were monetarily compensated for their participation. The study was registered at https://www.drks.de (identifier: DRKS 00011665) and the WHO international clinical trials registry platform.1
Participants
20 patients with a ICD-10 diagnosis of schizophrenia or schizophrenia-spectrum disorder (F20 = 19; F25 = 1), recruited from the Department of Psychiatry and Psychotherapy (LMU Munich), and the same 20, demographically matched, healthy controls that participated in our previous study (18), were included in the investigation (see Tables 1 and 2 for demographic and clinical data). The diagnoses, according to the WHO ICD-10 criteria for schizophrenia or schizophrenia-spectrum disorder, were made by two clinical psychiatrists of whom one (Alkomiet Hasan) is a member of this study group. The period of recruitment lasted from May 2015 until October 2016. The trial ended after the target sample size was reached. The sample size was estimated from previous experimental studies investigating the effect of alertness manipulations on TVA parameters in healthy participants (42, 43). Patients were assessed for psychopathological symptoms [Positive and Negative Syndrome Scale (PANSS); TABLE 1 | Group demographics. Schizophrenia patients
Healthy controls
p-Value
36.55 (9.16) 13/7 18/1/1 10.5 (1.57) 106.88 (16.11)
31.7 (8.31) 10/10 18/2/0 12.8 (0.37) 112.2 (18.64)
0.09 0.34 0.51 0.01 0.37
Age Gender (m/f) Handedness (r/l/a) Education (years) Verbal IQ (MWT-B)
Study Protocol
The experiment consisted of four sessions taking place on consecutive days at about the same daytime each. On day 1, participants were trained on the respective tasks of the TVA-based assessment. On day 2, a baseline TVA-based assessment was conducted (T0)
Data are presented as means ± SDs or frequencies. MWT-B, German Multiple-Choice Vocabulary Test; f, female; m, male; r, right; l, left; a, ambidextrous. p-Values refer to a statistical comparison between the schizophrenia patient and healthy control group.
http://apps.who.int/trialsearch/Trial2.aspx?TrialID=DRKS00011665.
1
TABLE 2 | Comparison of demographics and clinical ratings for verum and sham groups. Schizophrenia patients Verum Age Gender (m/f) Handedness (r/l/a) Education (years) MWT-B Duration of illness (years) CDSS GAF CGI PANSS score Positive Negative General Total CPZ equivalents Antidepressants (y/n) Mood stabilizer (y/n)
33.2 (7.67) 4/6 9/1/0 10.8 (1.93) 110.62 (20.6) 7.15 (5.87) 5.9 (3.81) 56.9 (8.17) 4.2 (0.63) 13.4 (4.22) 18.3 (3.89) 31.4 (5.74) 63.1 (11.93) 437.5 (244.73) 2/8 1/9
Healthy controls
Sham
p-Value
Verum
Sham
p-Value
39.9 (9.65) 3/7 9/0/1 10.2 (1.14) 103.13 (9.99) 6.56 (5.22) 4.5 (2.8) 62.67 (5.29) 3.7 (0.48)
0.54 0.64 0.37 0.41 0.38 0.82 0.36 0.09 0.06
30.8 (9.34) 5/5 9/1/0 12.8 (0.42) 105.8 (14.48) – – – –
32.6 (7.52) 5/5 9/1/0 12.9 (0.32) 118.6 (20.81) – – – –
0.64 1.0 1.0 0.56 0.13 – – – –
12.0 (3.86) 16.4 (6.19) 29.0 (8.82) 57.4 (18.14) 443.47 (490.26) 5/5 0/10
0.45 0.42 0.48 0.42 0.97 0.35 1.0
– – – – – –
– – – – – –
– – – – – –
Data are presented as means ± SDs or frequencies. MWT-B, German Multiple-Choice Vocabulary Test; CDSS, Calgary Depression Rating Scale for Schizophrenia; GAF, Global Assessment of Functioning Scale; CGI, Clinical Global Impression Scale; PANSS, Positive and Negative Syndrome Scale; f, female; m, male; r, right; l, left; a, ambidextrous; CPZ, chlorpromazine. p-Values refer to a statistical comparison between verum and sham condition within the schizophrenia patient and healthy control group.
Frontiers in Psychiatry | www.frontiersin.org
3
November 2017 | Volume 8 | Article 259
Gögler et al.
Influence of tDCS on Attention in Schizophrenia
and participants were randomly assigned to either the verum or the sham tDCS condition. On day 3, the TVA-based assessment (T1) took place straightaway after the tDCS (anodal or sham), and on day 4, a follow-up assessment of the attentional parameters (T2) was conducted to examine for the consolidation of potential tDCS after-effects (see Figure 1).
appearing repeatedly in one trial. The stimuli display was either followed by an empty black screen or a pattern mask consisting of a blue-red scattered square (≈1.5° visual angle) visible for 500 ms at each stimulus location. The participant was instructed to report the letters in any order and without speed stressing. The experimenter typed the responses on a keyboard and then initialized the next trial. After each block, a visual performance feedback informed the participants about the amount of correctly named letters out of all reported ones (in %). To avoid too conservative and too liberal responses, participants should aim for correctness between 70 and 90%.
Attentional Assessment Based on Bundesen’s TVA
Primary outcome measure for attentional functioning was the parametric attentional assessment based on Bundesen’s TVA (15). Participants were tested at baseline, directly after, and 24 h after tDCS intervention (see Figure 1).
TVA-Based Whole Report
On each trial six letters, either all red or blue, appeared on an imaginary circle with a radius of 6 cm (5.73° of visual angle) around the fixation point (see Figure 2A). Participants had to identify and report as many letters as possible. To find the five adequate exposure durations for a given participant a pretest of four blocks à 12 trials was conducted prior to the main whole-report task in each test session. Three types of trials were used in this pretest: two “easy” trials (i.e., one longer and one unmasked trial) and one adjusting trial in which initially, the six letters were flashed for 80 ms. If the participant could correctly identify at least one letter, exposure durations were decreased in steps of 10 ms until the lowest individual threshold, for which no letter could be reported anymore, was detected. This threshold was used to find an adequate set of four additional, longer exposure durations for the subsequent whole-report task (e.g., 10, 20, 40, 90, and 200 ms). In these five conditions, letters were masked. Additionally, in two unmasked conditions, letters were presented in the second shortest and the longest exposure duration condition. Consequently, there were seven “effective” exposure duration conditions. In unmasked trials an afterimage of the display emerges which extends the effective exposure durations by a constant duration which is defined by parameter μ (given in milliseconds) (56). The patient group’s average minimum exposure duration was 21 ms (SD = 4.47 ms) and did not differ significantly [t(38) = −1.1, p = 0.32] from that of the control group, which was on average 20 ms (SD = 0 ms). In total, the whole-report task consisted of 140 trials, separated into four blocks of 35 trials. Within each block, each display condition was presented equally often in randomized order. Based on the performance in the whole-report task, the individual processing capacity aspects reflected by the TVA parameters perceptual processing speed C and vSTM capacity K, can be
Framework of the TVA Approach
Theory of Visual Attention is a comprehensive mathematical model of selective attention (15, 54), which conceives of visual processing as a parallel competitive race of objects in the visual field for representation in a capacity-limited vSTM store (55): only those objects that are processed fastest will win the competition, that is, will be encoded in vSTM and thus become available for conscious report. The speed with which an object in the display is processed depends on the attentional weight assigned to it. Both bottom-up and top-down factors, such as, respectively, stimulus saliency and fit with instructed (selection-relevant) target features, are crucial determinants of the magnitude of the attentional weight allocated an object. Accordingly, only part of the objects will be represented within vSTM and can be used for further processing and goal-directed actions.
General Method for TVA Whole- and Partial-Report
Experiments took place in a dimly lit experimental laboratory at the Psychiatric Clinic of the Ludwig-Maximilians-Universität München (LMU Munich). TVA whole- and partial-report tasks were completed within one test session lasting about 1 h; task order was counterbalanced across participants. Stimuli were presented on a 27-inch PC monitor on a black background, with a refresh rate of 100 Hz and a resolution of 1,024 × 768 pixel. The viewing distance was set to approximately 60 cm. A trial started with the presentation of a white central fixation point (diameter: 1 cm) for 1,000 ms which participants were instructed to fixate throughout the whole trial. After 250 ms, red and/or blue letters were briefly flashed on the display with exposure durations that were adjusted individually according to a criterion value in a pretest. The letters were randomly selected from a predefined set (ABCDEFGHJKLMNOPRSTUVWXZ), with a letter never
FIGURE 1 | Flow-chart of the experiments.
Frontiers in Psychiatry | www.frontiersin.org
4
November 2017 | Volume 8 | Article 259
Gögler et al.
Influence of tDCS on Attention in Schizophrenia
FIGURE 2 | (A) Theory of Visual Attention (TVA) whole-report task procedure. After the presentation of a central fixation circle for 1,000 ms and a brief delay of 250 ms, six letters are flashed in an imaginary circle either in red or blue font for one of five individually adjusted exposure durations (identified in a pretest). In these five exposure duration conditions letters were masked for 500 ms. In two unmasked conditions, letters were presented in the second shortest and the longest exposure duration condition. (B) Trial sequence and (C) display types of TVA partial-report task. After the presentation of a central fixation for 1,000 ms and a brief delay of 250 ms, one of the 16 possible display types appears for a predetermined individual exposure duration. Following that, presented stimuli (T = target = red letters; D = distractor = blue letters) are masked for 500 ms. Adapted according to Gögler (18).
estimated by mathematical data modeling (57). The probability of stimulus identification is modeled by an exponential growth function, relating the mean number of reported objects to the exposure duration. The use of seven effective exposure durations allows a broad depiction of the performance spectrum including early and late aspects of participant’s whole-report functions, and consequently a reliable model fit of the data. The growth parameter reveals the rate at which stimuli are processed (measured in visual elements per second; C), and the asymptote specifies the maximum number of objects that can be represented within vSTM store (K) (see Figure 3). Two further parameters, the threshold of conscious perception t0 and the effective additional exposure duration in unmasked displays μ, were also estimated
Frontiers in Psychiatry | www.frontiersin.org
(and did not differ significantly between groups and were not modulated by tDCS). These parameters merely serve the valid estimation of the parameters of interest but apart from this, they were of no further relevance in the present study.
TVA-Based Partial Report
On each trial either one or two letters (1 target, 2 targets or a target plus distractor) were flashed in the corners of an imaginary square (located 7.5 cm around the fixation point). If two letters were presented on the display, they either appeared in a row or in a column, but never diagonally. Participants had to report target letters (in red color) only, while ignoring distractors (blue). The stimulus arrays (see Figure 2B) appeared in randomized order
5
November 2017 | Volume 8 | Article 259
Gögler et al.
Influence of tDCS on Attention in Schizophrenia
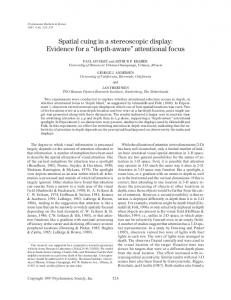
FIGURE 3 | Whole-report performance of a representative schizophrenia patient (A) and a healthy control participant (B). Mean number of correct letter reports as a function of exposure duration. Circles represent observed values (=obs), dashed lines represent the best fits of the observed scores by the applied model (pred = predicted). The estimate of visual short-term memory capacity K and processing speed C is indicated by the horizontal and diagonal dashed lines, respectively.
and stimuli were always masked for 500 ms. The partial-report task consisted of 16 conditions (4 single-target T, 8 target plus distractor T-D, 4 dual-target conditions T-T), which were counterbalanced across all six blocks (see Figure 2C). A pretest (two blocks of 24 trials) was used to determine the individual exposure durations of the presented letter(s): first, letters were displayed with an initial exposure duration of 80 ms. If participants could identify two letters in the dual-target condition, exposure duration was decreased by steps of 10 ms until they could name, on average, one letter per trial correctly, whereas the exposure duration was increased by steps of 10 ms if they could not identify any letter. Exposure duration was kept unchanged, if they could identify one of the two target letters. Next, performance at the determined exposure duration was verified for the different experimental conditions in another turn of 24 trials. An adequate performance is denoted by correctly reported letters of 70–90% for single target conditions (T) and at least 50% for dual-target conditions. Otherwise exposure durations were in- or decreased manually by the experimenter and performance was rechecked in another turn of 24 trials. The patient group’s average exposure duration was 81.5 ms (SD = 32.85) and did not differ significantly [t(38) = 0.95, p = 0.38] from those of the control group, that was on average 75.33 ms (SD = 27.69). The partial-report task consisted of 288 trials separated into six blocks of 48 trials. From the probability of stimulus identification, attentional weights are derived for targets (wT) and distractors (wD). Parameter α is defined as the ratio of distractor to target weights (wD/wT) and reflects top-down efficacy, i.e., the ability to prioritize task-relevant over task-irrelevant information. Values of α close to 0 indicate a high selectivity, i.e., targets receive more weight than distractors. Values of α close to 1 signify no selection and values larger than 1 imply that distractors receive more weight than targets, and hence were seen more easily.
saline-soaked surface sponge electrodes (35 cm2) at 2 mA for 20 min (plus 15 s fade-in and fade-out). The anode was placed above the left dlPFC located via F3 (EEG 10–20 system). This position covers Brodmann areas 8, 9, or 46 on the medial frontal gyrus—areas representative of the left dlPFC (58, 59). The cathode was placed above the right supraorbital area (FP2). This is the standard electrode montage used in physiological studies (60), and also in behavioral studies, this electrode montage was reported to modulate cognition both in healthy humans and patients (32, 38, 41). Based on previous publications, sham stimulation was performed in the same way as verum stimulation, but the current was applied only for 30 s (plus 15 s fade-in and fade-out) (61, 62). Participants were randomly assigned to verum or sham tDCS by a computer-generated randomization list.2 To ensure double-blindness of both participants and experimenter, the experimenter did not have access to this list during the study; moreover, tDCS was performed by investigators not otherwise involved in the examination of patients. The study was designed as a parallel trial: 10 patients received verum left-anodal tDCS, and the remaining 10 patients underwent sham tDCS. Similarly, 10 healthy control participants received verum tDCS and 10 healthy controls received sham tDCS. During the stimulation, participants were not performing any task. This “offline” protocol was chosen as we were mainly interested in tDCS after-effects on attentional functions—both immediate and longer lasting ones of potential clinical relevance. Potential tDCS-induced adverse effects were examined by a post hoc comfort rating scale filled in by the participants (63).
Data Analysis
Data were analyzed using IBM SPSS 22. The alpha level was set to 0.05. Baseline group differences in demographic and clinical variables were analyzed using independent t-tests for continuous variables and χ2 tests or, where appropriate, Fisher’s exact tests,
Transcranial Direct Current Stimulation
Transcranial direct current stimulation was delivered by a CE-certified stimulator (neuroConn, Germany) through
Frontiers in Psychiatry | www.frontiersin.org
https://www.random.org/lists/.
2
6
November 2017 | Volume 8 | Article 259
Gögler et al.
Influence of tDCS on Attention in Schizophrenia
for categorical variables. Baseline group differences in attentional performance as well as baseline differences in attentional performance, demographic, and clinical characteristics (patients) in participants assigned to the verum versus sham tDCS conditions within these two groups were analyzed by independent t-tests. Cohen’s d was calculated as a measure of the effect size for the group differences in attentional performance (64). To assess immediate and enduring effects of tDCS on the attentional parameters, two-way mixed ANOVAs were performed with time point (T0, T1, T2) as within-subject factor and stimulation condition (verum versus sham tDCS) as between-subjects factor, separately for the healthy control and the schizophrenia patient group. Mauchly’s test of sphericity was used to test the assumption of sphericity and, if significant, we applied Huynh–Feldt correction. In case of a significant interaction, the data were tested for simple main effects of time point, that is, we assessed differences in attentional parameters between time points for each level of the between-subjects factor stimulation condition. By means of χ2 tests, we assessed whether the number of participants who believed to have received verum stimulation differed between the verum and sham conditions. Furthermore, comfort ratings were compared between participants of the verum and sham conditions through independent t-tests.
TABLE 3 | Theory of Visual Attention whole- and partial-report parameters at baseline for the schizophrenia patient and healthy control group. Schizophrenia patients
C K α
M
SD
M
SD
29.55 3.01 0.35
21.21 0.78 0.18
43.86 3.67 0.36
19.18 0.94 0.22
p-Value
0.03 0.02 0.93
C, visual perceptual processing speed (elements/s); K, visual short-term memory capacity (number of elements); α, efficiency of top-down control. p-Values refer to a statistical comparison between the schizophrenia patient and healthy control group.
Perceptual Processing Speed C
Analysis revealed processing speed to be significantly lower in schizophrenia patients (M = 29.55 items/s, SD = 21.22) than in healthy controls [M = 43.86 items/s, SD = 19.18; t(38) = 2.24, p = 0.03] (see Figure 4). This effect is also illustrated by the slope of the whole-report functions depicted in Figure 3, which is steeper for the representative control participant than for the schizophrenia patient. Thus, the rate of visual information uptake within a given unit of time is significantly reduced in schizophrenia. Computation of Cohen’s d yielded a medium to large effect size (d = 0.7) and a 43% non-overlap of the two distributions of C scores.
vSTM Capacity K
RESULTS
Analysis disclosed vSTM storage capacity to be significantly decreased in schizophrenia patients (M = 3.01, SD = 0.78 items) compared to healthy controls [M = 3.67, SD = 0.94 items; t(38) = 2. 42, p = 0.02] (see Figure 4). As can be seen from Figure 3, as exposure duration increases, report performance approaches an asymptotic level, which represents the (depicted individuals’) vSTM storage capacity: the patient’s asymptote is lower than that of the healthy control participant—illustrating that the mean number of items that can be represented in vSTM is reduced in schizophrenia. The effect size is large (d = 0.8), with a 47.4% nonoverlap of the two distributions of K scores.
All schizophrenia patients and healthy control participants completed the entire experiment. No unexpected adverse effects of tDCS, such as skin burns, pain, or headache, were reported or revealed by the comfort rating questionnaire.
Demographic and Clinical Characteristics
The schizophrenia patient and healthy control groups were matched according to age (p = 0.09), gender (p = 0.34), IQ (p = 0.37), and handedness (p = 0.51). The two groups differed significantly with respect to education level (p