of a GA was first done by Mercer and Sampson in 1978. In their research they used a ... optimal. The meta-GA approach was: âJack of all trades, master of noneâ.
PARAMETER CALIBRATION USING META-ALGORITHMS W.A. de Landgraaf, A.E. Eiben, V. Nannen Vrije Universiteit, Amsterdam {wadlandg, gusz, volker}@cs.vu.nl
Abstract— Calibrating an evolutionary algorithm (EA) means finding the right values of algorithm parameters for a given problem. This issue is highly relevant, because it has a high impact (the performance of EAs does depend on appropriate parameter values), and it occurs frequently (parameter values must be set before all EA runs). This issue is also highly challenging, because finding good parameter values is a difficult task. In this paper we propose an algorithmic approach to EA calibration by describing a method, called REVAC, that can determine good parameter values in an automated manner on any given problem instance. We validate this method by comparing it with the conventional hand-based calibration and another algorithmic approach based on the classical meta-GA. Comparative experiments on a set of randomly generated problem instances with various levels of multi-modality show that GAs calibrated with REVAC can outperform those calibrated by hand and by the meta-GA.
I. I NTRODUCTION Calibrating an evolutionary algorithm (EA) means finding the right values of algorithm parameters for a given problem [7], [9]. This issue is highly relevant for two reasons. First, because it has a high impact. The performance of EAs does depend on appropriate parameter values that depend on the given problem instance. Second, because it occurs frequently: Before any run of any EA on any problem instance the parameter values must be set and the values must suit the instance at hand, cf. the previous point. This issue is also highly challenging, because finding good parameter values is a difficult task. This difficulty comes from the complexity of an evolutionary process in general, and the yet unknown effect of EA parameters on this process, in particular. To make things worse, parameters interact with each other. For instance, the appropriate level of selection pressure (e.g., tournament size) can depend on the intensity of mutation (e.g., mutation rate pm or mutation step-size σ). In contemporary practice, EA parameters are set by common “wisdom”, e.g., mutation size should be 1 divided by the chromosome length, or by statistical hypothesis testing, e.g., parameter sweeps comparing EA performance for a number of different setups. This is typically a laborious ad hoc procedure involving much handwork and heuristic choices. So far, no procedure has been established that can explore the full combinatorial range of possible parameter settings in a systematic and efficient way. Another problem is that studies on design aspects like confidence intervals for good parameter values and a sensitivity analysis for parameter robustness are scarce. Related work includes metaGAs after Grefenstette as an early attempt to automate GA calibration [12]. Czarn et al. [4] discuss current problems
in EA design and use polynomial models of a response curve to estimate confidence interval for parameter values. Franc¸ois and Lavergne [10] estimate response curves for EAs across multiple test cases to measure generalizability. Regarding general issues of methodology, the paper of Eiben and Jelasity [5] and the book of Bartz-Beielstein (partly inspired by this paper) [1] should be mentioned. In this paper we discuss the merits of the REVAC method that calibrates the parameters of an EA. For each parameter, the method produces a distribution over the parameter’s range that gives high probability to values leading to good EA performance. In this scheme, a distribution with a narrow peak indicates a highly relevant parameter (whose values largely influence EA performance and must be selected carefully from a small range of good values), while a broad plateau belongs to a moderately relevant parameter (whose values do not matter too much). In this study we apply REVAC to a genetic algorithm (GA) and seek answers to the following research questions: •
•
How good are the parameter values found by the REVAC method? That is, in comparison with values found by traditional alternatives, like hand-calibrated values and values found by a meta-GA. How robust are the parameter values found by the REVAC method? That is, how do parameter values found for problem X perform on a different problem Y?
Quite naturally, the goodness of parameter values is measured by the performance of the GA using those parameter values. The methodology we use is experimental. Our answers to the research questions are based on by comparing the performance of genetic algorithms calibrated by hand, by a meta-GA, and by REVAC. For the sake of reproducibility the problem generator used, all source code discussed in this paper, and demonstrations can be found on http://www.few.vu.nl/∼wadlandg/pcma http://www.few.vu.nl/∼gusz/resources http://www.complexity-research.org/revac/ The rest of the paper is organized as follows. In the following section we discuss existing approaches to calibrating EA parameters, including meta-GAs. In Section III we describe the REVAC method. Thereafter, in Section IV, we present the experimental setup including details of • • •
the problem instances to be solved (by a GA), the GAs to be calibrated (by a method), and the calibration methods themselves.
The experimental results are shown and discussed in Section V, the conclusions are summarized in Section VI. II. C ALIBRATION M ETHODS The name “parameter calibration” is in fact an umbrella term including various ways of obtaining and using values for EA parameters. For a clear positioning of the REVAC method, we briefly review the main categories as offered in [7], [9]. The first distinction to make is whether the chosen parameter values are fixed during an EA run, or subject to changes on-the-fly. The name parameter tuning stands for the first case. Here, the values are determined before the “real” EA run – typically requiring many runs with the same EA under different settings. Calibrating parameters with possible runtime changes is called parameter control that is further divided into three sub-categories: • Deterministic parameter control This takes place when the value of a parameter is altered by some deterministic rule. This rule modifies the parameter values in a fixed, predetermined (i.e., user-specified) way without using any feedback from the search. Usually, a timevarying schedule is used, e.g., the rule is applied after every period of N generations. • Adaptive parameter control This takes place when there is some form of feedback from the search that provides inputs to a mechanism used to determine the new parameter values. This input may involve credit assignment, i.e., the goodness of a parameter value based on the quality of solutions discovered by using it, or statistical data on the development of the population, e.g., population diversity, or fitness improvement over a given period. The important point to note is that the updating mechanism used to control parameter values is externally supplied, rather than being part of the “standard” evolutionary cycle. • Self-adaptive parameter control In this case the parameters to be adapted are encoded into the chromosomes and undergo mutation and recombination. The better values of these encoded parameters lead to better individuals, which in turn are more likely to survive and produce offspring and hence propagate these better parameter values. This is an important distinction between adaptive and self-adaptive schemes: in the latter the mechanisms for the credit assignment and updating of different strategy parameters are entirely implicit, i.e., they are the selection and variation operators of the evolutionary cycle itself. Traditionally, much attention has been devoted to tuning EA parameters. In particular, the rates for crossover and mutation have been studied extensively, although there are indications that manipulating parameters regarding the selection mechanism(s) and the population can be more rewarding, see [6] for a review. It has been repeatedly noted that parameter control is preferable over “simple” tuning, but it is safe to say that the large majority of EA practitioners uses
EAs where the values of the EA parameters do not change during a run. Putting it differently, the large majority of EA practitioners is in need of a good tuning method. There have been numerous attempts to offer algorithmic support for parameter tuning. A recent example is [20], where a framework has been constructed for parameter sweeping across the search space using a cluster of machines. Parameter sweeps, although useful for automating a process that is still done manually very often, can cover only a small portion of the entire search space due to the granularity and the need to artificially tone down the amount of parameters over which the framework sweeps. The irony of the problem of GA parameter calibration is that it belongs to the class of problems that can be handled very well by a GA: there is a vast search space with a high degree of complexity, interaction among the variables and local optima. Using a GA for calibrating the parameters of a GA was first done by Mercer and Sampson in 1978. In their research they used a GA for determining the best crossover and mutation operator probabilities. Their research was however limited due to the large computation costs at that time and based on a single run with a limited search space. A more elaborate experimentation was conducted by Grefenstette [12] and his approach has since been dubbed “Meta Genetic Algorithm”, or meta-GA. The main difference with his approach is that the second GA, the “lower-level” algorithm of which the parameters are being calibrated, does not have to be changed for the application of a meta-GA. The search space for Grefenstette’s meta genetic algorithm consisted of 218 parameter combinations. The results consisted of an optimization of 3% using slightly better parameters than previously known. However, only 20 metagenerations were evolved and only 2000 lower-level evaluations were performed. Nowadays this could be completed in a matter of minutes. It is therefore our opinion that the use of meta genetic algorithms is worthy for reconsideration. Research however didn’t stop after these first steps. In the early nineties a number of studies were conducted on metaGAs. Shahookar and Mazumder used a meta-GA approach in [22] for solving a cell placement problem for industrial circuits, which resulted in a decrease of 20 to 50 times in the number of configurations which had to be evaluated. Lee and Takagi [15] used a meta-GA similar to that of Grefenstette in studying the effects of a dynamic adaptive population size, crossover and mutation rates on the De Jong [13] set of test problems. Their results confirmed recent theoretical results on optimal mutation rates [11]. More recent research on meta-GAs has been infrequent and results have been varying at best. In [2] the conclusion was that although meta-GA is able to produce reasonable parameters for various problems, these parameters are far from optimal. The meta-GA approach was: ”Jack of all trades, master of none”. Other researchers however have found more positive results for this type of black-box optimization. In [3], a meta-GA was used for time-series forecasting. The results, when compared to existing techniques, showed an all-around
improvement on existing forecasting packages and similar results to an algorithm specifically designed for the domain. The researchers remarked that the strengths of the meta-GA approach is clearly seen for problems with a complex nonlinear behavior. In a recent study [21], Samsonovich and De Jong took a numerical approach to the “free lunch” that meta algorithms and meta-GAs seemed to offer. They attempted to calibrate GAs on three problems (2D optimization, the eight puzzle and binary dendritic tree reconstruction) and concluded that meta-evolution “may improve the performance of an evolutionary algorithm, if the fitness is appropriately defined at the meta-level(s)”. They also remarked that the search space that the meta algorithms look at must be chosen carefully, and that more levels of evolution could be useful, as long as fitness improved. A different use of a meta-GA is to use it for dynamic fitness landscapes; ie. problems that change over time. In [26] Stanhope and Daida used a similar meta-GA as Grefenstette for determining the mutation and crossover rates for a dynamic fitness function. When the required mutation and crossover rates were found the fitness remained constant. They do note that it would have been possible to use selfadaptation (as discussed above) instead, but they regarded self-adaptation as not fitting for their particular experiment, as they were trying to achieve a baseline and insights for future research. There has been healthy criticism regarding the use of metaalgorithms for finding parameters. For instance, in [1]: Meta-algorithms for evolutionary algorithms have been proposed by many authors. But this approach does not solve the original problem completely, because it requires the determination of a parameter setting of the meta-algorithm. Additionally, we argue that the experimenter’s skill plays an important role in this analysis. It cannot be replaced by automatic rules. The first argument can be refuted in a number of ways. First, the parameters used for the meta-algorithm can already be determined to function perfectly well; the parameters that are to be calibrated can be of a completely different order. Second, there is nothing that stands in the way of a metaalgorithm calibrating itself. This has been our approach in [18]. The second argument is a more vague one. The background of the argument lies in the opinion that insight into the behavior of an algorithm is more important than finding only (near-)optimal parameters. We would like to note that the approach taken in [1] is a valuable one and its methodology based on DOE is a very useful tool. However, even though less insight might be obtained through metaalgorithms, this does not mean that meta-algorithms would provide lesser results. The benefit of automatic parameter calibration is of a very different nature, namely to save the researcher from performing tedious manual testing. In many occasions the researcher is perfectly content with having
parameters that provide near-optimal results. The “Grefenstette” meta-GA The classic meta genetic algorithm works by optimizing parameter-values. Like a normal genetic algorithm, these values are encoded using a binary representation. We will use Gray encoding for this in our experiments in order to minimize the distance between mutations. For every set of parameter-values the meta genetic algorithm sees a single individual. In order to evaluate the fitness of this individual the lower-level genetic algorithm is executed with the set parameter-values that belong to the individual. The value the lower-level algorithm returns (most often the highest fitness reached) is the fitness with which the meta genetic algorithm will determine if the individual will be selected for the next generation and/or the possibilities of the individual to reproduce. When being selected for the following generation, there is a chance that the individual will undergo either mutation or crossover. These two operators respectively either flip a bit in the binary representation of a parameter value or combines the bit-string with that of a different individual in order to produce two new child-individuals with each containing half of the values of their parents. III. R ELEVANCE E STIMATION AND VALUE C ALIBRATION (REVAC) The REVAC method calibrates the parameters of an evolutionary algorithm. That is, the REVAC method is to establish good values that will be used without changing them during a run of the EA. The REVAC method is based on information theory to measure parameter relevance. Instead of estimating the performance of an EA for different parameter values or ranges of values the method estimates the expected performance when parameter values are chosen from a probability density distribution C with maximized Shannon entropy. This maximized Shannon entropy is a measure of parameter relevance. In information theoretical terms we measure how much information is needed to reach a certain level of performance, and how this information is distributed over the different parameters. In these terms the objectives of the REVAC method can be formulated as follows: • the entropy of the distribution C is as high as possible for a given performance • the expected performance of the EA in question is as high as possible Technically, the REVAC method is an Estimation of Distribution Algorithm (EDA) [19] that is specifically designed to measure maximized entropy in the continuous domain. Given an EA with k (strategy) parameters the REVAC method iteratively refines a joint distribution C(~x) over possible parameter vectors ~x = {x1 , . . . , xk }. Beginning with a uniform distribution C 0 over the initial parameter space X , the REVAC method gives a higher and higher probability to regions of X that increase the expected performance of
the associated EA. This is to increases the EA performance. On the other hand, the REVAC method maximizes entropy by smoothing the distribution C. For a good understanding of how REVAC works it is helpful to distinguish two views on a set of parameter vectors as shown in Table I. Taking a horizontal view on the table, a row is a parameter vector and we can see the table as m of such vectors X = {x~1 , . . . , x~m }. Taking the vertical view on the columns, column i shows m values for parameter i from its domain. These values naturally define1 a marginal density function D(x) over the domain of parameter i, hence we can see the k columns of the table as k marginal density functions X = {D(x1 ), . . . , D(xk )}. x~1 . .. x~j .. . x~m
D(x1 ) {x11
D(xi ) xi1
··· ···
D(xk ) xk1 }
{x1j
··· ··· .. . ···
xij
xkj }
{x1m
···
xim
··· .. . ···
xkm }
TABLE I A
TABLE
X
OF
m VECTORS OF k
PARAMETERS
Roughly speaking, REVAC works by iteratively improving an initial table X0 that was drawn from the uniform distribution over X . Creating a new table Xt+1 from a given Xt can be described from both the horizontal and the vertical perspective. From the horizontal perspective we can identify two basic steps: 1) Evaluating parameter vectors: Given a parameter vector ~x we can evaluate it: the utility of ~x is the performance of the EA executed with these parameter values. 2) Generating parameter vectors: Given a set of parameter vectors with known utility we can generate new ones that have higher expected utility. Step 1 is straightforward, let us only note that we call the performance that an EA achieves on a problem using parameters ~x the response. Response r is thus a function r = f (~x); the surface of this function is called a response surface. As for step 2, we use a method that is evolutionary itself, (but should not be confused with the EA we are calibrating). We work with a population of m parameter vectors. A new population is created by selecting n < m parent vectors from the current population, recombining and mutating the selected parents to obtain a child vector, replacing one vector of the population. 1 Scaled to the unit interval [0, 1] we define the density over the m+1 intervals between any two neighbors (including limits) xa , xb as D(x) = R (m+1) with 01 D(x) = 1 and differential entropy |x −x | a
b
H(D) = −
Z
1
We use a deterministic choice for parent selection as well as for survivor selection. The best n vectors of the population are selected to become the parents of the new child vector, which always replaces the oldest vector in the population. Only one vector is replaced in every generation. Recombination is performed by a multi-parent crossover operator, uniform scanning, that creates one child from n parents, cf. [9]. The mutation operator—applied to the offspring created by recombination—is rather complicated, it works independently on each parameter i in two steps. First, a mutation interval is calculated, then a random value is chosen from this interval. To define the mutation interval for mutating a given xij all other values xi1 , . . . , xin for this parameter in the selected parents are also taken into account. After sorting them in increasing order, the begin point of the interval can be specified as the h-th lower neighbor of xij , while the end point of the interval is the h-th upper neighbor of xij . The new value is drawn from this interval with a uniform distribution. From the vertical perspective we consider each iteration as constructing k new marginal density functions from the old set Xt = {Dt (x1 ), . . . , Dt (xk )}. Roughly speaking, new distributions are built on estimates of the response surface that were sampled with previous density functions, each iteration giving a higher probability to regions of the response surface with higher response levels. Each density functions is constructed from n uniform distributions over overlapping intervals. In this context, the rationale behind the complicated mutation operator is that it heavily smoothes the density functions. Like all evolutionary algorithms, REVAC is susceptible for converging on a local maximum. By consistently smoothing the distribution functions we force it to converge on a maximum that lies on a broad hill, yielding robust solutions with broad confidence intervals. But smoothing does more: it allows REVAC to operate under very noise conditions, it allows REVAC to readjust and relax marginal distributions when parameters are interactive and the response surface has curved ridges, and it maximizes the entropy of the constructed distribution. Smoothing is achieved by taking not the nearest neighbor but the hth neighbors of xij when defining the mutation interval2 . Choosing a good value for h is an important aspect when using the REVAC method. A large h value can slow down convergence to the point of stagnation. A small h value can produce unreliable results. We prefer h = n/10. Because the REVAC method is implemented as a sequence of distributions with slowly decreasing Shannon entropy, we can use the Shannon entropy of these distributions to estimate the minimum amount of information needed to reach a target performance level. We can also measure how this information is distributed over the parameters, resulting in a straightforward measure for parameter relevance. This measure can be used in several ways. First, it can be used
D(x) log D(x)
0
with H(D) = 0 for the uniform distribution over [0, 1]. The sharper the peaks, the lower the entropy.
2 At the edges of the parameter ranges are no neighbors. We solve this problem by mirroring neighbors and chosen values at the limits, similar to what is done in Fourier transformations.
to choose between different operators [17]. An operator that needs little information to be tuned is more fault tolerant in the implementation, easier to calibrate and robuster against changes to the problem definition. Second, it can be used to identify the critical parts of an EA. For this we measure relevance as the absolute difference between the entropy of a distribution and the entropy of the uniform distribution over the same interval, calculating the absolute amount information needed to calibrate the particular parameter. When an EA needs to be adapted from one problem to another, relevant parameters need the most attention. With this knowledge, the practitioner can concentrate on the critical components straight away. Third, it can be used to define confidence intervals for parameter choices. Given a distribution that peaks out in a region of high probability (except for the early stage of the algorithms the marginal distributions have only one peak), we give the 25th and the 75th percentile of the distribution as a confidence interval for the parameter. That is, every value from this range leads to a high expected performance, under the condition that the other parameters are also chosen from their respective confidence interval. In [17] a similar approach to a meta-GA is used in calibrating the parameters for energy-policy multi-agent simulations. In [18] this approach to calibrate the parameters is further developed and tested on a number of abstract and real benchmark problems. The method for relevance estimation and value calibration uses search methods based on information theory for optimization. By estimating the model complexity using the Shannon entropy from the distribution of the results, the less-relevant parameters of the model are discarded. For the remaining parameters a search algorithm similar to a metaGA is used for calibrating the parameters (where a model is a list of parameters for the simulation). A. Estimation of Distribution Algorithms The REVAC method is a type of Estimation of Distribution Algorithm (or EDA). EDAs are a relatively new search algorithms that maintain a population of possible solutions and as such are similar to evolutionary algorithms, however the population is used to “estimate a probability distribution over the search space that reflects what are considered to be important characteristics of the population” [27]. A new population is generated by sampling this distribution, which replaces traditional crossover and mutation in genetic algorithms. EDAs can be seen in the light of the principle of maximum entropy. Without losing what is known, the algorithm by this principle should maximize the information entropy. The population of an EDA is adjusted in order to learn as much as possible about the fitness landscape. In [23] one of the main problems with EDAs is investigated, namely the lack of diversity over time. Like a conventional evolutionary algorithm without mutation, EDAs are prone to stagnation; they will then not be able to find any better solution, even if it exists. The amount of diversity
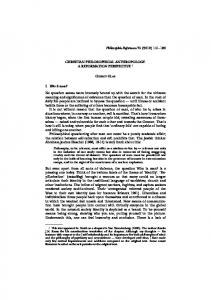
within the population appears to be a major problem for EDAs. B. Workings of REVAC EDAs work through the use of probability functions, and in such are grounded on existing information theory for optimization. By estimating the model complexity using the Shannon entropy from the distribution of the results, REVAC finds and discards the less-relevant parameters of the model. For the remaining parameters an EDA search algorithm was used for calibrating the parameters (where a model is a list of parameters for the simulation). The main difference between the Relevance Estimation and Value Calibration method used in [17] and a traditional genetic algorithm is thus the lack of separate crossover and mutation (in [17] termed as imitation and innovation). Instead of these two operators, the new parameters are selected by first selecting an individual randomly from the population. From this individual the two closest neighbors are determined. The new parameter-value becomes a value between the parameter of both of these neighbors. This is done for every parameter, thus the end result is that REVAC combines x parents and mutates the result. As such, this operator is similar in nature to a combination of multi-parent crossover and mutation; each offspring has a different parent for each parameter. The REVAC method solely uses this instead of the traditional crossover and mutation operators in genetic algorithms, however the question remains if such an approach for parameter calibration is more successful than a meta-GA (or other methods) in finding effective parameters for a GA. The REVAC method only has a few parameters with which it can be tuned, namely: the size of the initial population, the number of entities to replace at each round and the amount of smoothing. The smoothing parameter is the distance of the two neighbors. A smoothing of 1 means that the two nearest neighbors on both side are chosen, while a smoothing of 4 means that two neighbors are chosen that have 3 intermediary entities. IV. E XPERIMENTAL S ETUP To describe the experimental setup it is helpful to distinguish three different layers, as shown in Figure 1. The problem layer contains the particular fitness landscapes or problem instances that have to be solved by a GA. The elementary objects in this layer are bit-strings that form the search space for the GA. In turn, the algorithm layer also contains a search space. Assigning values to all GA parameters we obtain a parameter vector that specifies a given GA instance. The set of all parameter vectors is the search space for the methods on the design layer.3 The basic approach to our experimental validation is to monitor three GA performance measures for each run of a given GA on all problem instances and use these results to 3 Obviously, the methods on the design layer also have parameters, but we do not iterate this hierarchy any further.
Fig. 1.
TABLE III ATTRIBUTES OF S IMPLE GA
Hierarchy of Experiments
Design Layer Meta Genetic Algorithm
REVAC
Algorithm Layer
Population model Crossover Mutation Parent selection Survival selection Termination
Steady-state Uniform Bit-flip Tournament selection Delete-worst Fitness of 1.0 or 10000 evaluations
Genetic Algorithm
TABLE IV PARAMETERS OF S IMPLE GA TO BE CALIBRATED Problem Layer Multimodal Landscapes
Parameter Crossover rate Mutation rate Population size Tournament size
Benchmark value 0.5 0.01 100 2
assess the quality of the method that delivered the parameter vector for the given GA. GA performance is measured by the mean best fitness (MBF), being the fitness of the best individual at termination, averaged over a given number of runs.
and tournament size we assume a range of 2 to 1025 and a 10-bit granularity. When the tournament size is larger than the population size, the algorithm is defined as having a tournament size that is equal to the population size.
A. Problem Layer
C. Design Layer
We have created instances with the Spears multi-modal problem generator [14], [24] as the problem instances to be solved. Although we share some of the criticism concerning this generator, cf. [16], we have chosen to use it because it allows for a systematic study on a number of landscapes with various levels of multi-modality. Furthermore, we have experimental data available on the performance of a simple GA on such landscapes, where parameter values have been established through traditional tuning [8]. This makes these results suitable as benchmark in our comparative assessment of REVAC. For the details of the problem instance generator we refer to [25]. Our specific set of landscapes is generated for n = 100 bits, and 10 different number of peaks as shown in Table II. All landscapes are to be maximized, and the height of the global maximum is 1.0.
For our design layer we use the two meta-algorithms described earlier: the meta genetic algorithm and REVAC. The attributes and parameters of the meta genetic algorithm [12] can be found in Table V, the details for REVAC [17], [18] are shown in Table VI. TABLE V PARAMETERS OF
THE META GENETIC ALGORITHM
Fitness measure Population model Crossover Crossover rate Mutation Mutation rate Population size Parent selection Survival selection Termination
MBF of SGA Generational One-point 0.5 Bit-flip 0.001 100 Fitness-proportional Generational 3000 evaluations
TABLE II PARAMETERS USED FOR GENERATING THE PROBLEM INSTANCES
TABLE VI PARAMETERS OF THE REVAC ALGORITHM
Number of bits Number of peaks
100 1, 2, 5, 10, 25, 50, 100, 250, 500, 1000
B. Algorithm Layer We deliberately selected an algorithm used in earlier publications in order to make the results comparable. In particular, we use a Simple Genetic Algorithm as a benchmark after [8]. The attributes of the genetic algorithm are shown in Table III, the parameters to be calibrated, together with their benchmark values can be found in Table IV. There are to more important factors to complete the definition of the calibration problem: the range of the parameters and the granularity of their range we use in the search space. For both the crossover and mutation rate we assume a range of 0.0 to 1.0 and a 16-bit granularity. For the population
Fitness measure Pool size Best size Smoothing Termination
MBF of SGA 100 50 5 3000 evaluations
Let us note that the 3000 evaluations for the metaalgorithms, the meta-GA and REVAC, mean 3000 runs of the Simple GA (on one given problem instance). After these runs, the meta-algorithms put forward the best parameter vector found for that particular problem instance. V. E XPERIMENTAL R ESULTS The experiments have been performed on 4 4-CPU AMD Opteron machines over the course of two weeks. Calibrationruns on landscapes with a low number of peaks were
TABLE IX GA RESULTS (MBF) USING DIFFERENT TUNING METHODS
typically completed within a few hours. After the metaalgorithm had calibrated the parameters, the best parameters from the last meta-generation were obtained. In the case of a tie, the parameter-vector that occurred the most was selected. This was done for every problem instance for both metaalgorithms. First we show the parameter values “optimized” by the meta-algorithms. Those obtained by the meta-GA can be found in Table VII, the ones found by REVAC are given in Table VIII.
Peaks 1 2 5 10 25 50 100 250 500 1000
hand-tuned 1.0 1.0 1.0 0.9961 0.9885 0.9876 0.9853 0.9847 0.9865 0.9891
meta-GA 1.0 1.0 0.988 0.993 0.994 0.994 0.983 0.992 0.989 0.987
REVAC 1.0 1.0 1.0 0.996 0.991 0.995 0.989 0.966 0.970 0.985
TABLE VII S IMPLE GA PARAMETERS AFTER META -GA CALIBRATION
1 2 5 10 25 50 100 250 500 1000
Cr. Rate 0.226 0.175 0.241 0.160 0.104 0.310 0.149 0.536 0.489 0.749
Mut. Rate 0.0114 0.0151 0.0496 0.0325 0.00107 0.00371 0.0223 0.000549 0.00485 0.0279
Pop. Size 830 333 82 121 871 685 255 620 402 480
Tour. Size 355 333 82 121 706 162 255 578 402 480
TABLE VIII S IMPLE GA PARAMETERS AFTER REVAC CALIBRATION
1 2 5 10 25 50 100 250 500 1000
Cr. Rate 0.349 0.304 0.224 0.495 0.294 0.554 0.419 0.517 0.457 0.533
Mut. Rate 0.000840 0.00114 0.000372 0.00515 0.00796 0.00347 0.00221 0.00739 0.00949 0.00498
Pop. Size 147 788 101 83 758 514 723 634 578 679
Tour. Size 147 788 101 83 380 100 723 634 578 679
Comparing these values with the values “optimized” by hand, cf. Table IV, it is remarkable that population sizes and the tournament sizes recommended by the meta-algorithms are consistently and significantly larger that the (rather conventional) 100 used in the benchmark GA. It is also noteworthy that both meta-algorithms recommend extreme high levels of selection pressure (tournament sizes equalling population sizes). It is quite obvious that human designers would not likely come up with such a GA. This shows one advantage of the meta-algorithms: they are insensitive to common wisdom and conventions among EC practitioners. To establish whether these unconventional settings are good or not each of these parameter-vectors have been tested by 25 independent runs of the GA using the given values. The benchmark results, as found in [8], together with those for the meta-algorithms are shown in Table IX. From these results we calculated the statistical significance using ANOVA, however the results from these runs weren’t provably significant.
To get a better picture we also make a comparison based on robustness. This is based on the mean error on a given landscape, which is defined as 1.0 minus the MBF. To measure robustness we cross-test the parameter vectors, by running the GA on landscape X with parameters found for landscape Y. The mean error in permille of these results are shown in Table X and Table XI. Besides the per-landscape optimized parameters, we also take the averages of the parameters from Table VII and Table VIII. These were then used to obtain the mean error against all landscapes, comparable with the method above. The results for the averaged parameters of meta-GA were poor. However the results for averaged parameters of REVAC show a more interesting picture, as can be seen in Table XII. The average mean error of the hand-tuned parameters and the parameters calibrated by meta-GA are comparable (85.0 and 88.9 respectively), yet the average mean error of the parameters calibrated by REVAC and the average of those parameters score slightly better (73.3 and 63.0). Even so, these results were also inconclusive in their statistical significance. However, both Table X and Table XI contain results from various well-performing parameter vectors (1 and 50, 1 and 25 respectively) that do show a significantly lower error compared to the hand-tuned results. TABLE X M EAN ERROR WHEN USING THE META -GA CALIBRATED PARAMETERS . T HE ROW SHOWS THE LANDSCAPE FOR WHICH THE PARAMETERS WERE “ OPTIMIZED ”, THE COLUMN SHOWS THE LANDSCAPE ON WHICH THE PARAMETERS ARE CROSS - TESTED .
1 2 5 10 25 50 100 250 500 1000 P
1 0 0 23 0 0 0 0 0 0 0
2 0 0 20 0 0 0 0 0 0 0
5 0 0 0 0 0 0 0 0 0 0
10 0 0 34 0 0 0 0 0 0 18
25 6 0 13 30 6 0 0 13 13 0
50 0 20 13 20 17 0 3 3 13 20
100 1 23 41 25 11 6 15 5 8 15
250 14 19 42 8 14 15 26 30 10 5
500 14 9 37 12 6 3 8 14 7 8
1000 12 2 42 5 13 18 3 30 10 18
VI. C ONCLUSIONS AND FURTHER WORK Comparative experiments on a set of randomly generated problem instances with various levels of multi-modality show
P
47 73 265 100 67 42 55 95 61 84 889
TABLE XI M EAN ERROR WHEN USING THE REVAC CALIBRATED PARAMETERS . T HE ROW SHOWS THE LANDSCAPE FOR WHICH THE PARAMETERS WERE “ OPTIMIZED ”, THE COLUMN SHOWS THE LANDSCAPE ON WHICH THE PARAMETERS ARE CROSS - TESTED . 1 0 0 0 0 0 0 0 0 0 0
1 2 5 10 25 50 100 250 500 1000 P
2 0 0 0 0 0 0 0 0 0 0
5 0 0 0 0 0 0 0 0 0 0
10 0 0 0 0 0 0 0 0 13 0
25 10 15 26 0 10 0 5 10 5 0
50 10 17 17 5 2 25 7 15 25 12
100 2 15 10 26 6 10 20 25 20 6
250 10 12 12 11 6 9 14 13 8 4
500 6 3 29 7 12 7 20 10 1 25
1000 9 11 29 5 4 5 8 12 32 30
P
47 73 123 54 40 56 74 85 104 77 733
TABLE XII M EAN ERROR WHEN USING THE AVERAGED REVAC CALIBRATED PARAMETERS . 1 0
2 0
5 0
10 0
25 4
50 14
100 8
250 24
500 6
1000 7
P 63
that GAs calibrated with REVAC and meta-GA perform comparable or better, compared to those calibrated by hand. The differences, analyzed using ANOVA, are found to be on average not significant enough, however certain parameter vectors do show a statistically significant improvement. REVAC found on average slightly better parameter vectors than the meta-GA. The robustness-analysis of REVAC, obtained by using calibrated parameter vectors on other problem landscapes, show that REVAC on average finds slightly better parameters compared to the meta-GA. It also shows that automatically calibrating algorithms, even those with hand-tuned parameters known for years, can provide both new insights and more optimal settings. In further work we will look at using other problem landscapes and algorithms upon which we apply parameter calibration, optimizing the optimizers. R EFERENCES [1] T. Bartz-Beielstein. Experimental Research in Evolutionary Computation – The New Experimentalism. Natural Computing Series. Springer, Berlin, 2006. [2] J. Clune, S. Goings, B. Punch, and E. Goodman. Investigations in meta-gas: panaceas or pipe dreams? In F. Rothlauf, editor, GECCO 2005: Proceedings of the 2005 workshops on Genetic and evolutionary computation, pages 235–241, New York, NY, USA, 2005. ACM Press. [3] P. Cortez, M. Rocha, and J. Neves. A meta-genetic algorithm for time series forecasting. In L. Torgo, editor, Proceedings of Workshop on Artificial Intelligence Techniques for Financial Time Series Analysis (AIFTSA-01), 10th Portuguese Conference on Artificial Intelligence (EPIA’01), pages 21–31, Oporto, Portugal, Dec. 2001. [4] A. Czarn, C. MacNish, K. Vijayan, B. Turlach, and R. Gupta. Statistical Exploratory Analysis of Genetic Algorithms. 8(4):405–421, 2004. [5] A. Eiben, , and M. Jelasity. A critical note on experimental research methodology in ec. In Proceedings of the 2002 Congress on Evolutionary Computation (CEC 2002), pages 582–587. IEEE Press, 2002.
[6] A. Eiben and M. Schut. Advances in Metaheuristics for Hard Optimization, chapter 8, New Ways to Calibrate Evolutionary Algorithms. Springer, Berlin, 2007. [7] A. E. Eiben, R. Hinterding, and Z. Michalewicz. Parameter control in evolutionary algorithms. IEEE Transactions on Evolutionary Computation, 3(2):124–141, 1999. [8] A. E. Eiben, M. C. Schut, and A. R. de Wilde. Is self-adaptation of selection pressure and population size possible? - a case study. In T. P. Runarsson, H.-G. Beyer, E. K. Burke, J. J. M. Guerv´os, L. D. Whitley, and X. Yao, editors, PPSN, volume 4193 of Lecture Notes in Computer Science, pages 900–909. Springer, 2006. [9] A. E. Eiben and J. E. Smith. Introduction to Evolutionary Computing. Springer, 2003. [10] O. Franc¸ois and C. Lavergne. Design of Evolutionary Algorithms—A Statistical Perspective. 5(2):129–148, 2001. [11] B. Freisleben. Advanced Techniques in Evolutionary Computation; Metaevolutionary approaches, chapter 7.2, pages 212–223. Oxford University Press, 1997. [12] J. Grefenstette. Optimization of control parameters for genetic algorithms. IEEE Trans. Syst. Man Cybern., 16(1):122–128, 1986. [13] K. A. D. Jong. An analysis of the behavior of a class of genetic adaptive systems. PhD thesis, University Michigan, 1975. [14] K. A. D. Jong, M. A. Potter, and W. M. Spears. Using problem generators to explore the effects of epistasis. In T. B¨ack, editor, Proceedings of The Seventh International Conference on Genetic Algorithms. Morgan Kaufmann, 1997. [15] M. Lee and H. Takagi. Integrating design stage of fuzzy systems using genetic algorithms. In IEEE, editor, Second IEEE International Conference on Fuzzy Systems, volume 1, pages 612–617. IEEE Computer Society Press, 1993. [16] F. G. Lobo and C. F. Lima. On the utility of the multimodal problem generator for assessing the performance of evolutionary algorithms. In GECCO ’06: Proceedings of the 8th annual conference on Genetic and evolutionary computation, pages 1233–1240, New York, NY, USA, 2006. ACM Press. [17] V. Nannen and A. E. Eiben. A Method for Parameter Calibration and Relevance Estimation in Evolutionary Algorithms. In M. Keijzer et al., editors, GECCO 2006: Genetic and Evolutionary Computation Conference, pages 183–190, New York, 2006. ACM. [18] V. Nannen and A. E. Eiben. Relevance Estimation and Value Calibration of Evolutionary Algorithm Parameters. In International Joint Conference on Artificial Intelligence (IJCAI), pages 975–980, Jan. 2007. [19] M. Pelikan, D. E. Goldberg, and F. G. Lobo. A survey of optimization by building and using probabilistic models. Computational Optimization and Applications, 21(1):5–20, 2002. [20] M. E. Samples, J. M. Daida, M. Byom, and M. Pizzimenti. Parameter sweeps for exploring GP parameters. In H.-G. Beyer et al., editors, GECCO 2005: Proceedings of the 2005 conference on Genetic and evolutionary computation, volume 2, pages 1791–1792, Washington DC, USA, 25-29 June 2005. ACM Press. [21] A. V. Samsonovich and K. A. D. Jong. Pricing the ’free lunch’ of meta-evolution. In H.-G. Beyer and U.-M. O’Reilly, editors, GECCO 2005: Proceedings of the 2005 conference on Genetic and evolutionary computation, pages 1355–1362, New York, NY, USA, 2005. ACM Press. [22] K. Shahookar and P. Mazumder. VLSI cell placement techniques. ACM Comput. Surv., 23(2):143–220, 1991. [23] J. L. Shapiro. Diversity loss in general estimation of distribution algorithms. In T. P. Runarsson, H.-G. Beyer, E. K. Burke, J. J. M. Guerv´os, L. D. Whitley, and X. Yao, editors, Parallel Problem Solving from Nature - PPSN IX, 9th International Conference, number 4193 in LNCS, pages 92–101. Springer, 2006. [24] W. M. Spears. Evolutionary Algorithms; The role of mutation and recombination. Springer Berlin Heidelberg, 2000. [25] W. M. Spears. The Role of Mutation and Recombination. 2000. [26] S. A. Stanhope and J. M. Daida. Optimal mutation and crossover rates for a genetic algorithm operating in a dynamic environment. In V. Porto, N. Saravanan, D. Waagen, and A. Eiben, editors, Evolutionary Programming VII, number 1447 in LNCS, pages 693–702. Springer, 1998. [27] A. Wright, R. Poli, C. Stephens, W. Langdom, and S. Pulavarty. An estimation of distribution algorithm based on maximum entropy. In K. Deb et al., editors, GECCO 2004: Genetic and Evolutionary Computation Conference, pages 343–354. Springer, 2004.