CLINICAL EEG and NEUROSCIENCE
©2005 VOL. 36 NO. 1
Parametric vs. Non-Parametric Statistics of Low Resolution Electromagnetic Tomography (LORETA) R. W. Thatcher, D. North and C. Biver
positives of the 2,394 gray matter pixels for any cross-validated normal subject. In conclusion, adequate approximation to Gaussian and high cross-validation can be achieved by the Key Institute’s LORETA programs by using a log10 transform and parametric statistics, and parametric normative comparisons had lower false positive rates than the non-parametric tests.
Key Words EEG Inverse Solutions LORETA Parametric Statistics Non-parametric Statistics ABSTRACT This study compared the relative statistical sensitivity of non-parametric and parametric statistics of 3-dimensional current sources as estimated by the EEG inverse solution Low Resolution Electromagnetic Tomography (LORETA). One would expect approximately 5% false positives (classification of a normal as abnormal) at the P < .025 level of probability (two tailed test) and approximately 1% false positives at the P < .005 level. EEG digital samples (2 second intervals sampled 128 Hz, 1 to 2 minutes eyes closed) from 43 normal adult subjects were imported into the Key Institute’s LORETA program and then used the Key Institute’s cross-spectrum and the Key Institute’s LORETA output files (*.lor) as the 2,394 gray matter pixel representation of 3-dimensional currents at different frequencies. The mean and standard deviation *.lor files were computed for each of the 2,394 gray matter pixels for each of the 43 subjects. Tests of Gaussianity and different transforms were computed in order to best approximate a normal distribution for each frequency and gray matter pixel. The relative sensitivity of parametric vs. non-parametric statistics were compared using a “leave-one-out” cross validation method in which individual normal subjects were withdrawn and then statistically classified as being either normal or abnormal based on the remaining subjects. Log10 transforms approximated Gaussian in the range of 95% to 99% accuracy. Parametric Z score tests at P < .05 cross-validation demonstrated an average misclassification rate of approximately 4.25%, and range over the 2,394 gray matter pixels was 27.66% to 0.11%. At P < .01 parametric Z score cross-validation false positives were 0.26% and ranged from 6.65% to 0% false positives. The non-parametric Key Institute’s t-max statistic at P < .05 had an average misclassification error rate of 7.64% and ranged from 43.37% to 0.04% false positives. The nonparametric t-max at P < .01 had an average misclassification rate of 6.67% and ranged from 41.34% to 0% false
INTRODUCTION Both non-parametric1,2 and parametric3-10 statistics have been used in studies of Low Resolution Electromagnetic Tomography or LORETA,11,12 however, the relative sensitivity of parametric vs. non-parametric statistics has not been systematically evaluated. Non-parametric statistics have the advantage of being distribution independent as well as insensitive to extreme values or outliers. The disadvantage of non-parametric statistics is the complexity, lower power and time required for computation. In contrast, parametric statistics are simple and easy to compute but rely upon the assumption of a “Gaussian” distribution. Parametric statistics are known to be generally robust even when the assumption of Gaussian distribution is violated,13-16 nonetheless, an objective evaluation of the assumption of Gaussian distribution of LORETA current sources is helpful when deciding what statistic to use. The purpose of the present study is: (1) to determine the extent to which LORETA 3-dimensional current sources are Gaussian distributed with and without transforms, and (2) to compare and contrast parametric vs. non-parametric statistics of LORETA 3-dimensional current sources using a leave-one-out cross validation procedure. METHODS Subjects A total of 43 normal adults ranging in age from 16 to 25 years (male = 40) were included in this study. The subjects
From the NeuroImaging Laboratory, Bay Pines VA Medical Center, St. Petersburg, Florida, and the Department of Neurology, University of South Florida College of Medicine, Tampa, Florida (R. W. Thatcher). Address requests for reprints to Robert W. Thatcher, PhD, NeuroImaging Laboratory, Research and Development Service-151, Veterans Administration Medical Center, Bay Pines, Florida 33744, USA. Email:
[email protected]
1
CLINICAL EEG and NEUROSCIENCE
©2005 VOL. 36 NO. 1
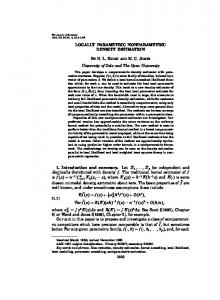
Figure 1. A diagram of the experimental design. Digital EEG samples were analyzed by the Key Institute LORETA software, and mean and standard deviations of the current sources for each of the 2,394 gray matter pixels were computed for purposes of parametric statistical analyses. Non-parametric tests utilized the same individual data files but used the t-max statistic. Leave-one-out cross validation was used to compare the statistical sensitivity of parametric vs. non-parametric statistics on the same set of test subjects.
Export of EEG Time Series to the Key Institute LORETA Programs Figure 1 is a diagram of the experimental design. The edited EEG was organized into a format compatible with the Key Institute software,17 which is 256 blocks of ASCII data (2 seconds x 128 samples/sec) in which the 19 channels were columns and the 256 time points were rows. In order to minimize windowing effects, 75% overlapping 256 point segments were produced according to the procedure described by Kaiser and Sterman.18 This series of overlapping 256 time points of digitized EEG were then exported to the Key Institute “EEG Cross Spectral Maker” using the “All EEGs Spec[Aut]” option to spectrally analyze the digital EEG samples using the Key Institute cross-spectral FFT. The frequency bands were the standard seven LORETA Key Institute settings: delta = 1-3 Hz; theta = 4-7 Hz; alpha = 8-12 Hz; beta-1 = 13-18 Hz; beta-2 = 19-21 Hz; beta-3 = 22-30 Hz; omega = 1-30Hz. This procedure produced a cross-spectral matrix with the seven different frequency bands for each of the 2,394 gray matter pixels. The LORETA current source values are defined as the square root of the sum of squares of the x, y, z cross-spectral values for each of the 2,394 gray matter pixels. Parametric Statistical Analyses 1- Means and standard deviations were computed across the 43 subjects for each of the 2,394 variables. Estimates of Gaussianity were computed for each variable using measures of skewness, kurtosis and normal probability plots and Z scores. A log10 transform was applied to each of the 2,394 current source values, and then the skewness
were students and professionals without a history of neurological disorders such as no epilepsy, no head injuries, normal development and successful school performance. The EEG was also recorded from a patient with a CT scan confirmed hematoma of the right hemisphere, for comparative purposes. The same recording conditions and analyses were performed for the normal control subjects. The purpose of the single patient recording was to validate the specificity of LORETA using a clinical case, as well as to examine the statistical stability of parametric statistics. EEG Recording The EEG was recorded from 19 scalp locations based on the International 10/20 System of Electrode Placement, using linked ears as a reference. Bipolar eye movement electrodes were applied to the canthus and cheek bone to monitor eye movement artifact. Each EEG record was plotted and visually examined and then edited to remove artifact using the Neuroguide software program (NeuroGuide, 1.7.3). The amplifier bandwidths were nominally 0.5 to 30 Hz, the outputs being 3 db down at these frequencies, and the EEG was digitized at 128 Hz. Split-half reliability tests were conducted on the edited EEG segments, and only records with > 95% reliability were entered into the spectral analyses. The EEG was acquired in the eyes-closed condition, and recording lengths varied from 58.6 seconds to 120 seconds. An average reference time series was computed for each EEG record. The average reference involved summing the voltages across all 19 leads for each time point and dividing this value into the microvolt digital value from each lead at each time point. 2
CLINICAL EEG and NEUROSCIENCE
©2005 VOL. 36 NO. 1
Figure 2. An example of a normal or Gaussian curve showing values of Z (±1.96), that includes the proportion which is .95 of the total area. The left and right tails of the distribution show probability values of .025 (one-tailed). The classification accuracy of any sample of subjects is based on the assumption of a normal distribution. The probability of finding an observed EEG value in a given range of any population can be determined, and then the sensitivity of the sample can be tested by cross-validation (adapted from Thatcher et al.16
2.3% at –2 SD, 0.13% at +3 SD and 0.13% at –3 SD. The computation of sensitivity based on deviation from an expected Gaussian distribution was used to cross-validate the LORETA current source values as illustrated in Figure 2. True positives equal the percentage of Z scores that lay within the tails of the Gaussian distribution. False negatives (FN) equal the percentage of Z scores that fall outside of the tails of the Gaussian distribution. The error rates or the statistical sensitivity are directly related to the deviation from a Gaussian distribution. The sensitivity was also computed based on the percentage of the 2,394 current sources at P < .05 and at P 1 SD 16.84% 15.77% 15.55% 16.24% 14.50% 14.90% 15.48%
2 SD 1.59% 1.70% 1.40% 2.50% 4.57% 4.89% 0.83%
< -3 SD 0.03% 0.12% 0.80% 0.03% 0.00% 0.00% 0.34%
> 3 SD 0.00% 0.08% 0.00% 0.14% 0.16% 0.15% 0.00%
Sen 2 SD 95.63% 95.64% 95.64% 95.63% 95.65% 95.65% 95.64%
Sen 3 SD 99.74% 99.74% 99.75% 99.74% 99.74% 99.74% 99.74%
AVE Delta Theta Alpha Beta1 Beta2 Beta3 Omega
-0.09 -0.26 -0.62 -0.07 0.25 0.54 -0.64
-0.46 0.19 1.34 -0.06 0.32 0.23 0.65
18.56% 15.86% 12.31% 15.25% 13.94% 15.76% 14.98%
16.19% 14.92% 14.78% 16.10% 14.36% 15.12% 14.24%
1.77% 3.21% 3.74% 2.38% 1.74% 0.50% 4.37%
1.26% 1.58% 1.12% 1.71% 3.65% 4.37% 0.60%
0.06% 0.16% 1.09% 0.10% 0.00% 0.00% 0.56%
0.00% 0.01% 0.00% 0.00% 0.10% 0.09% 0.00%
95.63% 95.64% 95.64% 95.64% 95.65% 95.64% 95.65%
99.74% 99.74% 99.75% 99.74% 99.74% 99.74% 99.75%
Figure 5. The comparative results of the cross-validation tests for the parametric Z scores vs. the non-parametric t-max statistic at P < .025 for the linked ears, eyes closed condition. The y-axis is the percentage of the 2,394 pixels with P values greater than 0.025, and the x-axis are the frequency bands (delta, theta, alpha, beta-1, beta-2, beta-3, omega and all frequencies). The white columns are non-parametric test results and the black columns are the Z parametric statistic results.
Figure 6. The comparative results of the cross-validation tests for the parametric Z scores vs. the non-parametric t-max statistic at P < .005 for the linked ears, eyes closed condition. The yaxis is the percentage of the 2,394 pixels with P values greater than 0.005, and the xaxis are the frequency bands (delta, theta, alpha, beta-1, beta-2, beta-3, omega and all frequencies). The white columns are non-parametric test results and the black columns are the Z parametric statistic results.
5
CLINICAL EEG and NEUROSCIENCE
©2005 VOL. 36 NO. 1
Figure 7. Surface rendering of the Z scores at 4 Hz using the Key Institute 3DSurf program.
Figure 8. Evaluation of the smoothness of the Z scores at 4 Hz for frequencies 1 to 10 Hz. The .lor current source values were ranked ordered for each single hertz frequency. The y-axis is Z scores and the x-axis is the number of gray matter pixels from 1 to 2,394.
average false positive rate for non-parametric is 0.25% at P < .005 and 4.24% at P < .025. This is in contrast to the parametric tests where the average false positive rate was 6.65% at P < .005 and 7.65% at P < .025. The change of parametric statistical false positives is close to what is expected assuming a Gaussian distribution, and the constant hit rate of non-parametric statistics reflects the distribution independence of this statistic. Smoothness at 1 Hz Resolution and Regions of Interest (ROI) Individual slices and single frequency analyses were computed for a single patient in order to study the normality and validity of smaller numbers of gray matter current source density values. The patient was injured in the right parietal lobe as confirmed by CT scan and other clin-
percentage of the 2,394 pixels with P values greater than 0.005 and on the x-axis are the frequency bands (delta, theta, alpha, beta-1, beta-2, beta-3, omega and all frequencies). The white columns are non-parametric test results and the black columns are the Z parametric statistic results. It can be seen that the non-parametric tests consistently produced a larger number of false positives than did the parametric tests. An exact comparison is an average of 7.65% for non-parametric vs. 4.24% for parametric. Figure 6 shows that the parametric analyses result in fewer current source values at P < .005 than does the nonparametric test. Also, the non-parametric statistics did not change much between P < .025 vs. P < .005 in comparison to the results of the parametric analyses. For example, the 6
CLINICAL EEG and NEUROSCIENCE
©2005 VOL. 36 NO. 1
relative accuracy, power and specificity of the statistics can be estimated. The non-parametric tests tended to show higher error rates than the parametric analyses. However, both statistical methods are valid and their application is a matter of preference. The advantage of the non-parametric is its insensitivity to extreme values.14 A safeguard against extreme values when using parametric tests is to evaluate the smoothness of the Z scores or parametric t-tests in order to identify and remove outliers or extreme values.
ical information. A smooth distribution of Z scores with maxima near to the location of the confirmed injury is expected if parametric statistics using LORETA are valid. The results of a parametric Z score analysis using LORETA in the CT scan revealed that the maximum Z scores were present in the same location that the CT scans showed maximum injury. Figure 7 is the surface rendering of the Z scores in the CT scan confirmed patient, which shows the region of interest of significant Z score current source values that register to the spatial location of the patient’s injury. Figure 8 is a graph of the rank order of Z scores for different 1 Hz frequency bands from 1 to 10 Hz for the 2,394 current source values. It can be seen that the rank ordering of the Z scores is smooth and well behaved at each 1 Hz frequency analysis with maximum Z score deviation at 2-6 Hz, which is the same frequency band in which the surface EEG was most deviant from normal. A smooth rank ordering of Z scores is expected if parametric statistical analysis is valid.
Smoothness of Regions of Interest (ROI) In this study the summation of current density values was over the entire 2,394 LORETA gray matter pixels, which provided a general statement about the relatively Gaussian distribution of current values. More limited and specific analyses showed that much smaller samples of LORETA current source density values at 1 Hz resolution also approximated a Gaussian distribution, thus supporting the more general statement about Gaussianity.21 The fact that the distribution of Z scores in a single patient were smooth and maximal in a location of confirmed pathology is evidence that the general Gaussian nature of LORETA current source density values also applies to regions of interest and smaller sample sizes.
DISCUSSION The results of this analysis support the general conclusion that parametric and non-parametric statistical tests are valid when applied to LORETA. The results of the parametric analyses are consistent with studies that have used parametric statistics to evaluate EEG inverse solutions in general17-20 and LORETA and VARETA in particular.3-6,9,10,21 The advantage of parametric statistics is its ease of use and flexibility. However, it is important to emphasize that an approximation to Gaussian requires the use of a transform such as a log10 transform, and that without a transform the statistical accuracy of parametric statistics may diminish. It is recommended that cross-validation procedures be used no matter what statistical method is employed so that the
CONCLUSIONS Both parametric and non-parametric statistics are valid and useful when analyzing LORETA current sources. The relative sensitivity and specificity of parametric vs. nonparametric statistics is likely to vary depending upon the experimental design. However, no matter which statistic is used some form of validation either by tests of Gaussian such as skewness and kurtosis or by cross-validation of non-parametric statistics is recommended.
REFERENCES ty EEG and individual MRI: application to mismatch negativities in schizophrenia. Hum Brain Mapp 2002; 17(3):168-178.
1. Strik WK, Fallgatter AJ, Brandeis D, Pascual-Marqui RD. Three-dimensional tomography of event-related potentials during response inhibition: evidence for phasic frontal lobe activation. Evoked Potentials-EEG Clin Neurophysiol 1998; 108:406-413.
5. Pae JS, Kwon JS, Youn T, Park HJ, Kim MS, Lee B, Park KS. LORETA imaging of P300 in schizophrenia with individual MRI and 128-channel EEG. Neuroimage 2003; 20(3):1552-1560.
2. Pascual-Marqui RD, Lehmann D, Koenig T, Kochi K, Merlo MCG, Hell D, Koukkou M: Low resolution brain electromagnetic tomography (LORETA) functional imaging in acute, neuroleptic-naive, first-episode, productive schizophrenia. Psychiatry Res-NeuroImaging 1999; 90: 169-179.
6. Huizenga HM, de Munck JC, Waldorp LJ, Grasman RP. Spatiotemporal EEG/MEG source analysis based on a parametric noise covariance model. IEEE Trans Biomed Eng 2002; 49(6):533-539. 7. Hori J, He B. Equivalent dipole source imaging of brain electric activity by means of parametric projection filter. Ann Biomed Eng 2001; 29(5):436-445.
3. Yamashita O, Galka A, Ozaki T, Biscay R, Valdes-Sosa P. Recursive penalized least squares solution for dynamical inverse problems of EEG generation. Hum Brain Mapp 2004; (4):221-235.
8. Waldorp LJ, Huizenga HM, Dolan CV, Molenaar PC. Estimated generalized least squares electromagnetic source analysis based on a parametric noise covariance model. IEEE Trans Biomed Eng 2001; 48(6):737-741.
4. Park HJ, Kwon JS, Youn T, Pae JS, Kim JJ, Kim MS, Ha KS. Statistical parametric mapping of LORETA using high densi-
7
CLINICAL EEG and NEUROSCIENCE
©2005 VOL. 36 NO. 1
15. Spiegelman D, Casella M. Robustness and power of analysis of covariance applied to data distorted from normality by floor effects: homogeneous regression slopes. Stat Med 1996; 15(5):477-496.
9. Bosch-Bayard J, Valdes-Sosa P, Virues-Alba T, AubertVazquez E, John ER, Harmony T, et al. 3D statistical parametric mapping of EEG source spectra by means of variable resolution electromagnetic tomography (VARETA). Clin Electroencephalogr 2001; 32(2):47-61.
16. Thatcher RW, Walker RA, Biver C, North D, Curtin R. Quantitative EEG normative databases: validation and clinical correlation. J Neurotherapy 2003; 7: 87-122.
10. Machado C, Cuspineda E, Valdes, P, Virues T, Llopis F, Bosch J, et al. Assessing acute middle cerebral artery ischemic stroke by quantitative electric tomography. Clin EEG Neurosci 2004; 35(2): 116-124.
17. Pascual-Margui RD. Free software and documentation from the Key Institute that was downloaded from http://www.unizh.ch/keyinst/NewLORETA/Software/Software.htm.
11. Pascual-Marqui RD, Michel CM, Lehmann D. Low resolution electromagnetic tomography: a new method for localizing electrical activity in the brain. Intl J Psychophysiology 1994; 18:49-65.
18. Kaiser DA, Sterman MB. Automatic artifact detection, overlapping windows and state transitions. J Neurotherapy 2001; 4 (3): 85-92.
12. Pascual-Marqui RD. Review of methods for solving the EEG inverse problem. Intl J Bioelectromagnetism 1999; 1:75-86.
19. Nichols TE, Holmes AP. Nonparametric permutation tests for functional neuroimaging: a primer with examples. Hum Brain Mapp 2002; 15:1–25.
13. Marrelec G, Benali H, Ciuciu P, Pelegrini-Issac M, Poline JB. Robust Bayesian estimation of the hemodynamic response function in event-related BOLD fMRI using basic physiological information. Hum Brain Mapp 2003; 19(1):1-17.
20. Laufer I, Pratt H. Evoked potentials to auditory movement sensation in duplex perception. Clin Neurophysiol 2003; 114(7):1316-1331.
14. Correa JA, Bellavance F. Power comparison of robust approximate and non-parametric tests for the analysis of cross-over trials. Stat Med 2001; 20(8):1185-1896.
21. Thatcher RW, North D, Biver C. Sensitivity and specificity of a LORETA normative EEG database. Clin EEG Neurosci. In press, 2005.
8
CLINICAL EEG and NEUROSCIENCE Catherine Demeter Editorial Manager 2568 E. Denton Lane Phoenix, Arizona 85016, U.S.A.
Date Sent ___________________________ Please Return By _____________________ Scheduled for the ________________ Issue
Proofing Information: The attached page proofs of your article should be completely read, corrected, and returned within 10 (ten) days. Failure to return the proofs promptly may result in your article not being published in the scheduled issue, and rescheduled for a later publication date. There is no charge for typographical errors, small changes, or because the editors made a change which alters your intended meaning.
Reprint Information: Reprints will be an exact reproduction of the article as it appears in the journal, including page numbers and other identification. Refer to the tables below in figuring the amount to enclose.
Reprint orders must be accompanied by payment in U.S. funds, or an institutional purchase order. Pages 4 5 6 7 8 9 10 11 12 14 16 20
100 75.00 90.00 110.00 130.00 145.00 160.00 180.00 200.00 220.00 260.00 300.00 360.00
200 120.00 150.00 180.00 210.00 240.00 270.00 300.00 330.00 360.00 420.00 480.00 550.00
300 170.00 210.00 250.00 290.00 330.00 370.00 410.00 450.00 490.00 570.00 650.00 700.00
400 210.00 260.00 310.00 360.00 410.00 460.00 520.00 580.00 640.00 740.00 830.00 860.00
500 260.00 320.00 380.00 450.00 510.00 570.00 640.00 710.00 770.00 890.00 1000.00 1100.00
All reprints are shipped immediately after current issue is completed. We cannot be responsible for delays or lost shipments outside the U.S. If special shipping instructions are needed, please indicate when ordering.
• Minimum order quantity is 100 copies. • Minimum order amount is $75. • The above prices include U.S.A. shipping. Outside U.S.A. add the following percentage: Canada & Mexico = 5%. All other countries = 15%.
REPRINT ORDER FORM I wish to order __________________________________(quantity) Reprints of: Article Name _________________________________________________________________________________________ Author’s Name: _______________________________________________________________________________________ Shipping Address: _____________________________________________________________________________________ City, State, Postal Code: ________________________________________________________________________________ Country: _____________________________________________________________________________________________ All reprint orders must be accompanied by credit card, or check or money order in U.S. Funds made payable to CLINICAL EEG and NEUROSCIENCE. Institutional purchase orders are accepted. Please return your reprint order with corrected proof. Credit Card No. __________________________________________________Exp. Date ____________________________ Signature _______________________________________________________Amount $_____________________________ ■ Check enclosed, made payable in U.S. funds to the ECNS. PLEASE RETURN THIS ORDER FORM WITH PROOFS TO: Clinical EEG and Neuroscience, Catherine Demeter, 2568 E. Denton Lane, Phoenix, Arizona 85016, U.S.A. Please fax pages with any corrections to the publisher at 630-653-6233. This will allow us to proceed without delay.