Atmospheric Measurement Techniques Discussions
Published by Copernicus Publications on behalf of the European Geosciences Union.
|
5079
Discussion Paper
Correspondence to: I. S. McDermid (
[email protected])
AMTD 4, 5079–5109, 2011
Part 1: Instrument development, optimization, and validation I. S. McDermid et al.
Title Page Abstract
Introduction
Conclusions
References
Tables
Figures
J
I
J
I
Back
Close
|
Received: 18 May 2011 – Accepted: 5 August 2011 – Published: 10 August 2011
Discussion Paper
Table Mountain Facility, Jet Propulsion Laboratory, California Institute of Technology, Wrightwood, CA 92397, USA
|
I. S. McDermid, T. Leblanc, and T. D. Walsh
Discussion Paper
Ground-based water vapor Raman lidar measurements up to the upper troposphere and lower stratosphere – Part 1: Instrument development, optimization, and validation
|
This discussion paper is/has been under review for the journal Atmospheric Measurement Techniques (AMT). Please refer to the corresponding final paper in AMT if available.
Discussion Paper
Atmos. Meas. Tech. Discuss., 4, 5079–5109, 2011 www.atmos-meas-tech-discuss.net/4/5079/2011/ doi:10.5194/amtd-4-5079-2011 © Author(s) 2011. CC Attribution 3.0 License.
Full Screen / Esc
Printer-friendly Version Interactive Discussion
5
Discussion Paper |
5080
AMTD 4, 5079–5109, 2011
Part 1: Instrument development, optimization, and validation I. S. McDermid et al.
Title Page Abstract
Introduction
Conclusions
References
Tables
Figures
J
I
J
I
Back
Close
|
25
Discussion Paper
20
Due to its radiative, chemical, and thermodynamic properties, water vapor has long been identified as a key constituent of the atmosphere. The water vapor molecule strongly absorbs infrared radiation and in the troposphere it is therefore a primary greenhouse gas. In the stratosphere it is produced by methane oxidation thus linking it to ozone chemistry. It was shown that a global increase in lower stratospheric H2 O mixing ratio similar to that observed locally since 1981 (Oltmans and Hofmann, 1995; Hurst et al., 2011), would contribute to a surface warming reaching 40 % of that responsible from CO2 increases over the same period (Forster and Shine, 1999). The resulting lower stratospheric cooling would be of same order of magnitude as that caused by changes in ozone concentrations. Therefore, to fully understand, quantify,
|
1 Introduction
Discussion Paper
15
|
10
Recognizing the importance of water vapor in the upper troposphere and lower stratosphere (UT/LS) and the scarcity of high-quality, long-term measurements, JPL began the development of a powerful Raman lidar in 2005 to try to meet these needs. This development was endorsed by the Network for the Detection of Atmospheric Composition Change (NDACC) and the validation program for the EOS-Aura satellite. In this paper we review the stages in the instrumental development of the lidar and the conclusions from three validation campaigns: MOHAVE, MOHAVE-II, and MOHAVE 2009 (Measurements of Humidity in the Atmosphere and Validation Experiments). The data analysis, profile retrieval and calibration procedures, as well as additional results from MOHAVE-2009 are presented in detail in a companion paper (Leblanc et al., 2011a). Ultimately the lidar has demonstrated capability to measure water vapor profiles from ∼1 km above the ground to the lower stratosphere, reaching 14 km for 1-h integrated profiles and 21 km for 6-h integrated profiles, with a precision of 10 % or better near 13 km and below, and an estimated accuracy of 5 %.
Discussion Paper
Abstract
Full Screen / Esc
Printer-friendly Version Interactive Discussion
5081
|
Discussion Paper
AMTD 4, 5079–5109, 2011
Part 1: Instrument development, optimization, and validation I. S. McDermid et al.
Title Page Abstract
Introduction
Conclusions
References
Tables
Figures
J
I
J
I
Back
Close
| Discussion Paper
25
|
20
Discussion Paper
15
|
10
Discussion Paper
5
and predict future water vapor-related radiative and chemical processes impacting climate change, high accuracy water vapor measurements throughout the troposphere and stratosphere are required (typically 3–10 %). Many instruments however currently cannot achieve such measurement accuracy without thorough calibration and validation. In order to address this issue, the Network for the Detection of Atmospheric Composition Change (NDACC, formerly known as NDSC) recently included water vapor Raman lidar in its suite of long-term monitoring techniques. The fundamental Raman lidar measurement technique is relatively simple and easy to implement (e.g. Melfi et al., 1969; Cooney, 1970; Vaughan et al., 1988; Sherlock et al., 1999a,b). A laser pulse is emitted into the atmosphere and scattered by the molecules and particles. A fraction of the laser light is collected back on the ground with a telescope, where it is spectrally separated, and sampled in time (i.e. distance). After typical corrections, the ratio of the lidar signals collected in the water vapor and nitrogen channels is proportional to water vapor mixing ratio. To obtain the absolute water vapor mixing ratio the lidar profile needs calibration, which for example, is done using the mixing ratio measured by radiosonde in the lower troposphere. In the framework of NDACC, a high capability water vapor Raman lidar was recently built at the Jet Propulsion Laboratory (JPL) Table Mountain Facility (TMF) in California (34.4◦ N, 117.5◦ W, elevation 2285 m), with the primary objective of reaching the upper troposphere and lower stratosphere (UTLS) with the best possible accuracy (5 % or better). The instrument, referred to as “TMW” in the remainder of this paper, went through several configurations before routine measurements were finally obtained with the quality requirements initially set. The TMW instrument technical description and achievements, including multiple upgrades over the period 2005–present, is presented here. A detailed description of the data analysis and calibration procedure is provided in a companion paper (Leblanc et al., 2011a). The initial lidar configuration will be described in Sect. 2. The various stages of instrument validation and optimization that led to the present configuration will
Full Screen / Esc
Printer-friendly Version Interactive Discussion
2 Instrument initial setup 2.1 Transmitter
Discussion Paper
be described in Sect. 3. This section will be concluded by results from the MOHAVE2009 campaign which characterize the present performance of the system.
|
10
|
5082
Discussion Paper
20
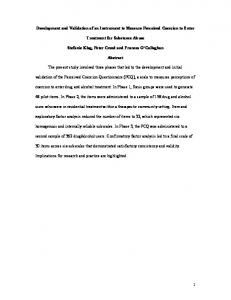
The primary telescope is a 91 cm-diameter Newtonian telescope for the far-range channels supplemented by three (later four) 7.5 cm-diameter refractive telescopes for the near range. Coupling of the large telescope to the receiver polychromator is one of the arrangements that was changed as the lidar evolved as discussed in Sect. 3. TMW −1 −1 makes use of the vibrational Raman shift at 2330 cm for nitrogen and 3654 cm for water vapor, which for an emission at 355 nm, translates to receiving at 387 nm and 407 nm respectively. The small receivers are each designed to detect only a single wavelength and, as shown in Fig. 1, comprise a 7.5 cm fused silica lens (L1), a variable diaphragm field
4, 5079–5109, 2011
Part 1: Instrument development, optimization, and validation I. S. McDermid et al.
Title Page Abstract
Introduction
Conclusions
References
Tables
Figures
J
I
J
I
Back
Close
|
2.2 Receiver
Discussion Paper
15
|
Throughout the development of the TMW lidar system, the laser transmitter, telescope, and the data acquisition system have remained essentially unchanged. The laser is a high pulse energy Nd:YAG laser (Continuum) operating at 355 nm at a repetition rate of 10 Hz. While specified to produce more than 900 mJ/pulse, in long-term operation it consistently provides around 650 mJ/pulse. The beam is expanded 7.5 × using a refractive beam-expander (CVI) before being steered into the atmosphere. Alignment of the laser to the receiving telescope is performed automatically and the program and mechanics of this part of the system has been fully described by Aspey et al. (2008). Figure 1 of this reference also shows the basic arrangement of the lidar transmitter and receiver telescope.
Discussion Paper
5
AMTD
Full Screen / Esc
Printer-friendly Version Interactive Discussion
5083
|
Discussion Paper
AMTD 4, 5079–5109, 2011
Part 1: Instrument development, optimization, and validation I. S. McDermid et al.
Title Page Abstract
Introduction
Conclusions
References
Tables
Figures
J
I
J
I
Back
Close
| Discussion Paper
25
|
20
Discussion Paper
15
|
10
Discussion Paper
5
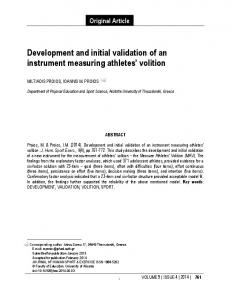
stop (FS), collimating and refocusing lenses sandwiching an interference filter (one each for 355 nm [F3], 387 nm [F1], and 407 nm [F2]). The received light is focused directly onto the photomultiplier (PMT) detector modules (P). Other than the addition of a fourth channel (very low intensity 355 nm for tropospheric aerosols information), the small receivers setup was basically unchanged since the lidar first light in 2005. A diagram of the initial design of the channels coupled out of the large telescope is shown in Fig. 2. Light was sent from the telescope into the polychromator using a 1 mm diameter UV grade optical fiber (CeramOptec). The 0.22 numerical aperture of the fiber was matched to the f /2.7 focal ratio of the telescope and the diameter of the fiber also acted as a field-stop defining the field-of-view (fov) as 400 µrad. There were several reasons for choosing to use fiber coupling. It was not clear at the outset whether it would be required to install a chopper to counter signal-induced-noise. Should this have proved necessary, it would have been much easier to implement with a fiber. Also, we have successfully used similar fibers in other lidar systems (e.g. McDermid et al., 1999) and they minimize obscuration in the Newtonian configuration. Referring to Fig. 2, the light entering the polychromator from the fiber is collimated and then the first dichroic beamsplitter (B1) transmits 387 nm while reflecting 407 nm and 355 nm. An interference filter (F1) further selects only 387 nm and then the signal is divided using an anti-reflection coated fused silica plate (B3) into two parts with intensity ratio approximately 99:1. Using these 99:1 dual channels allows signal non-linearities, i.e. saturation, to be corrected and dynamic range to be extended. Similarly, beamsplitter (B2) reflects 407 nm and transmits the remaining 355 nm. As for the 387 nm channels, an interference filter (F2) is used to select only 407 nm and the signal is divided (B3) into high and medium intensity channels. Interference filter (F3) transmits only 355 nm onto a gated PMT. In the original configuration, all 8 channels (5 channels from the large telescope and 3 from the small telescopes) utilized the same type PMT modules (Hamamatsu H5783P) except for the 355 nm high-intensity channel which used a bare R7400 PMT (Hamamatsu) in a home-built electronically gated base. This PMT was electronically
Full Screen / Esc
Printer-friendly Version Interactive Discussion
2.3 Results from the initial configuration (2005–2006) 5
Discussion Paper
AMTD 4, 5079–5109, 2011
Part 1: Instrument development, optimization, and validation I. S. McDermid et al.
Title Page Abstract
Introduction
Conclusions
References
Tables
Figures
J
I
J
I
Back
Close
| Discussion Paper
25
|
20
Discussion Paper
15
|
10
|
The configuration described above was used in 2005 and 2006 up to and including the first MOHAVE campaign (October 2006). Data were acquired typically during 2 h at the beginning of the night and simultaneously with the two other operating lidars on site (tropospheric ozone lidar, and stratospheric ozone/aerosols/temperature lidar). The 2-h long measurements were sliced into 5-min interval datasets, providing vertical profiles with high temporal resolution for altitude ranges with sufficient signal-to-noise ratios (typically, below 10 km). The lidar signals from all three pairs of 387–407 nm channels were analyzed for the retrieval of water vapor (3–20 km) by our lidar analysis software LidAna (Leblanc, 2011a). Calibration was obtained using the mixing ratio values measured in the lower troposphere by meteorological radiosondes launched from the lidar site. For that purpose the JPL lidar team uses its own Vaisala RS92 radiosonde station. One RS92 radiosonde was launched from TMF on each lidar measurement night. Typically the launch time is chosen to coincide with the first hour of the lidar measurement. A detailed description of the data analysis and calibration procedure is provided in our companion paper (Leblanc et al., 2011). More than 200 2-h-long lidar profiles were analyzed during the June 2005–October 2006 period. Figure 3 shows four examples of individual water vapor profiles obtained simultaneously by the lidar and RS92 radiosondes showing good agreement between the lidar and the radiosonde up to about 9–10 km and an increasing difference as we approach and cross the tropopause, the RS92 being too dry and/or the lidar being too wet. The difference is clearly identified in the compiled statistics shown in Fig. 4. The excessive dryness of the RS92 in the upper troposphere has been known and well documented for many years (Miloshevich et al., 2004, 2009). However, the possible wet bias of the 5084
Discussion Paper
gated to turn on at about 20 km in order to suppress some of the saturation and signalinduced-noise caused by the very high intensity Rayleigh returns from lower altitudes. All PMT signals were input to a series of photon counting multi-channel-scalers (Licel).
Full Screen / Esc
Printer-friendly Version Interactive Discussion
10
Discussion Paper |
5085
AMTD 4, 5079–5109, 2011
Part 1: Instrument development, optimization, and validation I. S. McDermid et al.
Title Page Abstract
Introduction
Conclusions
References
Tables
Figures
J
I
J
I
Back
Close
|
25
Discussion Paper
20
|
15
¨ Fifty RS92 radiosondes and 10 Cryogenic Frost-point Hygrometers (CFH) (Vomel et al., 2007) were launched from TMF during the 15 nights of the campaign. Two mobile lidars from the Goddard Space Flight Center (GSFC): Aerosol and Temperature Lidar (AT-Lidar) (McGee et al., 1991), and Scanning Raman Lidar (SRL) (Whiteman et al., 2006), were deployed at TMF for the campaign. The Naval Research Laboratory (NRL) Water Vapor Millimeter-wave Spectrometer (WVMS), one Global Positioning System (GPS) from JPL and one from GSFC also participated. Each of the three collocated water vapor lidars acquired over 150 h of measurements (2 to 10 h per night). At least one balloon per night was launched, each payload including one or two RS92. Ten payloads also contained a CFH and an ozonesonde. The lidar data corresponding to the first hour after launch were systematically processed and compared with the balloon measurements. In these 1-h profiles, thin layered structures were well captured by all instruments but the lidar profiles begin to get noisy above 12 km. Figure 5 shows the average of four profiles acquired simultaneously by five different instruments/techniques during the campaign. If the CFH is taken as the reference profile, we find a dry bias in the upper troposphere for the RS92 and a wet bias for all three lidars, even though the lidars show excellent agreement with each other. After investigating the possible sources of the lidar wet bias and running additional test experiments, signal contamination by fluorescence in the lidar receivers was
Discussion Paper
3.1 The MOHAVE-I campaign (October 2006)
|
3 Instrument optimization and validation
Discussion Paper
5
lidar in the UT/LS could not be confirmed until the lidar profiles could be compared to accurate measurements in this region. These comparisons took place during the Measurements Of Humidity in the Atmosphere and Validation Experiments (MOHAVE) campaign held in October 2006 with the primary objective of validating the Raman water vapor lidar measurement in the UT/LS.
Full Screen / Esc
Printer-friendly Version Interactive Discussion
Discussion Paper
3.2 Receiver second configuration (2007–2009)
|
10
Discussion Paper
5
identified, which led all three lidar teams to modify their instrument configuration. For the JPL lidar, a 355 nm blocking filter was temporarily installed in front of the fiber optic. The instrument acquired 3 profiles simultaneously with a CFH in this configuration. The difference between the CFH and lidar profiles during these three flights was compared to that before the modification. The results are plotted in Fig. 6 (left and center panels respectively). As anticipated, the wet bias completely disappeared after the modification (center panel). The nature of the fluorescence contamination was demonstrated by applying a physically-based empirical correction to the contaminated signals plotted in Fig. 6 (left panel). The profiles retrieved from the corrected signals are shown in Fig. 6 (right panel). The identification and removal of signal contamination by fluorescence was a major milestone in the TMF water vapor lidar project, and a major achievement of the MOHAVE campaign (Leblanc et al., 2008a)
|
20
4, 5079–5109, 2011
Part 1: Instrument development, optimization, and validation I. S. McDermid et al.
Title Page Abstract
Introduction
Conclusions
References
Tables
Figures
J
I
J
I
Back
Close
| Discussion Paper
25
Discussion Paper
15
|
After MOHAVE, the front-end of the lidar receiver was redesigned to permanently suppress the fluorescence identified in the fiber optic during the campaign. This modification required custom-designed mechanical and optical components and was fully implemented in July 2007. Between MOHAVE and July 2007, only minor modifications were made (including sensitivity tests to fluorescence of several fiber optics). Routine operation continued alternately with and without fluorescence contamination. Signals knowingly acquired with contamination were empirically corrected to remove the effect of the fluorescence. The new configuration is shown in Fig. 7 and was fully implemented in July 2007. The strong 355 nm Rayleigh signal was redirected out of the main optical path ahead of the focus of the large telescope using a long-wave pass beamsplitter (B4) that reflected 355 nm and transmitted 387 nm and 407 nm. An additional 355 nm blocking filter (F4) was placed ahead of the fiber connecting to the polychromator. A separate fiber was used to transmit the 355 nm to the gated PMT. This arrangement successfully eliminated fluorescence in the 387 nm and 407 nm signals (Leblanc et al., 2008a). However, the new and much stronger spectral selectivity 5086
AMTD
Full Screen / Esc
Printer-friendly Version Interactive Discussion
3.3 The MOHAVE-II campaign (October 2007) 5
AMTD 4, 5079–5109, 2011
Part 1: Instrument development, optimization, and validation I. S. McDermid et al.
Title Page Abstract
Introduction
Conclusions
References
Tables
Figures
J
I
J
I
Back
Close
| Discussion Paper |
5087
Discussion Paper
25
|
20
Discussion Paper
15
|
10
To evaluate the effectiveness of the system modifications to remove fluorescence, a second MOHAVE campaign was carried out in October 2007. Again, two mobile lidars from GSFC were deployed for MOHAVE-II. However, the SRL system having sustained major damage during transportation for MOHAVE-I, was replaced by the Atmospheric Laboratory for Validation, Interagency Collaboration, and Education (ALVICE) trailer. ALVICE contains an upgraded version of the Raman Airborne Spectroscopic Lidar (RASL) adapted for ground-based measurements (Whiteman et al., 2007, 2010). The AT lidar had only minor modifications. MOHAVE-II was implemented following operational principles similar to that of MOHAVE-I (Leblanc et al., 2008b). Figure 8 shows the average of the 10 profiles measured simultaneously by all participating instruments and techniques during the campaign. All the lidars agreed well with the CFH up to 12 km. Though the lidar profiles appear noisier, partly due to the signal decrease mentioned above, no wet bias appears anymore between the JPL lidar (magenta curve) and the CFH (green). On average, a 1-h lidar integration reached ∼15–16 km for the JPL system. A dry bias was still present on the uncorrected RS92 profile (red). A comparison of the results from the first two MOHAVE campaigns is shown in Fig. 9. This figure clearly demonstrates that the measurement accuracy of the Raman lidar is better than that of the RS92 in the UT/LS. The CFH measurement remains the best quality among all instruments but its cost per profile is much higher (>$ 3000 per CFH launch) than that of the lidar and clearly prohibitive for long-term, routine monitoring, i.e. multiple measurements per week.
Discussion Paper
resulted in an overall loss of signal by a factor of two, causing a decrease of 3 km (typically from 17 km to 14 km for 1-h integration) of the uppermost altitude of the instrument.
Full Screen / Esc
Printer-friendly Version Interactive Discussion
5
AMTD 4, 5079–5109, 2011
Part 1: Instrument development, optimization, and validation I. S. McDermid et al.
Title Page Abstract
Introduction
Conclusions
References
Tables
Figures
J
I
J
I
Back
Close
| Discussion Paper |
5088
Discussion Paper
25
|
20
Discussion Paper
15
|
10
While the installation of the additional optics to divert the 355 nm returns into a separate fiber eliminated the fluorescence contamination and brought the lidar profiles into agreement with the CFH, the signal levels, and consequently the altitude range of the measurement were reduced. Simulation of the expected lidar returns and comparison with other systems suggested that significant signal was being lost somewhere in our receiver; most likely coupling in and out of the fibers. To try to recover the signal level and potentially increase it, it was decided to eliminate the fibers completely and to reposition the receiver at the telescope Newtonian focus. Figure 10 is a schematic of the current receiver configuration (far-range channels). 0 To make the system more compact a new 387/407 nm beamsplitter (B1 ) operating at ◦ ◦ 45 angle of incidence was acquired to replace the previous one that operated at 30 . All of the other optical components were the same as described previously except for the field stops (FS). The new field stops were calibrated, ring-activated iris diaphragms that enabled the field-of-view to be varied as opposed to the fixed fov defined by the fiber diameter in the earlier configurations. This flexibility provided better optimization of laser/telescope overlap and sky background rejection. Values of 600 µrad and 800 µrad were finally selected for the Raman and 355H channels respectively. The various components of the receiver were aligned on top of each other to minimize obscuration of the large telescope and a calibration lamp was permanently mounted to the side of the receiver module. The purpose of this lamp is presented in Leblanc and McDermid (2008) and is further discussed in our companion paper (Leblanc et al., 2011b). One other change in this final configuration was to the 407H photomultiplier detector. The original Hamamatsu H5783P module was replaced with a H10682-110 photon counting head device. Within this module, the PMT high voltage supply and discriminator level are factory preset to optimum values. Also, the PMT in this device has a super-bialkali (SBA) photocathode which has higher quantum efficiency than standard
Discussion Paper
3.4 Receiver current configuration (2009–present)
Full Screen / Esc
Printer-friendly Version Interactive Discussion
AMTD 4, 5079–5109, 2011
Part 1: Instrument development, optimization, and validation I. S. McDermid et al.
Title Page Abstract
Introduction
Conclusions
References
Tables
Figures
J
I
J
I
Back
Close
| Discussion Paper
25
Discussion Paper
20
|
15
Discussion Paper
10
|
The modifications described above occurred in the summer of 2009 (July, August and September). No further changes occurred after that and the instrument remained untouched throughout the MOHAVE-2009 campaign with the exception of the calibration lamp (Leblanc et al., 2011b). This third MOHAVE campaign was by far the largest of all three MOHAVE campaigns with many participating instruments: two types of frost-point hygrometers (CFH and NOAA-Frost Point), two types of radiosonde (Vaisala and InterMet), two microwave radiometers (NRL and University of Bern), two FourierTransform spectrometers (the JPL MkIV and FTUVS), and two GPS receivers. The AT lidar and ALVICE from GSFC also returned. An additional system from GSFC, the Stratospheric Ozone Lidar Trailer (STROZ) (McGee et al., 2011) participated for the first time and contains a system similar to that in the AT lidar. This was fortunate since a laser failure in the AT lidar precluded any measurements during MOHAVE-2009 from this system. Coincident measurements from several satellite instruments (AuraMLS, Aqua-AIRS, Aura-TES, ENVISAT-MIPAS and ACE-FTS) were also compared to the balloon-borne and ground-based measurements. The campaign spanned approximately two weeks from 11 October to 27 October 2009. A review of the MOHAVE2009 campaign operations and results is provided in Leblanc et al. (2011b). Documentation and an overview of the results can be found on the campaign website: http://tmf-lidar.jpl.nasa.gov/campaigns/mohave2009.htm. A total of 44 balloons were launched which included 58 RS92 radiosondes, 16 CFH, 4 NOAA-FPH, and 16 ECC ozonesondes. Approximately 300 h of water vapor lidar measurements were acquired. Results from MIPAS, the MkIV spectrometer, balloon measurements, and two lidar 5089
|
3.5 The MOHAVE-2009 campaign (October 2009)
Discussion Paper
5
PMTs; 33 % at 407 nm compared to 25 % (eventually, when commercially available, ultra-biakali (UBA) photocathodes will further raise the QE to ∼40 %). The net result of all these changes was an order of magnitude increase in signal levels. However, such major changes required re-evaluation/validation and therefore another campaign, MOHAVE-2009 was organized.
Full Screen / Esc
Printer-friendly Version Interactive Discussion
5090
|
Discussion Paper
AMTD 4, 5079–5109, 2011
Part 1: Instrument development, optimization, and validation I. S. McDermid et al.
Title Page Abstract
Introduction
Conclusions
References
Tables
Figures
J
I
J
I
Back
Close
| Discussion Paper
25
|
20
Discussion Paper
15
|
10
Discussion Paper
5
instruments are presented in Stiller et al. (2011), Toon et al. (2011), Hurst et al. (2011), Whiteman et al. (2011), and McGee et al. (2011) respectively. Figure 11a–d shows four examples of water vapor profiles measured simultaneously during the campaign. In all plots, the lidar profiles (TMW, ALVICE and STROZ) were obtained from a 1-h integration starting at the corresponding balloon launch time. The CFH campaign-mean profile is provided on each plot for reference purposes only. 18 and 20 October (top-left and top-right panels) illustrate the very large natural variability in the troposphere from one night to another: very humid upper troposphere on 18 October and very dry on 20 October. Most of the very fine vertical structures (sometimes less than 1-km deep) are well captured by all balloon-borne and lidar instruments. A well-known RS92 dry bias is again systematically observed above 12 km (cyan curves). The RS92 profiles corrected following the method described by Miloshevich et al. (2009) show a better agreement with lidar and CFH above 13 km. The difference between corrected and uncorrected profiles can reach 35 % and is reviewed in Leblanc et al. (2011). The bottom-left and bottom-right panels of Fig. 11 show profiles measured on the night 27 October. Besides showing very large vertical changes (from 200 ppmv to 2000 ppmv in less than 2 km), the two figures illustrate the very high temporal variability on short timescales, namely a change at 4 km altitude from 200 ppmv to 4000 ppmv in a 5-h interval. The very fine and fast-changing structures observed on all plots of Fig. 11 confirm the need for extra care when producing comparisons between the various instruments and techniques. The campaign-mean profiles measured by the TMW and ALVICE lidars and their difference, is plotted in Fig. 12. Both uncorrected (blue) and fluorescence-corrected (green) ALVICE profiles are shown. During MOHAVE-2009, the ALVICE lidar signals experienced contamination by fluorescence unexpectedly induced in the instrument receiver. Using a source of external measurement in the UTLS (in this case CFH), this contamination can be characterized and the effect fluorescence can be mostly suppressed. This fluorescence correction is described in Whiteman et al. (2011). The ALVICE lidar wet bias due to fluorescence contamination remains small below 10 km,
Full Screen / Esc
Printer-friendly Version Interactive Discussion
5091
|
Discussion Paper
AMTD 4, 5079–5109, 2011
Part 1: Instrument development, optimization, and validation I. S. McDermid et al.
Title Page Abstract
Introduction
Conclusions
References
Tables
Figures
J
I
J
I
Back
Close
| Discussion Paper
25
|
20
Discussion Paper
15
|
10
Discussion Paper
5
but reaches 20 % above 13 km. Below 10 km, the lidars agree very well with each other with differences not exceeding 5 % (within the lidar uncertainty range). Finally the campaign-mean profiles measured simultaneously by the TMW lidar and CFH, and their difference, are plotted in Fig. 13. Since the CFH is the most accurate instrument in the UTLS participating to the MOHAVE-2009 campaign, this figure is indeed the most important result of the campaign for the TMW lidar. The comparisons were made using two different coincidence criteria. Below 14 km, atmospheric variability is very high and only the strictly coincident profiles were used to compute the mean (i.e. 12 CFH flights and the 12 corresponding 1-h integrated lidar profiles). Using the 1h integrated profiles prevents the lidar reaching altitudes above 14 km. For these higher altitudes, the lidar profiles integrated all-night were used (mean of 8 nights during which 9 CFH were launched). The TMW lidar and CFH profiles are in excellent agreement throughout the troposphere and the UTLS. The mean differences range from −5 % in the lowermost troposphere (TMW drier) to +2 % in the lower stratosphere (TMW wetter). These values are well below the reported uncertainties of both instruments. A close look at the green and pink dotted curves on the left panel of Fig. 13 reveals that the standard deviation of the lidar measurements above 16 km is two to three times larger than that of the CFH. This number provides a good indication of the number of additional lidar measurements needed to achieve the same precision as CFH. With the assumption that lidar data contains random noise following a Poisson distribution, using one to two CFH profiles yields a precision in the UTLS equivalent to integrating the lidar measurements for 5 to 8 full nights (i.e. 40 to 70 h). That is, one weekly CFH launch yields a precision in the UTLS similar to that of the integrated lidar measurement of 4 full nights per week. Similarly, one monthly CFH profile yields a precision in the UTLS equivalent to that of the integrated lidar measurement of one full night per week, or four 2-h-long measurements per week. These estimations therefore show that, with our current target to run TMW for two hours per night, 4 nights per week, we can achieve a precision in the UTLS equivalent to that achieved when launching one CFH per month.
Full Screen / Esc
Printer-friendly Version Interactive Discussion
5
AMTD 4, 5079–5109, 2011
Part 1: Instrument development, optimization, and validation I. S. McDermid et al.
Title Page Abstract
Introduction
Conclusions
References
Tables
Figures
J
I
J
I
Back
Close
| Discussion Paper |
5092
Discussion Paper
25
|
20
Discussion Paper
15
|
10
A high capability water vapor Raman lidar was developed at the Jet Propulsion Laboratory Table Mountain Facility (California) with the objective of making accurate, routine, long-term water vapor measurements in the UTLS. The system, referred to as “TMW’, was built in 2005 and optimized over the past four years. To support and achieve a full optimization, the MOHAVE-I, MOHAVE-II, and MOHAVE-2009 validation campaigns took place in October 2006, 2007 and 2009 respectively. During these campaigns the lidar measurements were extensively compared to operational radiosonde (Vaisala RS92) and Research-grade instruments (CFH). The MOHAVE-I campaign revealed the presence of fluorescence contaminating the lidar signal in its upper part (10–20 km). After a first major receiver configuration change in 2007, the MOHAVE-II campaign confirmed the removal of the contaminating fluorescence, but also revealed a substantial loss of signal resulting from this change. After a second major configuration change (summer 2009), the MOHAVE-2009 campaign finally showed that the TMW lidar was brought up to its initial performance expectations, i.e. capable of measuring water vapor mixing ratio in the UTLS with a precision of 10 % or better between 10 km and 16 km, and reaching 21–22 km with a degraded precision and vertical resolution. The latest comparisons with CFH measurements (MOHAVE-2009) showed excellent agreement throughout the troposphere and UTLS, with mean biases well below the reported measurements uncertainties. The TMW lidar shows a 2 % mean dry bias with CFH in the lower troposphere and a 3 % mean wet bias in the UTLS. A closer look at the lidar measurement standard deviations above 16 km during MOHAVE-2009 shows values two to three times larger than that of the CFH. At these altitudes the lidar signals are noise limited and the standard deviation values reflect the precision of the measurements, which therefore provides a good indication of the number of additional lidar measurements needed to achieve the same precision as CFH. It was estimated that one monthly CFH profile yields a precision in the UTLS equivalent
Discussion Paper
4 Conclusions
Full Screen / Esc
Printer-friendly Version Interactive Discussion
Discussion Paper |
5093
AMTD 4, 5079–5109, 2011
Part 1: Instrument development, optimization, and validation I. S. McDermid et al.
Title Page Abstract
Introduction
Conclusions
References
Tables
Figures
J
I
J
I
Back
Close
|
25
Discussion Paper
20
Aspey, R. A., McDermid, I. S., Leblanc, T., Howe, J. W., and Walsh, T. D.: LABVIEW graphical user interface for precision multichannel alignment of Raman lidar at Jet Propulsion Laboratory, Table Mountain Facility, Rev. Sci. Instrum., 79, 094502, doi:10.1063/1.2976672, 2008. Cooney, J.: Remote Measurements of Atmospheric Water Vapor Profiles Using the Raman Component of Laser Backscatter, J. Appl. Meteorol., 9, 182–184, doi:10.1175/15200450(1970)0092.0.co;2, 1970. de Forster, P. M. and Shine, K. P.: Stratospheric water vapour changes as a possible contributor to observed stratospheric cooling, Geophys. Res. Lett., 26, 3309–3312, doi:10.1029/1999gl010487, 1999. ¨ Hurst, D. F., Oltmans, S. J., Vomel, H., Rosenlof, K. H., Davis, S. M., Ray, E. A., Hall, E. G., and Jordan, A. F.: Stratospheric water vapor trends over Boulder, Colorado: Analysis of the 30 year Boulder record, J. Geophys. Res., 116, D02306, doi:10.1029/2010jd015065, 2011.
|
References
Discussion Paper
15
Acknowledgements. The work described in this paper was carried out at the Jet Propulsion Laboratory, California Institute of Technology, under agreements with the National Aeronautics and Space Administration. The authors are very grateful to Tony Grigsby and Jeffrey Howe for assisting in the collection of the data presented here.
|
10
Discussion Paper
5
to that of the integrated lidar measurement of one full night per week, or four 2-hlong measurements per week. These estimations show that, with our present target of routinely running TMW 2 h per night, 4 nights per week, we can achieve measurements with a precision in the UTLS equivalent to that achieved if launching one CFH per month. Though the TMW lidar is now fully optimized, its overall power-aperture product is well below most contemporary optimums. For example, commercial laser powers today can easily exceed 10 W at 355 nm as opposed to 6.5 W produced by our decade-old laser. Therefore it is not unlikely that a future laser upgrade, together with the upgrade of other components, will bring the precision of the TMW lidar closer to that of the CFH, thus requiring less laser running time to achieve similar levels of precision in the UTLS.
Full Screen / Esc
Printer-friendly Version Interactive Discussion
5094
|
AMTD 4, 5079–5109, 2011
Part 1: Instrument development, optimization, and validation I. S. McDermid et al.
Title Page Abstract
Introduction
Conclusions
References
Tables
Figures
J
I
J
I
Back
Close
| Discussion Paper
30
Discussion Paper
25
|
20
Discussion Paper
15
|
10
Discussion Paper
5
Leblanc, T. and McDermid, I. S.: Accuracy of Raman lidar water vapor calibration and its applicability to long-term measurements, Appl. Optics, 47, 5592–5603, 2008. Leblanc, T., McDermid, I. S., and Aspey, R. A.: First-Year Operation of a New Water Vapor Raman Lidar at the JPL Table Mountain Facility, California, J. Atmos. Ocean. Tech., 25, 1454–1462, doi:10.1175/2007JTECHA978.1, 2008a. Leblanc, T., McDermid, I. S., McGee, T. G., Twigg, L., Sumnicht, G., Whiteman, D. N., Rush, K., ¨ Cadirola, M., Venable, D., Connell, R., Demoz, B., Vomel, H., and Miloshevich, L.: Measurements of humidity in the atmosphere and validation experiments (MOHAVE, MOHAVE II): Results overview, Reviewed and Revised Papers of The 24th International Laser Radar Conference, 23–27 June 2008, Boulder, CO, 1013–1016, 2008b. Leblanc, T., McDermid, I. S., and Walsh, T. D.: Ground-based water vapor Raman lidar measurements up to the upper troposphere and lower stratosphere – Part 2: Data analysis and calibration for long-term monitoring, Atmos. Meas. Tech. Discuss., 4, 5111–5145, doi:10.5194/amtd-4-5111-2011, 2011a. Leblanc, T., Walsh, T. D., McDermid, I. S., Toon, G. C., Blavier, J.-F., Haines, B., Read, W. G., Herman, B., Fetzer, E., Sander, S., Pongetti, T., Whiteman, D. N., McGee, T. G., Twigg, L., Sumnicht, G., Venable, D., Calhoun, M., Dirisu, A., Hurst, D., Jordan, A., Hall, E., Miloshe¨ vich, L., Vomel, H., Straub, C., Kampfer, N., Nedoluha, G. E., Gomez, R. M., Holub, K., Gutman, S., Braun, J., Vanhove, T., Stiller, G., and Hauchecorne, A.: Measurements of Humidity in the Atmosphere and Validation Experiments (MOHAVE)-2009: overview of campaign operations and results, Atmos. Meas. Tech. Discuss., 4, 3277–3336, doi:10.5194/amtd-4-32772011, 2011b. McDermid, I. S., Beyerle, G., Haner, D. A., and Leblanc, T.: Redesign and improved performance of the tropospheric ozone lidar at the Jet Propulsion Laboratory Table Mountain Facility, Appl. Optics, 41, 7550–7555, 2002. McGee, T. J., Whiteman, D., Ferrare, R., Butler, J. J., and Burris, J. F.: STROZ LITE – STRatospheric OZone Lidar Trailer Experiment, Opt. Eng., 30, 31–39, 1991. McGee, T. G., Twigg, L., and Sumnicht, G.: STROZ lidar measurements of ozone, temperature and water vapor during the MOHAVE 2009 campaign, Atmos. Meas. Technol. Disc., in preparation, 2011. Melfi, S. H., Lawrence, J. D., and McCormic, M. P.: Observation of Raman scattering by water vapor in atmosphere, Appl. Phys. Lett., 15, 295–297, doi:10.1063/1.1653005, 1969.
Full Screen / Esc
Printer-friendly Version Interactive Discussion
5095
|
AMTD 4, 5079–5109, 2011
Part 1: Instrument development, optimization, and validation I. S. McDermid et al.
Title Page Abstract
Introduction
Conclusions
References
Tables
Figures
J
I
J
I
Back
Close
| Discussion Paper
30
Discussion Paper
25
|
20
Discussion Paper
15
|
10
Discussion Paper
5
¨ Miloshevich, L. M., Paukkunen, A., Vomel, H., and Oltmans, S. J.: Development and Validation of a Time-Lag Correction for Vaisala Radiosonde Humidity Measurements, J. Atmos. Ocean. Tech., 21, 1305–1327, doi:10.1175/1520-0426(2004)0212.0.CO;2, 2004. ¨ Miloshevich, L. M., Vomel, H., Whiteman, D. N., and Leblanc, T.: Accuracy assessment and correction of Vaisala RS92 radiosonde water vapor measurements, J. Geophys. Res., 114, D11305, doi:10.1029/2008jd011565, 2009. Oltmans, S. J. and Hofmann, D. J.: Increase in lower-stratospheric water-vapor at a mid-latitude Northern-Hemisphere site from 1981 to 1994, Nature, 374, 146–149, 1995. Sherlock, V., Garnier, A., Hauchecorne, A., and Keckhut, P.: Implementation and Validation of a Raman Lidar Measurement of Middle and Upper Tropospheric Water Vapor, Appl. Optics, 38, 5838–5850, 1999a. Sherlock, V., Hauchecorne, A., and Lenoble, J.: Methodology for the Independent Calibration of Raman Backscatter Water-Vapor Lidar Systems, Appl. Optics, 38, 5816–5837, 1999b. Stiller, G. P., Kiefer, M., Eckert, E., von Clarmann, T., Kellmann, S., Garc´ıa-Comas, M., Funke, ¨ B., Leblanc, T., Fetzer, E., Froidevaux, L., Gomez, M., Hall, E., Hurst, D., Jordan, A., Kampfer, N., Lambert, A., McDermid, I. S., McGee, T., Miloshevich, L., Nedoluha, G., Read, W., Schneider, M., Schwartz, M., Straub, C., Toon, G., Twigg, L. W., Walker, K., and Whiteman, D. N.: Validation of MIPAS IMK/IAA temperature, water vapor, and ozone profiles with MOHAVE-2009 campaign measurements, Atmos. Meas. Tech. Discuss., 4, 4403–4472, doi:10.5194/amtd-4-4403-2011, 2011. Toon, G. C., Blavier, J.-F., Leblanc, T., Pongetti, T., Schneider, M., and Gutman, S.: Groundbased atmospheric measurements by the JPL MkIV Interferometer during MOHAVE-2009, Atmos. Meas. Tech. Discuss., in preparation, 2011. Vaughan, G., Wareing, D. P., Thomas, L., and Mitev, V.: Humidity Measurements In The Free Troposphere Using Raman Backscatter, Q. J. Roy. Meteorol. Soc., 114, 1471–1484, 1988. ¨ Vomel, H., David, D. E., and Smith, K.: Accuracy of tropospheric and stratospheric water vapor measurements by the cryogenic frost point hygrometer: Instrumental details and observations, J. Geophys. Res., 112, D08305, doi:10.1029/2006jd007224, 2007. Whiteman, D. N., Veselovskii, I., Cadirola, M., Rush, K., Comer, J., Potter, J. R., and Tola, R.: Demonstration measurements of water vapor, cirrus clouds, and carbon dioxide using a highperformance Raman lidar, J. Atmos. Ocean. Tech., 24, 1377–1388, doi:10.1175/jtech2058.1, 2007.
Full Screen / Esc
Printer-friendly Version Interactive Discussion
| Discussion Paper
10
Discussion Paper
5
Whiteman, D. N., Rush, K., Rabenhorst, S., Welch, W., Cadirola, M., McIntire, G., Russo, F., Adam, M., Venable, D., Connell, R., Veselovskii, I., Forno, R., Mielke, B., Stein, B., Leblanc, T., McDermid, S., and Vomel, H.: Airborne and Ground-Based Measurements Using a High-Performance Raman Lidar, J. Atmos. Ocean. Tech., 27, 1781–1801, doi:10.1175/2010jtecha1391.1, 2010. Whiteman, D. N., Cadirola, M., Venable, D., Calhoun, M., Miloshevich, L., Vermeesch, K., Twigg, L., Dirisu, A., Hurst, D., Hall, E., Jordan, A., McGee, T., Leblanc, T., and McDermid, I. S.: Development of a Correction Technique for Raman Water Vapor Lidar Signal Dependent Wet Bias and Application to Upper Tropospheric Retrievals, Atmos. Meas. Tech. Discuss., submitted, 2011.
AMTD 4, 5079–5109, 2011
Part 1: Instrument development, optimization, and validation I. S. McDermid et al.
Title Page
| Discussion Paper
Introduction
Conclusions
References
Tables
Figures
J
I
J
I
Back
Close
|
Abstract
Discussion Paper |
5096
Full Screen / Esc
Printer-friendly Version Interactive Discussion
Discussion Paper
L1
| Discussion Paper
FS
|
F2
Discussion Paper
F1
F3
AMTD 4, 5079–5109, 2011
Part 1: Instrument development, optimization, and validation I. S. McDermid et al.
Title Page Introduction
Conclusions
References
Tables
Figures
J
I
J
I
Back
Close
|
Abstract
P
P
387L
407L
355L
NEAR CHANNELS Fig. 1. TMW lidar receiver configuration for the low-intensity channels (2005 to present). A fourth channel (355 nm extra-low intensity) was added in 2007.
|
5097
Discussion Paper
P
Full Screen / Esc
Printer-friendly Version Interactive Discussion
P
Discussion Paper
B2 F3
F2
P
B3
P 407H 387M
P
Discussion Paper
407M
F1
|
B3
B1
|
355H
Discussion Paper
FIBER FROM 0.91 m TELESCOPE
AMTD 4, 5079–5109, 2011
Part 1: Instrument development, optimization, and validation I. S. McDermid et al.
Title Page Introduction
Conclusions
References
Tables
Figures
J
I
J
I
Back
Close
|
Abstract
P
Fig. 2. TMW lidar receiver initial configuration (2005–2007) for the high- and mid-intensity channels.
|
5098
Discussion Paper
FAR CHANNELS 387H
Full Screen / Esc
Printer-friendly Version Interactive Discussion
Start: 2005/06/01 04:25:43
10
End: 2006/01/20 06:58:49 Lidar High-Intensity Lidar Mid-Intensity Lidar Low-Intensity Lidar Combined Radiosonde (dotted)
15
10
5
5
0
0 1
10
100 1000 WV mixing ratio (ppmv)
10000
1
10
100 1000 WV mixing ratio (ppmv)
10000
Discussion Paper
Altitude (km)
15
Start: 2006/01/20 04:58:48
|
End: 2005/06/01 06:25:46 Lidar High-Intensity Lidar Mid-Intensity Lidar Low-Intensity Lidar Combined Radiosonde (dotted)
20
Discussion Paper
20
|
20
Start: 2005/09/08 03:22:15
Altitude (km)
10
10
0
0 10000
1
10
100 1000 WV mixing ratio (ppmv)
10000
Fig. 3. Example of four water vapor mixing ratio profiles measured by TMW in 2005 and 2006. Each profile was selected to represent a different season.
|
5099
Discussion Paper
100 1000 WV mixing ratio (ppmv)
4, 5079–5109, 2011
Part 1: Instrument development, optimization, and validation I. S. McDermid et al.
Title Page Abstract
Introduction
Conclusions
References
Tables
Figures
J
I
J
I
Back
Close
|
5
10
End: 2006/04/29 06:37:05 Lidar High-Intensity Lidar Mid-Intensity Lidar Low-Intensity Lidar Combined Radiosonde (dotted)
15
5
1
Start: 2006/04/29 04:37:04
Discussion Paper
End: 2005/09/08 05:22:19 Lidar High-Intensity Lidar Mid-Intensity Lidar Low-Intensity Lidar Combined Radiosonde (dotted)
15
20
AMTD
Full Screen / Esc
Printer-friendly Version Interactive Discussion
Discussion Paper
Mean, all seasons, before MOHAVE-I 20
Mean 2005-2007 N_prof = 202
Discussion Paper
Altitude (km)
|
15
10
|
RS92 Lidar
5
Discussion Paper
Difference Lidar-RS92 Lidar uncertainty Std. Dev.
0 10000
-100
-50 0 50 Difference (in % of mean value)
100
Fig. 4. Comparison of the climatological mixing ratio profiles measured over the period June 2005–October 2007 by the TMW lidar and simultaneous and co-located Vaisala RS92 radiosondes. Left panel: mean profiles. Right panel: mean difference, lidar measurement uncertainty and standard deviation.
|
5100
Discussion Paper
10 100 1000 Mean H2O v.m.r (ppmv)
4, 5079–5109, 2011
Part 1: Instrument development, optimization, and validation I. S. McDermid et al.
Title Page Abstract
Introduction
Conclusions
References
Tables
Figures
J
I
J
I
Back
Close
|
1
AMTD
Full Screen / Esc
Printer-friendly Version Interactive Discussion
Discussion Paper
20 Mean of 4 simultaneous profiles measured during MOHAVE-I
| |
Altitude (km)
10
Discussion Paper
RS92 TMW lidar SRL lidar AT lidar CFH
15
0 0.001
0.01
0.1
1
10
|
5101
Discussion Paper
Fig. 5. Averaged water vapor mixing ratio computed from four profiles measured simultaneously during MOHAVE-I by the TMW lidar, two other lidars, CFH, and Vaisala RS92 radiosondes.
4, 5079–5109, 2011
Part 1: Instrument development, optimization, and validation I. S. McDermid et al.
Title Page Abstract
Introduction
Conclusions
References
Tables
Figures
J
I
J
I
Back
Close
|
Water vapor mass mixing ratio (g/kg)
Discussion Paper
5
AMTD
Full Screen / Esc
Printer-friendly Version Interactive Discussion
Discussion Paper |
Altitude (km)
20 No 355 nm block uncorrected (7 profiles)
15 10 5
20 355 nm block in front of fiber (3 profiles)
15 10
CFH TMW lidar
5
No 355 nm block corrected (7 profiles)
15 10
CFH TMW lidar
5
CFH TMW lidar
Discussion Paper
20
|
0 0.001 0.01 0.1 1 10 Water vapor mass mixing ratio (g/kg)
0 0.001 0.01 0.1 1 10 Water vapor mass mixing ratio (g/kg)
Fig. 6. Comparison of mean water vapor mixing ratio profiles measured simultaneously by the TMW lidar and CFH during MOHAVE-I. Left panel: lidar signals contaminated by fluorescence (no 355 nm block). Center panel: lidar signals free of fluorescence (355 nm block installed). Right panel: same as left panel, but after fluorescence correction is applied to lidar signals.
Discussion Paper
0 0.001 0.01 0.1 1 10 Water vapor mass mixing ratio (g/kg)
AMTD 4, 5079–5109, 2011
Part 1: Instrument development, optimization, and validation I. S. McDermid et al.
Title Page Introduction
Conclusions
References
Tables
Figures
J
I
J
I
Back
Close
|
Abstract
Discussion Paper |
5102
Full Screen / Esc
Printer-friendly Version Interactive Discussion
Discussion Paper
0.91 m TELESCOPE FIBER
B4
F4
|
FIBER
B2
P
Discussion Paper
F3
AMTD 4, 5079–5109, 2011
Part 1: Instrument development, optimization, and validation I. S. McDermid et al.
Title Page
355H
|
L1 B3
B1
P 407M
F1
B3
P
Discussion Paper
F2
407H P
P
Fig. 7. TMW lidar receiver second configuration (2007–2009) for the high- and mid-intensity channels.
|
5103
Discussion Paper
FAR CHANNELS 387H
Introduction
Conclusions
References
Tables
Figures
J
I
J
I
Back
Close
|
387M
Abstract
Full Screen / Esc
Printer-friendly Version Interactive Discussion
Discussion Paper
20
MOHAVE-2 (Oct 8-17, 2007)
0
Discussion Paper
5
|
Altitude (km)
10
10 profiles mean (10 x 1-hr lidar)
1
10
1000
10000
|
5104
Discussion Paper
Fig. 8. Averaged water vapor mixing ratio computed from 10 profiles measured simultaneously during MOHAVE-II by the TMW lidar, two other lidars, CFH, and Vaisala RS92 radiosondes.
4, 5079–5109, 2011
Part 1: Instrument development, optimization, and validation I. S. McDermid et al.
Title Page Abstract
Introduction
Conclusions
References
Tables
Figures
J
I
J
I
Back
Close
|
100 Mean H2O v.m.r (ppmv)
Discussion Paper
15
|
CFH Uncorrected RS92 Corrected RS92 TMW lidar ALVICE lidar AT lidar
AMTD
Full Screen / Esc
Printer-friendly Version Interactive Discussion
20 Nprof = 8
15
10
10
Discussion Paper
CFH RS80 RS92 RS92-Corrected TMW Lidar
|
15
|
Altitude (km)
Nprof = 9
CFH RS80 RS92 RS92-Corrected TMW Lidar
Discussion Paper
20
5 MOHAVE-2 (Oct 2007)
MOHAVE (Oct 2006) 1
10000
0
1
10 100 1000 Mean H2O v.m.r (ppmv)
10000
Fig. 9. Mean water vapor mixing ratio computed from 8 profiles measured simultaneously by the TMW lidar, RS92 radiosondes, and CFH during MOHAVE-I (left panel) and computed from 9 profiles measured simultaneously during MOHAVE-II (right panel).
|
5105
Discussion Paper
10 100 1000 Mean H2O v.m.r (ppmv)
4, 5079–5109, 2011
Part 1: Instrument development, optimization, and validation I. S. McDermid et al.
Title Page Abstract
Introduction
Conclusions
References
Tables
Figures
J
I
J
I
Back
Close
|
0
Discussion Paper
5
AMTD
Full Screen / Esc
Printer-friendly Version Interactive Discussion
FS P
B4
Discussion Paper
0.91 m TELESCOPE
|
P
407M
F2 F4
Discussion Paper
355H
F3 FS
|
P
B1’
B3
P 387M
Discussion Paper
407H
B3
F1
AMTD 4, 5079–5109, 2011
Part 1: Instrument development, optimization, and validation I. S. McDermid et al.
Title Page Introduction
Conclusions
References
Tables
Figures
J
I
J
I
Back
Close
|
Abstract
P
387H
Fig. 10. TMW lidar receiver final configuration (2009–present) for the high- and mid-intensity channels.
|
5106
Discussion Paper
FAR CHANNELS
Full Screen / Esc
Printer-friendly Version Interactive Discussion
10
10
5
0
0 10 100 1000 Water Vapor Volume Mixing Ratio (ppmv)
10 100 1000 Water Vapor Volume Mixing Ratio (ppmv)
27 October 2009 10:49 UT
10
5
0
Uncorrected RS92 Corrected RS92 TMW MLS (at 48 km) AIRS (at14 km) ALVICE CFH campaign-mean dotted black
0 10 100 1000 Water Vapor Volume Mixing Ratio (ppmv)
Fig. 11. Example of four water vapor mixing ratio profiles measured simultaneously by TMW, two other lidars, CFH, Aura-MLS, and RS92 radiosondes during MOHAVE-2009.
|
5107
Discussion Paper
10 100 1000 Water Vapor Volume Mixing Ratio (ppmv)
AMTD 4, 5079–5109, 2011
Part 1: Instrument development, optimization, and validation I. S. McDermid et al.
Title Page Abstract
Introduction
Conclusions
References
Tables
Figures
J
I
J
I
Back
Close
|
CFH Uncorrected RS92 Corrected RS92 TMW STROZ ALVICE CFH campaign-mean dotted black
Altitude (km)
Altitude (km)
10
Discussion Paper
15
|
27 October 2009 05:17 UT 15
5
CFH Uncorrected RS92 Corrected RS92 TMW STROZ ALVICE CFH campaign-mean dotted black
Discussion Paper
5
Uncorrected RS92 Corrected RS92 TMW STROZ ALVICE CFH campaign-mean dotted black
Altitude (km)
15
|
Altitude (km)
15
Discussion Paper
20 October 2009 08:11 UT
18 October 2009 06:44 UT
Full Screen / Esc
Printer-friendly Version Interactive Discussion
Discussion Paper |
ALVICE lidar vs. TMW lidar (Npairs = 10. max time diff.=102 min)
10
15
10
Mean diff. with ALVICE corr. ALVICE +/- std-dev (dotted) TMW +/- uncertainty
ALVICE-TMWx 100 TMW
|
5
5
0
0 -100
10 100 1000 Water Vapor Volume Mixing Ratio (ppmv)
-50 0 50 Water Vapor Volume Mixing Ratio Difference (%)
100
Discussion Paper |
5108
4, 5079–5109, 2011
Part 1: Instrument development, optimization, and validation I. S. McDermid et al.
Title Page Abstract
Introduction
Conclusions
References
Tables
Figures
J
I
J
I
Back
Close
|
Fig. 12. Comparison of mean water vapor mixing ratio (left panel) computed from 10 profiles measured simultaneously by the TMW lidar and the ALVICE lidar during MOHAVE-2009 and their difference (right panel). Both fluorescence-contaminated and fluorescence corrected profiles are shown for the ALVICE lidar.
Discussion Paper
ALVICE uncorrected ALVICE corrected ALVICE +/- std-dev (dotted) TMW TMW +/- uncertainty
Altitude (km)
Altitude (km)
15
Mean diff. with ALVICE uncorr.
Discussion Paper
ALVICE vs. TMW
AMTD
Full Screen / Esc
Printer-friendly Version Interactive Discussion
Discussion Paper |
TMW lidar vs. CFH
15
10
5
10
100
TMW-CFH x 100 CFH
10
5
1000
10000
Water Vapor Mixing Ratio (ppmv)
-100
-50 0 50 100 Water Vapor Volume Mixing Ratio Difference (%)
Discussion Paper |
5109
4, 5079–5109, 2011
Part 1: Instrument development, optimization, and validation I. S. McDermid et al.
Title Page Abstract
Introduction
Conclusions
References
Tables
Figures
J
I
J
I
Back
Close
|
Fig. 13. Comparison of the MOHAVE-2009 campaign-averaged mixing ratio profiles (left panel) calculated from all coincident profiles measured by the TMW lidar and the CFH, and their difference (right panel). A loose (±6 h) time coincidence criterion and longer lidar integration times were used in the UTLS, and a strict time coincidence criterion (±1 h) and 60-min-integrated lidar profiles were used in the lower and mid-troposphere.
Discussion Paper
1
15
Mean Diff. Fitted mean Diff. CFH std-dev (dotted) TMW uncertainty
|
2.5-14 km layer: Lidar Mean, 12 x 1-hr Lidar +/-Std-Dev (dotted) CFH Mean, 12 launches CFH +/-Std-Dev (dotted)
Altitude (km)
Altitude (km)
20 14-20 km layer: Lidar all-night mean, 8 nights Lidar +/-Std-Dev (dotted) CFH Mean, 9 launches CFH +/-Std-Dev (dotted)
Discussion Paper
20
AMTD
Full Screen / Esc
Printer-friendly Version Interactive Discussion