2066
IEEE TRANSACTIONS ON POWER DELIVERY, VOL. 29, NO. 5, OCTOBER 2014
Partial Discharge Localization in Power Transformers Using Neuro-Fuzzy Technique Mohammad Homaei, Seyed Mahdi Moosavian, Student Member, IEEE, and Hazlee Azil Illias, Member, IEEE
Abstract—Partial discharge (PD) is the most common sources of insulation failure in power transformers. The most important tools for quality assessment of power transformers are PD detection, measurement, and classification. As for the maintenance and repair of transformers, the major importance is the techniques for locating a PD source. The transfer function-based (TF) method for power transformers’ winding in the high-frequency range is commonly used in power engineering applications, such as transient analysis, insulation coordination, and in transformer design. Although it is possible to localize PD in transformer winding using the transfer function (TF) method, this method cannot be used for transformers with no design data. Previous attempts toward finding a feature that localizes PD in transformers in general that lineate with PD location were found to be less successful. Therefore, in this paper, a neuro-fuzzy technique that uses unsupervised pattern recognition was proposed to localize PD source in power transformers. The proposed method was tested on a medium-voltage transformer winding in the laboratory. The results showed a significant improvement in localizing PD for major types of PD compared to currently available techniques, such as orthogonal transforms and the calibration line method. Index Terms—Feature extraction, neuro-fuzzy, orthogonal transforms, partial discharge (PD), pattern recognition, transformer.
I. INTRODUCTION
P
OWER transformers are important to electrical energy networks. They have been used in various environmental, electrical, and mechanical conditions. They have been used in various environmental, electrical, and mechanical conditions even though they are very expensive. Nonetheless, they form a high percentage in power system investment. A long
Manuscript received November 14, 2012; revised April 07, 2013, August 17, 2013, December 12, 2013, and April 11, 2014; accepted May 16, 2014. Date of publication July 28, 2014; date of current version September 19, 2014. This work was supported in part by the Malaysian Ministry of Higher Education (MOHE) HIR under research grant H-16001-00-D000048, in part by the UMRG under research grant RG135/11AET, and in part by FRGS under research grant FP026-2012A. Paper no. TPWRD-01226-2012. M. Homaei is with the Department of Electrical Engineering, Faculty of Electrical and Computer Engineering, K.N. Toosi University of Technology (KNTU), Tehran 1969764499, Iran (e-mail: mohammad.homaei@ outlook.com). S. M. Moosavian and H. A. Illias are with UM Power Energy Dedicated Advanced Centre (UMPEDAC), University of Malaya, Kuala Lumpur 59990, Malaysia, and also with the Department of Electrical Engineering, Faculty of Engineering, University of Malaya, Kuala Lumpur 50603, Malaysia (e-mail:
[email protected];
[email protected]). Color versions of one or more of the figures in this paper are available online at http://ieeexplore.ieee.org. Digital Object Identifier 10.1109/TPWRD.2014.2339274
transformer life is economically valuable and can prevent lost revenues when a power outage occurs [1]. The main reason of transformer failure is due to failure in its insulation, such as bushing and windings [2]. The failure is mainly due to partial discharge (PD), which is the energy dissipation caused by the localized electric-field intensity buildup [3]. The charge buildup and its release during PD can be the indication of problems related to aging, such as the presence of floating components, degradation, and failure of transformer insulation. Therefore, PD detection is used in power systems as a diagnostic tool to investigate the condition of a new or in-service insulation system of high-voltage (HV) equipment [4]. In the high-frequency range, the transfer function-based (TF) analysis of the power transformers’ winding is commonly used in various power engineering applications. These include transient analysis, insulation coordination, and transformer design. TF applications were used for diagnostic purposes, which led to the detection of turn-to-turn short circuit or insulation defects, such as PD within insulation [5]. If a PD is detected, the exact localization of the defect in the transformer is very important for maintenance or repair. Although localization of the PD in transformer winding using the winding transform function is possible, the method has limitations [5], [6]. This is especially for old transformers, where the design data, such as winding type, number, and type of disks, turn number in each disk, and dimension of the winding do not exist. This information is needed in the winding TF technique to localize the PD in a transformer. These days, there are various ways or techniques to localize PD occurrence in a transformer. The standard conventional technique measures the short current pulse which flows through the insulation defect where the discharge occurs [7]. These PDs are detected through a recharge process from a coupling capacitance. Another electrical method use RF antennas to measures the RF emissions occurring due to very short duration electrical pulses created by PD current in the defect/void [8]. PD sources, which emit acoustical waves directly through oil to the transformer tank wall, can be localized by measuring acoustical and electrical PD signals simultaneously. The location of the PD source is then calculated from the time delay between the electrical and acoustical PD signals using the triangulation method [4], [9]. On the other hand, the location of PD in the transformer winding can also be established using the multiconductor transmission-line model (MTLM). Through this model, a comparison between the measured and calculated transfer function allows the best model parameters to be obtained, which are then used for PD localization [10]. The capability of optical sensors for PD detection has already been proven [11]–[13]; however, the methodology for identification
0885-8977 © 2014 IEEE. Personal use is permitted, but republication/redistribution requires IEEE permission. See http://www.ieee.org/publications_standards/publications/rights/index.html for more information.
HOMAEI et al.: PD LOCALIZATION IN POWER TRANSFORMERS
2067
A. Karhunen–Loève Transform (KLT)
Fig. 1. General overview of system classification.
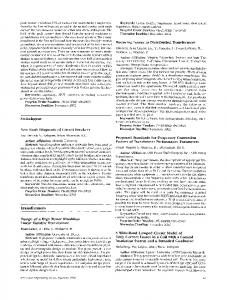
and localization of PD sources using optical sensors is still under investigation [14]. Previous attempts to find features that localize PD in transformers in general were found to be less successful. Therefore, this paper proposed a technique to localize PD in transformers in general, which depends on a system that changes its rules according to a certain case. In this technique, a system that can find a nonlinear relationship between features and PD location is required for transformers without design data. The proposed technique adapted a neurofuzzy system that uses unsupervised pattern recognition, based on the changes in the shape of PD signals. In the experimental work, PD signals were injected into 30 transformer-winding points and detected at the bushing and neutral ends. They are corona, void, and surface discharge. The reason for taking PD measurements at both bushing and neutral ends in this work is to compare which point of measurement will give a better correct prediction of different types of PDs. The PD localization was determined for each measurement result using orthogonal transforms, the calibration line method, and the proposed neurofuzzy technique. The results were compared to evaluate the advantages of the proposed method. The work is organized as such. Section II explains the mathematical background of pattern-recognition methods that were used, Section III presents the methodology of the work, Section IV shows the measurement and test circuit diagram, and Section V describes the results that were obtained from power transformer testing and PD localization results. Finally, Section VI concludes this paper and suggests future work for the improvement of the proposed method. II. PATTERN-RECOGNITION METHOD In machine learning, pattern recognition is assigned according to a specific algorithm of an output value (or label) to a given input value (or instance) [15]. Orthogonal transforms in pattern recognition enable a noninvertible transformation to a reduced dimensionality of the feature space from a pattern space. In PD localization, the main reason for orthogonal transforms is the generation of the output signal, which has valuable features. The transform-based features are reliable because an appropriately chosen transform can remove redundancies of information, which normally exist in samples from the measuring instrument [16], [17]. To find the location of the PD, the distance between features by using appropriate orthogonal transforms is obtained by using similarity and dissimilarity formulas on the transformed signals. Fig. 1 shows a general overview of system classification. Test and training patterns were processed for its feature measurement and classification.
The Karhunen–Loève Transform (KLT) is a well-known linear transformation technique that removes redundancy by decorrelating the data. Thus, a signal can be stored more effectively and can be used for data compression and filtering [18], [19]. KLT was first used in optimal transformation of random signals of 3.4 (the optimal here means a minimization of mean square error between data vector “x” and the transformed vector “X”, with the number of coefficients used for the retransformation being smaller than the number of coefficients of the original vector [20]). The orthogonal KLT transformation matrix calculation is assisted by an autocorrelation matrix A of an “x” random sequence. For any sequence of “x.,” the autocorrelation matrix A is given by (1) The eigenvalues of the autocorrelation matrix computation allow its eigenvectors to be calculated, which are the columns of transformation matrix for KLT. The eigenvectors arrangement, which corresponds to the absolute values of their eigenvalues, yields in a transformation matrix, as follows: (2) In order to localize PD in transformers, the computation of the features of the signals transformed by KLT is advantageous. The share of relative energy of a reference signal in a data signal exemplifies a good choice. B. Discrete Cosine (DCT) and Sine (DST) Transforms The discrete cosine transform (DCT) and discrete sine transform (DST) are Fourier-related transforms, such as the discrete Fourier transform (DFT). However, only real numbers are used in DCT and DST. Therefore, they are equivalent to DFTs of approximately twice the length. The applications of DCT and DST are in digital signals, image processing, and in transforming coding systems for data compression/decompression [21]. However, the energy compaction method of DCT and DST is better than DFT, that is, input data can be packed into a few numbers of coefficients [22], [23]. Also, the amount of energy packing by DCT and DST is higher than DFT for highly correlated signals. The DCT for a data vector of samples is defined by the transform matrix, as defined by (4), while for DST, it is defined by (3)
(4)
(5) where is the DST and DCT in convolution form, a number, and is the block size.
and
are
2068
IEEE TRANSACTIONS ON POWER DELIVERY, VOL. 29, NO. 5, OCTOBER 2014
C. Hadamard and Haar Transforms The wavelet has been popular in various transient analysis applications, especially in signal synthesis and analysis, pattern recognition, signal and image processing, denoising, and compression. Hadamard and Haar transforms are computationally advantageous over DCT and DST transforms. The Haar function is defined as a characteristic function of an interval (0, 1). The shape of the family of Haar functions, and of a given index depends on two parameters and (6) , and are determined uniquely, so that For and is the remainder, where . When the Haar function is defined as
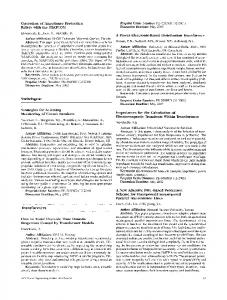
, (7) Fig. 2. Proposed clustering method for localization.
When dissimilarity between the clusters and the maximum number of clusters M. is calculated using otherwise. An example of a 4
(10)
4 Haar transformation matrix is as follows:
where and are extracted features from the recorded signals at 0 and 1. The most common dissimilarity between real-valued vectors used in practice is the weighted dissimilarity This indicates that (11)
(8) This shows the orthogonality of . The main advantage of the Haar transform is its provision of a multistage analysis rather than a unique transform, and its capability for data compression at some resolution levels in pattern-recognition problems [24]. Most of the energy that is focused in some samples consists of a considerable amount of information. The Hadamard transform is regarded as exemplifying a generalized class of Fourier transforms. The Hadamard transform is considered as being built out of size-2 DFTs through decomposing an arbitrary input vector into a superposition of Walsh functions. The Hadamard unitary matrix of order “ ” is a matrix and is generated by the iteration rule as shown
is the distance between points, is the weight, and where and are the points that their distances must be defined. By setting 1, the unweighted metric dissimilarity can be obtained, while setting 2, the well-known Euclidean distance can be determined. To test another method of dissimilarity, an inner product formula as in (12) is used
(9)
(13)
D. Similarity and Dissimilarity Formulas for Clustering Fig. 2 shows a clustering method that is proposed in this work for PD localization in transformers. The algorithm is mainly based on assigning N features vector to M clusters, with . The first feature vector is allocated to the first cluster. The second feature of the vector’s similarity with the first one will base its assignment to the first cluster or a new cluster. The system parameters determined by the user are the amount of
(12) shows the maximum similarity and is equal to 1 where and is the similarity between and . From many formulas for measuring similarities, the Tanimoto distance formula is chosen. The similarity is calculated by using
The second similarity measure
is calculated using (14)
where is the distance. The third similarity is a fuzzy measure. The degree of similarity between two real-valued variables and between 0 and 1 can be calculated using (15)
HOMAEI et al.: PD LOCALIZATION IN POWER TRANSFORMERS
2069
Fig. 3. Flowchart of the experiment.
The similarity between two variables between 0 and 1 will determine the similarity between two vectors, using (16)
III. METHODOLOGY Techniques to locate PD sources are important in transformer diagnosis and maintenance. However, locating PD source accurately is difficult due to the complex structure of transformers. PD pulses suffer from dispersion and attenuation when they travel from the original location to the measuring point. Although the PD signal detected by measuring device is highly attenuated compared to its original location, it contains useful information regarding the location and nature of PD. If this information is extracted and analyzed, the PD source location can be determined [25]. There have been many investigations on PD localization techniques. However, most of them use functions based on supervised pattern recognition, i.e., some experiments were performed offline on the winding, producing a technique that functions according to the extracted features. Sometimes, there is also no data available for old transformers or due to the lost of documents. Thus, supervised pattern recognition-based methods cannot be used for these cases. In order to have a comprehensive method that can be used for data-less transformers, in this work, a localization technique, which relies on the features of the signal propagating from the neutral and bushing ends are used. Fig. 3 shows the flowchart of the performed experimental test. The main problem in PD signals recording is a huge number of samples, where each signal vector has more than 6000 samples. Therefore, only valued information was observed via orthogonal transformation of the vectors. As long as there was parallel information in a signal vector, orthogonal transforms were used to reduce the number of samples and eliminate any worthless information. For KLT and Hadamard transforms, the number of samples must be , e.g., if a signal vector has 6000 samples, the vector can be fed with only 2048 or 4096 samples. Five transform methods were used to localize PD signals; they were KLT, DST, DCT, HAAR and HADAMARD. They
were used in the calculation of similarity and dissimilarity formulas to evaluate the effectiveness in locating PD signals in a transformer. To be more precise, the injected signals in neutral, clamp no. 3 and clamp no. 15 are called as A, B and C respectively. Using similarity and dissimilarity techniques, the similarity between B/A is checked if it is more than C/A once all signals are recorded in neutral. PD signals are localized with an interval error within the range of the PD injection point. For example, it is assumed that the method is successful if it estimates PD location in the neighborhood radius of 10% from the injection point. The calibration line and similarity and dissimilarity formulae were used to estimate the PD location. Then, the error for the actual PD location was calculated. Previously, authors had shown that statistical features of signals are not a reliable value to determine the location of PD [17]. Each orthogonal transforms were used and similarity and dissimilarity formulas made a feature. However, the linear feature of the signals will not lead to successful localization. Therefore, a new neuro-fuzzy based technique was proposed in this work. The most suitable feature was used to create a feature vector of the neuro-fuzzy system. The feature vectors of 30 injected signals were tested using the proposed method to show the ability of the proposed neuro-fuzzy method in localizing the PD. IV. MEASUREMENT In this section, the experiment setup and measurement circuit are described. The results obtained using different localization methods are shown in this section. The test object was one phase of 63 kV/20 kV, 30 MVA transformer winding, which the transformer’s tank was removed. The high-voltage winding is a disk type and has 58 disks. To access the internal points along the winding, a small portion of paper insulation with bordered winding turns was removed and connections along the winding were established. A connection was brought out from each odd disk (i.e. 28 brought out connection). Taking into account the line-end and neutral-end connections, 30 connections along the winding were available for PD signal injections. The low-voltage winding and regulating voltage winding with coarse and fine parts were installed inside and outside of the main high-voltage winding. This was done to replicate test conditions which are similar to the actual test conditions. An aluminum cylinder was placed inside the low-voltage winding to simulate the effect of the core. Fig. 4 shows the test object before the installation of voltage-regulating winding. PD signals for different kind of PD (i.e. corona, surface discharge and void) were created with PD signal generator and were injected into all 30 connections that are available along the winding while they were detected using clamps at neutral and bushing ends (refer to step 1 and 2 of flowchart Fig. 3). Fig. 5(a) and 5(b) shows the experiment setup for recording the PD in bushing end and neutral end respectively. The test circuit consists of a transformer winding, oscilloscope, personal computer (PC), PD calibrator and a coupling capacitor of 1000 pF. The coupling capacitor is used for the transfer of the highfrequency PD signal appearing across the transformer winding to the measuring impedance at low attenuation. The capacitive
2070
Fig. 4. High-voltage winding with 58 disks.
Fig. 5. Experimental setup with detection impedance for recording at (a) the bushing end and (b) neutral end.
behavior of the transformer bushing can also be represented, in principle, to . In these cases, the bushing tap test of the bushing that is usually used for loss factor measurement, is used for recording the PD signal. Hence, if the transformer under test has bushing tap on the line side, the separate for recording the PD in the line end [Fig. 5(a)] can be removed. The same concept is used for removing the external for recording PD in the neutral end [Fig. 5(b)] if the neutral side has a bushing tap test (for transformers with bushings in the neutral).
IEEE TRANSACTIONS ON POWER DELIVERY, VOL. 29, NO. 5, OCTOBER 2014
The sampling rate of the used oscilloscope was 500 Mb/s. It should be noted that the applied corona and void voltage were 2 kV while the applied surface voltage was 4 kV. During the test, the tap position of the regulating-voltage winding was such that the coarse and fine parts were pointing outward. Thus, modeling the regulating-voltage winding was not needed. Channel 1 of the oscilloscope was connected to the bushing and channel 2 was connected to neutral. Both bushing end connections and neutral end of the winding are connected to the detection impedance, as shown by and , which consist of the equivalent resistor, inductance, and capacitor. In this test, two detection impedances of 50 were used as the detection impedance to decouple the PD signals. The calibration signals were 500 pC. Six signals were used in the proposed localization technique of this paper. They are as follows: 1) a calibration signal injected at the neutral end and measured at the bushing end, produced an input feature vector which is equal to one for the output; 2) a calibration signal injected at the neutral end and measured at the neutral end, produced an input feature vector which is equal to zero for the output; this signal enables the effect of the detection equipment on the waveform of the PD signal to be evaluated; 3) a calibration signal injected at the bushing end and measured at the neutral end, produced an input feature vector which is equal to one for the output; 4) a calibration signal injected at the bushing end and measured at the bushing end, produced an input feature vector which is equal to zero for the output; 5) an actual PD signal that originated from the transformer and reached the neutral end which needs to be localized; 6) an actual PD signal that originated from the transformer and reached the bushing end which needs to be localized. Since PD signals deteriorate when they travel through the windings, PD location will affect its features. Therefore, the relationship between PD location and the features of the measured signal needs to be obtained. For the proposed method, the winding length is normalized to one. This means that if a signal is injected into neutral and received at the bushing end, it has a feature that indicates 1. If a PD signal is injected in the middle of the windings, it indicates 0.5. Different kinds of PD signals were created by the PD signal generator. The device can create a signal similar to the characteristic of actual corona/surface discharge/void PD which are different in terms of rising time, energy of signal, etc. In this experiment, the detected signals at the bushing end and neutral end were displayed on an oscilloscope. To eliminate the surrounding effect, the experiment was repeated four times for each clamp. Hence, 360 PD signals were injected to the transformer (three different kinds of PD signals 30 disks 4 times for each disk). The features of the signals were observed so that the most suitable feature for PD localization can be selected. Finally, the estimated location of PD, based on its features, was compared with the actual PD location. V. RESULTS AND DISCUSSION In this section, a case study on an actual power transformer is explained. The calibration line method was tested using two dif-
HOMAEI et al.: PD LOCALIZATION IN POWER TRANSFORMERS
Fig. 6. Recorded raw signals at the bushing end for injected corona pulse at disks 1, 21, and 51.
Fig. 7. Recorded raw signals at the neutral end for injected corona pulse at disks 1, 21, and 51.
2071
Fig. 8. Recorded raw signals at the bushing end for the injected surface pulse at disks 1, 21, and 51.
Fig. 9. Recorded raw signals at the neutral end for injected surface pulse at disks 1, 21, and 51.
ferent techniques: 1) orthogonal transform in combination with similarity and dissimilarity formula and 2) granular clustering. Since the calibration line method is not a reliable and comprehensive method, the proposed non linear-based method was applied. The results from the proposed method are presented in this section. A. Case Study PD signals were generated for different kinds of PDs and injected to the windings every 30 connections. Figs. 6–11 show the recorded raw signals in bushing and neutral ends due to the injection of different PD signals to disks number 1, 21, and 51. To make all of the signals comparable, they were normalized first. All signals were divided on the maximum value of itself. It can be seen from the following raw figures that the recorded signals consist of many data. To eliminate parallel information and reduce the number of samples, the signals need to be transformed first by applying orthogonal transforms to each signal. Since providing normalized signals for all of the recorded signals will make the manuscript lengthy, only normalized recorded signals at the neutral and bushing ends due to corona pulses injection into the winding disks no. 1, 21, and 51 are shown in Figs. 12 and 13, respectively. Distortions of the recorded signals depend on the distance in which the pulses traveled through the winding. From Figs. 12
Fig. 10. Recorded raw signals at the bushing end for the injected void pulse at disks 1, 21, and 51.
and 13, distortions of the recorded signal can be visually seen correlated with the distance between the disk and the detection point. Fig. 14 shows recorded signals after applying four different orthogonal transforms and obtain less but more valuable samples. As can be observed from Fig. 14, all of the orthogonal transforms, except for the Hadamard transform, were able to fully remove parallel information. Using KLT, DST, DCT, and
2072
Fig. 11. Recorded raw signals at the neutral end for injected void pulse at disks 1, 21, and 51.
IEEE TRANSACTIONS ON POWER DELIVERY, VOL. 29, NO. 5, OCTOBER 2014
Fig. 14. Transformed recorded signal for disk No.25; using Hadamard, Haar, DCT, KLT, and DST transform techniques.
TABLE I NUMBER OF DISKS SUCCESSFULLY LOCALIZED FROM THE RECORDED SIGNALS AT THE BUSHING END FOR CORONA DISCHARGE
Fig. 12. Recorded signals at the neutral end for injected corona at disks 1, 21, and 51.
TABLE II NUMBER OF DISKS SUCCESSFULLY LOCALIZED FROM THE RECORDED SIGNALS AT THE NEUTRAL END FOR CORONA DISCHARGE
B. PD Localization Using the Calibration Line Method Through Orthogonal Transforms
Fig. 13. Recorded signals at the bushing end for injected corona at disks 1, 21, and 51.
Haar transforms, the transformed signals damp within 100 samples, while the Hadamard transform needed 2000 samples. The ability of orthogonal transforms, which reduced the samples of the primary time vector signals to 100, is clear. The sample reduction did not occur for the Hadamard transform, but the transformed signal was produced faster than the other transforms. For KLT and Hadamard transforms, the number of samples must be , Here, 2048 was chosen because it covers high-valued samples, and analysis time can be shortened.
The analysis was first performed on the recorded signals with injected corona signals. Since the location of the injection as the corona signal is known, the combination of different orthogonal transfers with similarity and dissimilarity formula on recorded signals was tested if it can successfully localize the corona. The successfully localized disks were defined since the estimation of the location of PD injection points has an error of less than 20%. Tables I and II show the number of disks successfully localized from recorded signals at the neutral and bushing ends for corona discharge. The calibration method was used to calculate the location of the PD and localization error. The best localization features for corona discharge are shown by the highlighted cells in Tables I and II, that is, they localized the corona signals for more than half of the number of injection points (i.e., 30 points). From Table I, KLT and HADAMARD
HOMAEI et al.: PD LOCALIZATION IN POWER TRANSFORMERS
TABLE III NUMBER OF DISKS SUCCESSFULLY LOCALIZED FROM THE RECORDED SIGNALS AT THE NEUTRAL AND BUSHING ENDS FOR SURFACE DISCHARGE
transforms can be said to be the most successful transformation for corona signals localization when recorded at the bushing end. From Table II, DST, DCT, and HADAMARD transforms are regarded as successful transformations for corona-injected localization when recorded at the neutral end. From Tables I and II, the HAAR transform did not localize PD successfully. Thus, it was omitted from further analysis. Besides, among six different similarity and dissimilarity formulas, which were tested at this level, since similarity formula 16 and dissimilarity formula 12 were not successful in recording from the bushing and neutral ends, these two formulas were omitted for further analysis as well. The experiment was repeated for surface discharge. All procedures were similar to corona discharge, except surface discharge signals were injected into the winding. Table III shows the number of disks successfully localized from recorded signals at the neutral and bushing ends for surface discharge injection. The same as the previous test, the best localization features for surface discharge are shown by the highlighted cells in this table too. The results show that the transform methods, which successfully localized the number of disks for surface discharge injection and recorded in neutral and bushing ends, are the same as that of the corona discharge, although there are differences in corona and surface discharge signals. Since all four different similarity and dissimilarity formulas at this stage have shown successful behavior in their combination with at least one of the orthogonal transfers, none of them were omitted. However, since there was no successful result in using the Hadamard transform when the signal was recorded in the bushing, this transform was omitted for further analysis in the next stage. The same experiment was repeated for void discharge. Table IV shows the number of disks successfully localized from the recorded signals at the neutral and bushing ends for void discharge. From Table IV, the highest number of disks successfully localized is in the bushing-end recording for void discharge and obtained from the combination of KLT transform and dissimilarity formula no. 11 (with 3). Looking back at Tables I–IV, the best combination of orthogonal transfers with a similarity and dissimilarity formula that are suitable for all kinds of PD injection is from the result recorded in the bushing end from the KLT transfer with dissimilarity formula no. 11 and 3. The recorded signal from this combination was the most comprehensive and the method
2073
TABLE IV NUMBER OF DISKS SUCCESSFULLY LOCALIZED FROM RECORDED SIGNALS AT THE NEUTRAL AND BUSHING ENDS FOR VOID DISCHARGE
was “semi-successful” in localizing the PD with maximum accuracy. However, the highest number of successful localization with this combination for void discharge is 14 out of 30 (refers to Table IV) which means that maximum successful localization is less than 50%. Thus, this indicates that the method of combining orthogonal transfers with the similarity and dissimilarity formula is not very successful in localizing PD in the transformer winding for various kinds of discharge. C. PD Localization Using the Calibration Line Method Through the Granular Clustering Technique Since the previous method was not totally successful, localization of the PD was performed using the calibration line method through the granular clustering technique. In this technique, after recording the signals in bushing and neutral ends, they were normalized and, then, the respective granular were made using the granular clustering techniques. The generated granular showed a point in the space which can represent the entire signal’s feature. The distance between this point with the representative point of the recorded signal in bushing or neutral ends was considered as the estimated point of PD location by the granular clustering technique. Like previous tests, if this estimated location by granular clustering was in the 10% neighborhood radius of the actual location of the signal, the estimated localization was considered successful. The number of disks successfully localized from the recorded signals at the neutral and bushing ends using the calibration line method through the granular clustering technique are shown briefly in Table V. It can be seen that this method is reasonably good in PD localization, especially for corona discharge which was recorded in the bushing with 23 successful localizations out of 30. Looking back at sections B and C and all completed tests showed that the linear calibration method either by using orthogonal transform techniques and similarity formulas or using the granular clustering technique was not a reliable method and it was an incomprehensive method to localize the PD location. Thus, the aforementioned fact pushed the author to propose a new nonlinear technique. Creating the proposed nonlinear system was done by using MATLAB Neurofuzzy functions. The description is provided in the next section. D. Proposed Nonlinear-Based Technique for PD Localization As shown in the last two sections, using orthogonal transforms and similarity and dissimilarity formulas, the success rate
2074
IEEE TRANSACTIONS ON POWER DELIVERY, VOL. 29, NO. 5, OCTOBER 2014
TABLE V NUMBER OF DISKS SUCCESSFULLY LOCALIZED FROM RECORDED SIGNALS AT THE NEUTRAL AND BUSHING ENDS USING THE CALIBRATION LINE METHOD THROUGH THE GRANULAR CLUSTERING TECHNIQUE
TABLE VI FIRST EIGHT MOST SUCCESSFUL FEATURES IN LINEAR PD LOCALIZATION
Fig. 15. Flowchart of the proposed nonlinear-based PD localization system.
of PD localization can be seen low, by referring to Tables Ito IV. Although the granular clustering technique is better than the orthogonal transform in terms of the number of successful PD localizations, it can only be considered as a semisuccessful method. In this section, a new technique, which shows a better result than even granular clustering for PD localization, will be introduced. Since no specific linear relation between PD localization and two previous studied methods was found, the new technique offered was based on a nonlinear system. To avoid any bias and unsupervised technique, two neuro-Fuzzy functions that can generate a rules-based nonlinear system were chosen. In these systems, rules were created based on the relation between inputted data which are signals features and outputted data which are PD locations. Consequently, the neuro-fuzzy localization system has no bias. This is because neuro-fuzzy functions have a priority of calculation without any bias. The neuro-fuzzy systems were produced using two MATLAB functions. Then, the systems were trained and the system parameters were optimized via test feature vectors. The flowchart of the new technique is shown (Fig. 15). To create the 0 and 1 of the system, the first four signals out of 6 signals were generated, which were described in Section IV (measurement section). The signals, which were recorded in the same point where the injection was done, were representative of 0, and the signal which was recorded in the other side of the injection point represented 1. Thus, in this stage, there are two 0’s and two 1’s as the location for the system.
Based on Fig. 3, a feature vector should be produced for each of the previous four signals. A feature vector (FV) represents the recorded signals and feeds to the localization system. The FV has a structure for each disk as follows:
where Gclus is the granular clustering, and features 1 to 8 are the first eight most satisfying features that had a maximum number of successful linear localizations from Tables I– IV. The aforementioned nine elements of the feature vector were bolded and highlighted in red in Tables I–V. The characteristics of each feature in the aforementioned vector based on Tables I–V are given in Table VI again. In this paper, two standard MATLAB fuctions—genfis1 and genfis2—were used. The first function genfis1 generated a single-output Sugeno-type fuzzy inference system (FIS) using a grid partition on the data (no clustering) while the second function genfis2 generates a Sugeno-type FIS using subtractive clustering. Four signals, which are the same four signals recorded throughout different experiments, were injected four times into each disk and were injected repeatedly to create, train, and test the neuro-fuzzy system. After that, the feature vector was produced for each of the 30 other clamps. The results were 30 feature vectors (FV1 to FV 30), which were fed to the trained neuro-fuzzy system and 30 estimated PD locations obtained
HOMAEI et al.: PD LOCALIZATION IN POWER TRANSFORMERS
NUMBER
OF
TABLE VII SUCCESSFUL PD LOCALIZATIONS FOR EACH SYSTEM USING THE NEURO-FUZZY TECHNIQUE
2075
proposed method can be used to localize the PD for live transformers. Future work will consider the optimization of feature vectors, the development of neuro-fuzzy systems, the impact of transformer bushing on the signal waveform, and using the proposed method on multiple locations of PD occurring at the same time. REFERENCES
TABLE VIII COMPARISON BETWEEN MINIMUM AND MAXIMUM SUCCESSFUL LOCALIZATION ESTIMATION FOR DIFFERENT PD LOCALIZATION METHODS
from the neuro-fuzzy system’s output. The estimated PD locations from each neuro-fuzzy system were compared by the actual location of PD injection, and successful or unsuccessful localization was obtained. Table VII shows the number of successful PD localizations from each neuro-fuzzy system. The results show that the neurofuzzy system genfis2, which is based on subtractive clustering, is more reliable for PD localization. Table VIII summarizes the ability of successful localization for different PD localization methods. The minimum and maximum successful estimation of the proposed technique using the genfis2 neuro-fuzzy system was 73% (i.e., 22 successful localizations out of 30 disks) and 93% (i.e., 28 successful localizations out of 30 disks), respectively, which is a great improvement over the calibration method with a maximum successful localization of 76% (i.e., 23 successful localizations out of 30 disks), which is better than genfis1. VI. CONCLUSION A nonlinear neuro-fuzzy localization system that uses unsupervised pattern recognition was successfully proposed in this paper to localize PD in power transformers. From the test performed on an MV transformer winding in the laboratory, the results have shown a significant improvement in localizing PD for three types of PDs compared to the linear calibration method through orthogonal transforms or granular clustering. The proposed nonlinear method was based on a PD localization system whose rules were created based on the relation between inputted data which are signals features and outputted data, which are PD locations. Since the four signals, which are needed to create and train the proposed nonlinear-based method in this work, were injected or recorded at accessible bushing and neutral ends, the
[1] A. Akbari, P. Werle, H. Borsi, and E. Gockenbach, “Transfer functionbased partial discharge localization in power transformers: A feasibility study,” IEEE Elect. Insul. Mag., vol. 18, no. 5, pp. 22–32, Sep./Oct. 2002. [2] C. Bengtsson, “Status and trends in transformer monitoring,” IEEE Trans. Power Del., vol. 11, no. 3, pp. 1379–1384, Jul. 1996. [3] A. K. Lazarevich, “Partial discharge detection and localization in high voltage transformers using an optical acoustic sensor,” M.Sc. dissertation, Virginia Polytech. Inst. State Univ., Blacksburg, VA, USA, 2003. [4] J. Fuhr, “PD-source localization in the insulating system of large power transformers,” in Proc. IEEE Int. Symp. Elect. Insul. Conf. Rec., 2006, pp. 424–427. [5] P. Werle, A. Akbari, H. Borsi, and E. Gockenbach, “Localisation and evaluation of partial discharges on power transformers using sectional winding transfer functions,” in Proc. 12th Int. Symp. High Voltage Eng., Bangalore, India, 2001, pp. 856–859. [6] A. Akbari, P. Werle, H. Borsi, and E. Gockenbach, “High frequency transformer model for computation of sectional winding transfer functions used for partial discharge localization,” in Proc. 12th Int. Symp. High Voltage Eng., Bangalore, India, 2001, pp. 148–153. [7] D. Dey, B. Chatterjee, S. Chakravorti, and S. Munshi, “Cross-wavelet transform as a new paradigm for feature extraction from noisy partial discharge pulses,” IEEE Trans. Dielectr. Elect. Insul., vol. 17, no. 1, pp. 157–166, Feb. 2010. [8] E. Lemke and P. Schmiegel, “Progress in PD probe measuring technique,” in Proc. 7th Int. Symp. High Voltage Eng., 1991, pp. 43–46. [9] L. E. Lundgaard, “Partial discharge. XIV. Acoustic partial discharge detection-practical application,” IEEE Elect. Insul. Mag., vol. 8, no. 5, pp. 34–43, Sep./Oct. 1992. [10] A. M. Jafari and A. Akbari, “Partial discharge localization in transformer windings using multi-conductor transmission line model,” Elect. Power Syst. Res., vol. 78, pp. 1028–1037, 2008. [11] R. Schwarz, M. Muhr, and S. Pack, “Partial discharge detection in oil with optical methods,” in Proc. IEEE Int. Conf. Dielectr. Liquids, 2005, pp. 245–248. [12] A. Zargari and T. R. Blackburn, “Application of optical fibre sensor for partial discharge detection in high-voltage power equipment,” in Proc. IEEE Annu. Rep. Conf. Elect. Insul. Dielectr. Phenomena, 1996, vol. 2, pp. 541–544. [13] K. Jeongtae, K. Dong-uk, N. Gijin, C. Won, L. Youngjo, and K. Jayoon, “Partial discharge location using 2 sensors and optical fibers,” in Proc. Int. Conf. Condition Monitor. Diagnosis, 2012, pp. 126–129. [14] S. Biswas, C. Koley, B. Chatterjee, and S. Chakravorti, “A methodology for identification and localization of partial discharge sources using optical sensors,” IEEE Trans. Dielectr. Elect. Insul., vol. 19, no. 1, pp. 18–28, Feb. 2012. [15] M. S. Rao and B. E. Reddy, “Comparative analysis of pattern recognition methods: An overview,” Indian J. Comput. Sci. Eng., vol. 2, pp. 385–390, 2011. [16] S. Theodoridis and K. Koutroumbas, Pattern Recogn., 4th ed. London, U.K.: Academic Press/Elsevier, 2008. [17] M. Homaei, A. Mazhab Jafari, and A. Akbari, “Investigating suitable features for partial discharge localization in power transformer,” in Proc. Int. Conf. Condition Monitor. Diagnosis, 2008, pp. 923–926. [18] K. R. Rao and P. Yip, The Transform and Data Compression Handbook. Boca Raton, FL, USA: CRC, 2001. [19] H. Yingbo and L. Wanquan, “Generalized Karhunen-Loeve transform,” IEEE Signal Process. Lett., vol. 5, no. 6, pp. 141–142, Jun. 1998. [20] D. Wenzel, H. Borsi, and E. Gockenbach, “A new method of partial discharge localization on transformers via the Karhunen-Loeve-transform,” in Proc. 4th Int. Conf. Properties Appl. Dielectr. Mater., 1994, vol. 2, pp. 622–625. [21] V. Britanak, P. C. Yip, and K. R. Rao, Discrete Cosine and Sine Transforms; General Properties, Fast Algorithms and Integer Approximations. London, U.K.: Academic/Elsevier, 2006.
2076
[22] M. Hamidi and J. Pearl, “Comparison of the cosine and Fourier transforms of Markov-1 signals,” IEEE Trans. Acoust., Speech Signal Process., vol. ASSP-24, no. 5, pp. 428–429, Oct. 1976. [23] V. Sanchez, P. Garcia, A. M. Peinado, J. C. Segura, and A. J. Rubio, “Diagonalizing properties of the discrete cosine transforms,” IEEE Trans. Signal Process., vol. 43, no. 11, pp. 2631–2641, Nov. 1995. [24] C. Bajaj, J. Castrillon-Candas, V. Siddavanahalli, and Z. Xu, “Compressed representations of macromolecular structures and properties,” Structure, vol. 13, pp. 463–471, 2005. [25] Z. D. Wang, P. A. Crossley, K. J. Cornick, and D. H. Zhu, “An algorithm for partial discharge location in distribution power transformers,” in Proc. IEEE Power Eng. Soc. Winter Meeting, 2000, vol. 3, pp. 2217–2222.
Mohammad Homaei was born in Shiraz, Iran, in 1982. He received the B.Sc. and M.Sc. degrees in electrical engineering from K.N. Toosi University of Technology, Tehran, Iran, in 2005 and 2008, respectively. Since 2005, he has been a Professional Engineer working in industry. He has contributed widely to automation, protection and control design of highvoltage substations in Iran. Currently, he is a Project Manager with Peimann Khotoot Gostar Co., Tehran. His research interests are signal processing and diagnosis applications in power systems and electrical machines, reliability, and stability of power systems.
IEEE TRANSACTIONS ON POWER DELIVERY, VOL. 29, NO. 5, OCTOBER 2014
Seyed Mahdi Moosavian (S’10) was born in Shahrood, Iran, in 1982. He received the B.Sc. (Hons.) degree in electrical engineering from Chamran University of Ahwaz, Ahwaz, Iran, in 2003 and the M.Sc. degree in electrical engineering from the University of Malaya, Kuala Lumpur, Malaysia, in 2012. From 2003 to 2010, he was a Professional Engineer in the high-voltage and powerplant industries. Since 2010, he has been a Research Assistant with the University of Malaysia Power Energy Dedicated Advanced Centre (UMPEDAC), Kuala Lumpur. His research interests include planning and optimization in smart-grid power systems, high-voltage substations, electrical insulation, and control and protection of power systems.
Hazlee Azil Illias (M’10) was born in Kuala Lumpur, Malaysia, in 1983. He received the B.Sc. degree in electrical engineering from the University of Malaya, Kuala Lumpur, Malaysia, in 2006 and the Ph.D. degree in electrical engineering from the University of Southampton, Southampton, U.K., in 2011. Since 2011, he has been a Senior Lecturer with the University of Malaya. His main research interests include the modeling and measurement of partial-discharge phenomena in solid dielectric insulation and condition monitoring.