639(1): p. 57-66. 51. Avramescu, M.E., Z. Borneman, and M. Wessling, ...... large one corresponding to the low iso-electric point proteins in the egg white solution ...
PARTICLE LOADED MEMBRANE CHROMATOGRAPHY
Cover Het kleurenpalet dat je krijgt wanneer een zwarte oplosbare inkt uitvloeit op filtreerpapier. Dit proces heet chromatografie (= schrijven met kleuren). De tekeningen zijn membraanonderzoek/membraanprocessen, zoals gezien door Elske, Joost en Merlijn.
Zandrie Borneman Particle loaded membrane chromatography Ph.D. thesis, University of Twente, The Netherlands. ISBN 90-365-2433-4 © Z. Borneman, Enschede , The Netherlands, 2006. All rights reserved Printed by Wöhrmann Print Service, Zutphen
PARTICLE LOADED MEMBRANE CHROMATOGRAPHY
PROEFSCHRIFT
ter verkrijging van de graad van doctor aan de Universiteit Twente, op gezag van de rector magnificus, prof. dr. W.H.M. Zijm, volgens besluit van het College voor Promoties in het openbaar te verdedigen op woensdag 15 november 2006 om 15:00 uur
door Zandrie Borneman geboren op 15 december 1959 te Hardenberg
This dissertation has been approved by the promotor Prof. Dr.-Ing. M. Wessling
Voor Ans Merlijn, Joost en Elske
CONTENTS
CONTENTS CHAPTER 1 Introduction and background History Column chromatography Membrane chromatography New types of membrane chromatography supports Adsorptive membrane geometries Adsorptive modes Affinity membrane chromatography Metal chelate membrane chromatography Ion exchange chromatography Hydrophobic interaction membrane chromatography Size exclusion membrane chromatography Membrane chromatography applications Research aim and outline References
1 3 5 6 7 9 10 10 12 12 14 15 16 17 19
CHAPTER 2 Preparation of particle loaded adsorber membranes Abstract Background Particles in the membrane forming processes Experimental Materials Methods Mixed matrix preparation Viscosity measurement Electron Microscopy Particle solvent uptake and swelling Results & Discussion Viscosity measurements Particle solvent uptake and swelling Conclusions References
23 23 25 26 29 29 31 31 31 32 32 33 33 38 40 41
I
Contents
CHAPTER 3 Static adsorption capacity and accessibility of embedded particles Abstract Introduction Background Experimental Materials Methods Static adsorption capacity Labeling lysozyme for confocal microscopy Confocal laser scanning microscopy (CLSM) Scanning Electron Microscopy (SEM) Fiber preparation Results & Discussion Static adsorption capacity Influence of particle size Influence of particle loading Confocal Laser Scanning Microscopy Conclusions References
43 43 44 44 48 48 49 49 49 50 50 50 52 52 52 55 55 60 61
CHAPTER 4 Module design Abstract Introduction Background Adsorption Kinetics from incubation Characterization modes Dynamic binding capacity in a module Chromatographic figures of merit Experimental Materials Methods Incubation experiments Module production Winding tension and layout spacing Separation power of a module Dynamic binding capacity Results Winding tension Layout spacing Separation power of a module Dynamic adsorption rate
II
63 63 64 67 67 67 69 69 73 75 75 75 75 76 77 77 78 78 78 80 81 82
Contents
Conclusions References
84 85
CHAPTER 5 Development of new particle loaded adsorptive hollow fiber membranes for membrane chromatography applications Abstract Introduction Background Variation in wall thickness Variation in porosity Diffusion limitation Comparison beads and fibers Experimental Materials Methods Fiber preparation Scanning Electron Microscopy (SEM) Membrane porosity Static adsorption capacity Module preparation Dynamic adsorption capacity Lysozyme separation from crude egg white mixtures Results and discussion Fiber preparation Static adsorption Dynamic adsorption Optimal fiber length Protein desorption Mixed matrix hollow-fiber membranes for lysozyme separation Dynamic IgG adsorption Conclusions References
87 87 88 91 91 92 93 94 96 96 96 96 97 97 98 98 99 100 100 103 104 107 109 110 114 115 116
CHAPTER 6 Selective removal of polyphenols and brown color from apple juices using PES/PVP membranes in a single-ultrafiltration process Abstract Introduction Materials and methods Membrane materials Model solution Apple Juice
III
119 119 120 121 121 121 121
Contents
Membrane preparation Cryo-Scanning Electron Microscopy (cryo-SEM) Ultrafiltration Analysis of Total Polyphenols Color Results and discussion Membrane characterization Flux Cryo-SEM Model solutions Apple juice Regeneration Conclusions References
121 122 122 123 123 124 124 124 124 125 126 128 129 130
CHAPTER 7 Size exclusion Chromatography Abstract Introduction Background Chromatographic figures of merit Operational modes is size exclusion Possible fiber morphologies for SEC Experimental Materials Methods Fiber preparation Scanning Electron Microscope Module production Packed bed with Sephadex G25-C Liquid chromatography working station Permeability Group separation, desalting of BSA Determination of column void volumes and plate height Results and discussion Fiber preparation Module characteristics Permeability Resolution Plate height Void volume characterization Conclusions References
IV
131 131 132 133 133 137 139 141 141 142 142 143 143 143 143 144 145 145 146 146 147 147 148 149 150 152 153
Contents
Summary Samenvatting Dankwoord Curriculum Vitae List of publications
155 159 163 165 166
V
CHAPTER 1
INTRODUCTION AND BACKGROUND
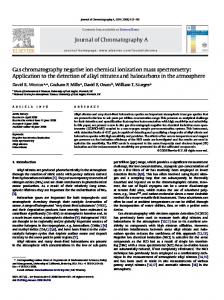
Life sciences and biotechnology are widely recognized as the next wave of knowledgebased industrial sectors creating new opportunities for our societies and economies. During the past years, the biopharmaceutical market has steadily increased to 45 billion USD in 2005 with an compound annual growth rate of 20% [1]. 100 90
monoclonal antibodies therapeutic proteins
80
US $ billion
70 60 50 40 30 20 10 0 1998 1999 2000 2001 2002 2003 2004 2005 2006 2007 2008 2009
Year
Figure 1.1 Compound annual growth of biopharmaceutical sales as reported by Wood Mackenzie in April 2005. Large scale separation and purification processes must be efficient as the costs of protein recovery dominate the total product manufacturing costs. In a typical protein production process from fermentation to final product, the recovery and separation steps accounts for 50 to 90 % of the total bio process costs [2]. Unfortunately, the current manufacturing concepts in this field are far from optimum with respect to economy and use of resources. The analysis of the market situation shows that the optimization of downstream processing for pharmaceutical products becomes more and more interesting mainly for the following reasons: ¾ The production costs of biologics are for a significant share related to downstream processing costs,
1
Chapter 1
¾ about 50% of product losses occurs during downstream processing among others because of non-optimized parameters, ¾ the total production costs for promising new drugs can only be decreased to a reasonable and economic level if the costs for downstream processing are low enough.
For protein harvesting many different routes can be distinguished. The most traditional one is precipitation followed by centrifugation and filtration. The main disadvantages of these techniques are that they only concentrate the proteins but not purify them, while in a lot of applications protein purification is essential. Only by applying chromatography techniques based on specific affinity it is possible to both concentrate and purify the end product. The need for fast separation processes to fulfill market requirements has driven the evolution of packed bed fillings during the last decades. The developments have focused on the restricted mass transfer in the stagnant mobile phase residing within the pores of the packing material. This causes a too long diffusional path for the sample molecules into and out of the pores. The most straightforward solution of reducing the diffusive path length is of course by reducing the particle size. This is suitable in analytical applications but not for large scale processes as further downscaling of porous particles requests operational pressures above the practical limits. Another route improving the chromatographic performance is increasing the particle pore diameter in order to minimize exclusion effects and to facilitate the diffusional processes. This strategy has been pursued for the separation of big molecules with low diffusion coefficients like proteins and DNA and this resulted in the commercialization of perfusion chromatography. Applying non-porous particles is a complete different approach for elimination of slow diffusional processes in chromatographic systems with the disadvantage that non-porous particles have a greatly diminished surface area. Sufficient adsorption capacity per unit of column volume can only be reached by applying very small particles, which brings up again the pressure drop problem. Another solution to solve the slow diffusional problems is the introduction of monoliths (also called continuous beds), which have emerged as an alternative to traditional packed bed columns since the late 80’s. Instead of the packed bed with porous particles, the monolithic column contains a continuous interconnected skeleton with through-pores for 2
Introduction and background
convective transport of liquids and solutes. Monoliths often have a bimodal pore size distribution that gives them a high internal surface area. Although the macro pores are of great importance for a high throughput they do not significantly contribute to the specific surface area. This mainly results from the pores smaller than 10nm, which are however not accessible for bigger proteins and DNA [3, 4]. Membrane chromatography (also referred to as membrane adsorbers) is another important development of the late 80’s. In membrane based processes the transport of solute molecules to the binding sites takes mainly place by convection. Since a typical membrane bed (including stacked flat sheet membranes as well as solid or hollow fibers) has a much larger cross-sectional area relative to the bed height, compared with packed bed columns, the pressure drop is drastically reduced. This results in higher flow rates and thus higher productivities. Short diffusional distances allow for an optimal utilization of the immobilized ligand situated on the pore walls. The disadvantage of these chemically activated microfiltration membranes, is their low BET area, and thus their low adsorption capacity. In this thesis we studied the development and performances of the particle loaded membranes (PLM’s) as an alternative to state of the art chromatographic techniques. Particle loaded membrane chromatography aims to combine the advantages of both small beads and convective media without bringing along the disadvantages of a high pressure drop or low capacity.
History In the pharmaceutical and biotechnological industry, the downstream processing of fermentation broths normally involves numerous steps for biomass removal and product purification (Figure 1.2). In the early days of biomolecule purification, the only practical method used for protein separation from complex mixtures was based on protein precipitation by water miscible organic solvents [5]. Alteration of the solvent properties by addition of neutral salts and/or organic solvents leads to the precipitation of the macromolecule due to differences in solubility. Alternative processes including adsorption techniques, gel filtration, liquid phase partitioning, electrophoretic methods and membrane technologies have lately been developed for protein purification. The adsorption techniques often result in purification steps with the greatest increase in protein purity.
3
Chapter 1
Therefore, they became widely employed especially when adopted in combination with chromatographic and membrane processes.
Capturing
Harvesting and clarification innoculum
diafiltration-UF concentration
fermentation
MF
centrifuge
capture step affinity chromatography
Purification chromatography
Polishing
virus- inactivation
HI-chromatography.
IEX-chromatography.
Formulation
diafiltration-UF
virus filtration
product
steril filtration
Figure 1.2 Schematic representation of a traditional packed bed chromatographic based process for the isolation and purification of monoclonal antibodies. Particle loaded membrane chromatography can replace the equivalent packed bed steps.
4
Introduction and background
Column chromatography Column chromatography is a well developed method applied in both capturing and polishing of biomolecules out of crude mixtures. Despite their large static adsorption capacity, the conventional stationary phases involved in chromatographic separations are generally not suitable for operating at high linear velocities of the mobile phase. The first chromatographic columns were realized in packed beds with approximately 100 µm beads. Their main drawback is the compression and compaction of the chromatographic bed at high velocities [6]. The pressure drop over the column is high, even for low flow rates and increases during the process time due to bed consolidation and plugging. For a given pressure drop across the bed, the throughput is inversely proportional to the bed height. Therefore other column configurations ranging from stacked (a number of short beds connected in series-parallel combinations) to radial flow arrangements (a short, wide bed curled up end-to-end upon itself) were investigated. For an efficient use of the adsorptive sites inside the chromatographic support a certain residence time, dependent on the particle, pore size and porosity is required. Shorter diffusion distances lead to faster allowable flows of the feed solution. This results in the development of chromatographic columns with smaller sized particles, with the drawback that smaller particles possess a higher flow resistance thereby creating a higher-pressure drop over the column using the same flow rate. The pressure drop in the conventional chromatographic columns using particles with a diameter of 2 µm is usually high, up to 25 MPa [7, 8]. The use of nonporous, rigid particles as chromatographic media can partially solve this problem. Furthermore, for non-porous supports, the ligands are located at the particle surface. Thus, the solute diffusion into the porous particles is no longer a limiting factor allowing for a much faster mass transfer [9]. Unfortunately, the use of non-porous supports usually causes lower protein binding capacities (due to the low binding surface), low reproducibility and high process costs [10, 11]. Micropellicular stationary phases, prepared by coating of a very thin sorbent layer onto the non-porous particle surface, also showed improved chromatographic characteristics [12]. In the last few decades, new types of stationary phases including perfusive and superporous beads were also investigated. The particles for perfusion chromatography have large, interconnected channels allowing the solute molecules to pass faster through the support at low backpressure. Moreover, the binding capacity for perfusive media is higher than for non-porous supports leading to a more efficient separation process [10, 13] 5
Chapter 1
Furthermore, since neither binding capacity nor flow rate is the limiting factor, the scaling up of a perfusive chromatographic column is relatively easy. A different approach of lowering the pressure drop present in classical packed beds is the development of chromatographic shallow adsorption columns with large cross-section. In fact, the ideal chromatographic column has an infinitely short bed height in order to minimize the operating pressure and maximize the throughput and an infinite width so that the ligand loading and the binding capacity are maximized. In recent years, hollow fiber membranes as affinity substrates in chromatographic separation processes have been proposed as an attractive alternative to porous beads (Figure 1.3).
Figure 1.3 Evolution of affinity column bed geometry: 1) Packed bed (100 µm beads); 2) Short “fat” bed (1 µm beads) and 3) Macroporous hollow fiber (pore size > 1 µm) Ideal characteristics of a medium for protein chromatography are: (i) high selectivity, (ii) high binding capacity, (iii) high mass transfer, (iv) low unspecific adsorption, (v) incompressibility, (vi) chemically stable immobilization of ligands, (vii) non-toxic leachables, (viii) high number of cycles (reusability), (ix) sanitation by alkaline conditions (only necessary for production of therapeutic proteins), and (x) inexpensive (cost effective). [14]. In this thesis, the latest developments in stationary phases based on particle loaded membrane adsorbers will be discussed.
Membrane chromatography In chromatographic separations based on membranes, compact porous disks, tubes or rods, the ligate-ligand interaction mainly takes place in the support through-pores rather than in the stagnant fluid inside the dead-end pores of the adsorbent particle as in the case of packed-bed chromatography. In membrane-based processes the transport of solute molecules to the corresponding binding sites takes place predominantly by convection, while diffusion is usually involved in the mass transport within the dead-end and small pores of the membrane. This minimizes some of the common limitations of classical 6
Introduction and background
chromatographic beds such as process time, channeling and intra-bed diffusion. Short diffusional distances allow optimal utilization of the immobilized ligand situated at the pore walls. Furthermore, ligand and product are, compared to packed columns, only for a short time exposed to the harsh elution conditions that occur during product off loading, which decreases possible denaturation. The adsorber membranes also offer the possibility to operate sterile, in good conditions of reproducibility [6, 15]. An additional advantage of membrane chromatography is their relative low production cost. This allows the development of disposable membrane adsorbers, which can be replaced when the desirable properties (mainly binding capacity, selectivity, permeability or cleaning costs) go below the efficiency value. Membrane chromatography proved to be a successful tool especially for separation of macromolecules. This is because the large size proteins cannot enter the small pores of the particles in packed bed columns, while in membrane-based processes they can freely flow through the macro pores of the membranes to the active sites located at the pore walls. Another major advantage of membrane chromatography is their relative easy packing and scale-up, which unfortunately has not been extensively investigated until now. One problem may nevertheless appear for membranes with large pore size distributions. A variance in porosity creates channeling in the membrane, which cause a preferentially flow of the solute molecules through the larger pores. This preferential flow will quickly saturate the adsorptive-sites located on large diameter pores. Subsequent flow through the adsorptive saturated large pores does not result in any further capturing of solute. Meanwhile, the residual capacity of the adsorber located in small pores, which exhibit high resistance to flow, is not complete utilized causing a lower dynamic binding capacity. Suen [16] reported that a variation of ±12 % in porosity can be responsible for a loss of 50 % in adsorption capacity at 10 % breakthrough point. For variations in the membrane thickness a three times less sensitive behavior was found.
New types of membrane chromatography supports Solid-phase extraction using particle-loaded porous sheets and particle-embedded porous fibers (mixed matrix membrane adsorbers) became a widely used laboratory technique to isolate and concentrate selected analytes prior to chromatographic processes [17, 18]. The incorporation into a porous polymeric membrane of functional particles such as silica and
7
Chapter 1
its derivatives (containing for example aliphatic functional groups), styrene/divinylbenzene based ion exchange resins or fibrous cellulose derivatives, results in adsorptive structures, which can be applied to isolate among others peptides and proteins from complex mixtures [19-21]. Most suitable particles display, in combination with the porous matrix morphology, rapid adsorption kinetics, a capacity and selectivity commensurate with the specific application and allow for fast desorption of the targeted molecule. The affinity of suitable adsorptive particles for specific molecules can be defined in terms of hydrophobic, hydrophilic, charged functionalities, molecular (imprinted) recognition, or other specific interactions. However, these materials differ from the classical affinity membranes since the binding process takes place at surface of small particles embedded in the porous matrix and not at the pore wall itself. Nevertheless they show hydrodynamic advantages similar to those of the adsorptive chromatographic membranes.
Monolithic stationary phases have emerged as an alternative to traditional packed bed columns since the late 1980’s, due to their easy preparation with good reproducibility, versatile surface chemistry, low backpressure and fast mass transport. They have similar advantages with membrane chromatography but differ from the classical membrane media in terms of material, preparation and morphology [22-24]. The monoliths are mainly prepared by in situ polymerization of organic precursors or silicon alkoxides and consolidation inside the column. Fusion of the porous packing material inside the column tubing by a sintering process has also been reported. The bed macroporous structure can be adjusted as a result of the polymerization conditions (ratio and concentration of monomer and cross-linker, temperature and presence of porogenic solvents). If necessary surface modification of the obtained porous matrix may be performed in order to improve the chromatographic binding selectivity and capacity. The monoliths usually posses a bimodal pore size distribution consisting of large micrometer-size through-pores (which allow the liquid to pass at high flow rates through the matrix under low pressure) and much smaller pores in the 10 nm range that contribute significantly to the overall surface area [25]. The continuous beds have a longitudinal dimension usually exceeding their lateral dimension. This brings the monoliths closer to the packed bed columns than to membrane chromatography. Nevertheless, they were recently successfully used for high-speed separation in reverse-phase, ion exchange, hydrophobic interaction or affinity modes especially for separation of biomolecules. 8
Introduction and background
Adsorptive membrane geometries Membrane chromatography can be performed in devices of various geometries. Macroporous adsorptive membranes and related systems such as single or stacked flatsheet membranes, hollow-fiber, spiral-wound and cassette devices are already commercially available. Ghosh [26] reported in a 2002 review that 75 % of the articles on membrane chromatography systems were based on flat sheets, 20 % on hollow fibers and 5 % on other configurations. The most popular commercial systems like Mustang from Pall and Sartobind from Sartorius make use of functionalized macroporous flat sheet membranes. The fibrils reinforced porous membranes are pleated (Pall) or layered (Sartorius) around a porous core. The feed is forced to permeate through the membranes in radial direction (perpendicular on the porous core). This approach results in high area to volume ratio. The membranes used by 3M and Mosaic Systems are different. Instead of functionalization of a porous support they make use of already-functionalized beads embedded in a porous matrix. In this concept the beads are responsible for the adsorption capacity and selectivity while the porous matrix controls the hydrodynamics. The 3M modules consist of stacked flat sheet or pleated membranes where as Mosaic Systems makes use of porous fibers in which the active particles are embedded. When thin flat sheet membranes are applied, the axial diffusion becomes more dominant and requires a lower linear flow rate through the matrix. Beside this the inhomogeneities in porosity and thickness negatively affect the performance of the system. To overcome this non-uniform flow behavior stacks of at least 30 membrane sheets are often used to average out the membrane heterogeneities [27]. By use of hollow fiber membranes the ideal module comprises short fibers with a wide bore to avoid a high pressure drop in the flow direction which would disturb the uniform radial flow pattern and creating channeling [28]. The membranes should also possess thick porous walls combining a narrow pore size distribution and a high ligand density. The hollow fiber modules can be operated in cross flow mode, which makes them especially suitable in the treatment of solutions containing particulate material.
9
Chapter 1
Adsorptive modes The operating interactions within the macroporous media involved in chromatographic separation processes are identical to those in the packed columns including affinity, ionexchange, reverse phase and hydrophobic interactions (Table 1.1).
Table 1.1
Different types of interactions involved in chromatographic separation processes.
Type of chromatography
Separation mode/Interaction type
Affinity chromatography
Molecular structure / Bio-specific adsorption
(Metal-) chelate chromatography
Metals complex formation / Coordination complex
Ion-exchange chromatography
Surface charge / Ionic binding
Normal / Reversed-phase chromatography
Hydrophobicity / Hydrophobic complex formation
Size-exclusion chromatography
Molecular size and shape / Size exclusion
Which type of functional group is immobilized on the porous membrane surface depends on the target compound and application. Several detailed reviews of the various applications of membranes in chromatographic separations have been published recently [15, 29-33].
Affinity membrane chromatography The affinity techniques are based on reversible bio-specific interactions between the protein and a specific ligand that result in a change of protein properties such that they can be separated from complex bio-molecules containing mixtures. The ligand molecules are immobilized on the porous surface of the embedded particles and the mixture containing the protein of interest is passed through the affinity membrane (Figure 1.4). A specific interaction takes place between ligand and ligate and retains the desired protein within the matrix support, while the other feed components pass freely through the adsorber. Affinity chromatography allows for purification of biopolymers based on biological functions rather than individual physical or the chemical properties. Isolation of a protein or a group of proteins such as J-globulin fractions, human serum albumin, and various clotting factors from body fluids was successfully achieved using affinity membrane chromatography. Immunoaffinity techniques were widely employed for the analyses and purification of proteins [34, 35]. Immobilized antibodies were used for example in industrial scale
10
Introduction and background
production of human interferon-ơ2a, interleukin-2 and interleukin-2 receptor while protein A and protein G were successfully employed in therapeutic applications including purification of human immunoglobulin G from plasma and serum [36, 37].
feed solutions impurities
ligate
membrane
ligand
permeate
flow direction
Figure 1.4 Principle of affinity membrane chromatography. Pseudoaffinity ligands such as dyes, lysine and histidine are nowadays well established in membrane chromatography. Cibacron Blue F3-GA dye membranes (having a specific binding for nicotinamide adenine dinucleotide dependent enzymes) were successfully employed in purification of several enzymes and human serum albumins from blood plasma [38, 39]. Kasper et al. [40] proposed an affinity-chromatographic method for a fast, semi-preparative isolation of recombinant Protein G from Escherichia coli. Rigid, macroporous affinity discs based on a GMA-co-EDMA polymer were used as chromatographic supports. Human immunoglobulin G was immobilized by a single-step reaction. The globular affinity ligands were located directly on the pore wall surface and were therefore freely accessible to the target molecules (Protein G) passing with the mobile phase through the pores. Examples of bioaffinity separations using monolithic stationary phases based on antigenantibody, enzyme-substrate, enzyme-inhibitor, receptor-ligand interactions were recently reviewed [41]. 11
Chapter 1
Metal chelate membrane chromatography Novel immobilized metal chelate membrane adsorbers (IMA-MA) were studied for potential use as stationary phases for protein separation. Protein adsorption on IMA-MA loaded with Cu(II), Ni(II), Zn(II) and Co(II) ions was compared as a function of the flowrate and the ionic strength of the elution buffer. An unique application for metal chelate purification is the separation of proteins differing by a single histidine molecule in their sequence using immobilized metal affinity chromatography [42].
Ion exchange chromatography Ion exchange is probably the most widely used chromatographic method for protein separation. Ion exchange materials were already used since biblical times to remove poisons and salts from water. The first scientific observation of the phenomenon was reported by John Thomas Way, an English agriculturists who described in 1850 the filtration of “liquid manure” through loamy soil [43]. By this treatment the manure was “deprived of color and smell by cation exchange with the calcium ions present in the soils. The principle of protein separation by ion exchange is the electrostatic interaction between the charges of the macromolecule and the adsorber surface. The protein must displace the counter ion of the exchanger and becomes attached on the sorbent’s surface. The amount of macromolecule bound per unit volume of adsorptive membrane can be very high. However, the binding capacity depends on the molecular size of the protein and the adsorption conditions (pH, ionic strength, protein concentration). Ion exchange membranes can be produced either by modification of commercially available microfiltration membranes or by embedding of IEX-resins into a polymeric porous matrix. Ion exchange membranes can be classified as anion or cation exchanger and both classes contain weak and strong varieties (Table 1.2). An ion exchange resin is an insoluble matrix normally in the form of small beads (1-2 mm diameter), fabricated from an organic polymer substrate. The surface of the resin possesses sites that easily trap and release ions.
12
Introduction and background
Table 1.2
Examples of functional groups for ion exchange resins. Type of exchanger
Strongly acidic / basic
Weak acidic / basic
cation (acidic)
sulfonic acid groups
carboxylic acid groups O
O R
S
OH
C R
OH
O
anion (basic)
trimethylammonium groups
amino groups
R1 R3
N+ R2
R1
R4
R3
N R2
Modern ion exchange materials are prepared from synthetic polymers such as styrenedivinylbenzene copolymers, which have been sulfonated to form strongly acidic cation exchangers or aminated to form strongly basic anion exchangers. Weakly basic anion exchangers are similar to the strong base except for the choice of amines. Weakly acidic cation exchangers are usually prepared from cross-linked acrylic copolymers. Non-crosslinked polymers are used only rarely because of their tendency to change dimensions depending on the ions bonded. Anion exchange membrane chromatography bearing mainly quaternary amino groups or diethylaminoethyl (DEAE) groups as ligands has been used for the separation of serum proteins, microbial proteins and enzymes, membrane proteins, cytokines or nucleic acids [38, 44-48]. BSA and HSA, ơ-chimotrypsinogen, lysozyme, trypsine inhibitor, cytochrom c, ovalbumin, ơ -lactoalbumin, conalbumin, ferritin, myoglobin, chymotrypsin, are just a few of the compounds isolated by anion exchange membrane chromatography. The implementation of a monolith-based convective interactive media with DEAE functionality into a large-scale plasmid DNA purification process was recently performed [4]. Cation exchange membranes are not as widely investigated as the anion exchange membranes they allow recovery of human recombinant antithrombin from cell culture supernatants, purification of monoclonal and polyclonal antibodies and isolation of immunofusion proteins produced extracellularly by Escherichia coli [49, 50]. The separation of similar size proteins such as serum albumin and hemoglobin using adsorber membranes loaded both with cation or anion exchange resins was recently reported [51]. Li et al. [52] have used a cation exchange monolith (prepared directly in a fused-silica tube by polymerization of an aqueous solution of monomers including the desired ligand), as 13
Chapter 1
chromatographic supports for separation of four standard proteins (cytochrom c, lysozyme, myoglobine from horse and whale). Saiful et al. [53] embedded ion-exchange resins in EVAL membranes for enzyme recovery. By use of these mixed matrix materials they obtained high adsorption capacities (63 mg lysozyme/ml membrane) while maintaining the biological activity of the lysozyme.
Hydrophobic interaction membrane chromatography Chromatographic protein separations based on hydrophobic interactions and reversed phase make use of the interaction between the aliphatic chains on the adsorbent and corresponding hydrophobic regions on the protein surface. Typical hydrophobic adsorbents commercially available include C4, C6, C8, or C10 linear aliphatic chains, possibly with a terminal amino group. The main problems in hydrophobic interaction chromatography are the slow association-dissociation processes and protein-protein interactions. Similar proteins can interact with each other as well as with the adsorbent leading to a large degree of overlapping between the elution components. Hydrophobic chromatography has not been used as frequent as ion exchange or affinity chromatography in protein separation since sharp separations are not achieved. Nevertheless, Ghosh [54] was able to fractionate human plasma proteins (HSA and HIgG) by hydrophobic interactions chromatography using macroporous polyvinylidine fluoride (PVDF) membranes having a 0.1µm pore size. At 1.5 M ammonium sulphate concentration only HIgG binds to the membrane while HSA did not show any interaction with the support. Chromatographic units with butyl ligands were used for the purification of the recombinant tumor necrosis factor [48]. Tennikova et al. [6] reported the separation of a protein mixture containing myoglobin, ovalbumin, lysozyme and chymotrypsinogen on monolithic columns with C4 or C8 ligands. Particle loaded membranes with embedded C8 hydrophobic adsorbents were intensively investigated for several drug separations. Tricyclic antidepressants, antiarrhythmic drugs, amiodarone and its metabolite desethylamiodarone, mexiletine and flecainide were extracted from serum using a 11 mm C8 membrane adsorber with recoveries ranging from 82 to 98% [17, 55]. Carbon-based PLM extraction disks were used for the removal and concentration of highly polar pesticides from water [56].
14
Introduction and background
Size exclusion membrane chromatography Until now, membrane materials have exclusively been used for interactive chromatographic modes and never for size exclusion chromatography, the only non-interactive mode of chromatography. Nevertheless stacked ultrafiltration membranes have been used to perform multistage ultrafiltration, which is analogous to size exclusion chromatography [57]. The development of rolled stationary phase modules from textile materials [58] constitutes the single interesting development of an alternative stationary phase for largescale SEC of proteins. The module looks similar to the Mosaic Systems coiled fiber bed concept. The largest porous volumes are located both in between the yarns (inter yarn) and the fibers that are bundled in the yarns (inter fiber) allowing a substantial inter fiber flow. It has also been hypothesized before that stacks of ultrafiltration membranes with large pores to overcome hydrodynamic drawbacks and smaller diffusive pores – ‘perfusion membranes’ – can perform ‘normal’ SEC [59].
15
Chapter 1
Membrane chromatography applications Table 1.3 represents a selection of membrane chromatographic applications out the different disciplines.
Table 1.3
Different applications in membrane chromatography
Ligand
Target protein
Geometry
Reference
Immonoaffinity ligand based membrane chromatography Human IgG
Protein G
Flat sheet
[40]
Monoclonal antibodies
Interferon D2a, interleukin-2 and interleukin-2 receptor
Hollow fiber
[34]
Protein A/G affinity based membrane chromatography Protein A
Human IgG
Flat sheet
[35]
Protein G
Human IgG
Flat sheet
[60]
Low molecular weight – dye based membrane chromatography Cibracron Blue F3-GA
BSA
Flat sheet
[38]
Tryptophan
IgG
Hollow fiber
[61]
Immobilized metal ions and polymeric ligands membrane chromatography Cu2+ immobilized metal ion
Cytochrom c, lysozyme
Flat sheet
[42]
Trypsin
Soybean trypsin inhibitor
Flat sheet
[62]
Ion exchanged membrane chromatography Strong cation (sulphonic)
Hemoglobin, lysozyme
Radial flow
[63]
Weak cation (carboxylic)
BSA
Flat sheet
[64]
Strong anion (quaternary ammonium)
Recombinant human monoclonal antibodies
Flat sheet
[65]
Weak anion ( DEA)
BSA
Hollow fiber
[66]
Hydrophobic interaction membrane chromatography Polyvinylidine fluoride PVDF
HSA - HIgG fractionating
Flat sheet
[54]
Carbon
Pesticides
Flat sheet
[56]
Structured fabrics
[58]
Size exclusion membrane chromatography BSA – NaCL desalting
16
Introduction and background
RESEARCH AIM AND OUTLINE The increasing demand for biologics requires extension of the current production facilities or more efficient processing. In particular separation and purification processes require better process concepts. Almost all large scale process configurations are based on packed bed chromatographic systems. The separation and purification processes are dictated by the hydrodynamics of these systems. In fact the minimal size of particles is dictated by the allowable hydrodynamic conditions. Current development programs are focusing on the restricted mass transfer in the stagnant mobile phase residing within the pores of the packing material. This causes a too long diffusional path for the sample molecules into and out the pores. That makes that the dynamic adsorption capacity of these packed bed systems strongly depends on the residence time (linear velocity) in the column. Adsorptive beads are in general bigger than 100 microns. For process intensification, i.e. much larger functionality in similar column or module volume one desires to use much smaller particles. This thesis describes a new technology allowing the application of smaller particles, without bringing along a high pressure drop and sensitivity for fouling and plugging as the disadvantages. The particles are immobilized in a porous matrix formed into different geometries such as solid and hollow fibers. The particles are responsible for the selectivity and adsorption capacity whereas the porous matrix controls the hydrodynamics of the system. We call these structures mixed matrix materials. The different geometries allow for organizing the particles into 3D superstructures. The superstructures can be adjusted for direct treatment of complex fermentation broths. Chapter 2 describes the membrane forming process in the presence of particles. In particular the influence of particles on viscosity and on the polymer dope composition will be clarified. In Chapter 3 we demonstrate that there are two routes to improve the adsorption capacity of the particle loaded membrane chromatographic systems (a) grinding of non-porous particles and (b) increasing of the particle load. The gain in grinding, for the target components, entirely accessible porous particles is a lower diffusional resistance, which benefits the process adsorption kinetics. In Chapter 4 we describe the coiled fiber module, a new type of membrane adsorber. We prove the flexibility of this concept by tailoring the module performance towards a high throughput or a high recovery by varying the layout spacing and winding tension. Moreover we try to predict the module 17
Chapter 1
performance based on single fiber incubation experiments. In Chapter 5 we present a new type of membrane adsorber: the particle loaded hollow fiber membrane adsorber. We prove that despite of all the criticisms reported in literature on hollow fiber membrane chromatography this is a viable concept. This is because the hollow fiber module has the highest frontal area per adsorber volume, is fully convective controlled and can be cleaned by back and forward flushing. Potential liquid flow maldistribution is compensated by connecting a minimum of 3 hollow fibers in series, which results in an optimal ligand utilization without product loss. The hollow fiber concept is positively validated on the isolation and concentration of lysozyme from crude fresh egg white solutions. In Chapter 6 a new route is described for the stabilization of apple juice. To avoid filtering aids ultrafiltration has gained importance in clarification of fruit juices. However fruit juices processed by ultrafiltration are not always stable during storage. Polyphenols, relatively small molecules have been found to be responsible. By combination of filtration and adsorption we were able to prepare stable apple juices. Chapter 7 finally describes the development of two new types of size exclusion stationary phases, for process scale desalting of proteins. It was found that the resolution of the newly developed stationary phases is somewhat lower, however the allowable throughput is higher than that of the commercial packed bed systems. The fiber concept is therefore of interest for large scale applications that only need partial removal or purification e.g. adjustment of ionic strength before an ion-exchange step or protein refolding.
18
Introduction and background
REFERENCES 1. 2. 3. 4. 5. 6. 7. 8. 9. 10. 11. 12. 13. 14. 15. 16. 17. 18. 19. 20. 21. 22. 23. 24. 25. 26.
MacKenzie, Compound annual growth rate of biopharmaceuticals. Market report, 2005. Kawai, T., K. Saito, and W. Lee, Protein binding to polymer brush, based on ion-exchange, hydrophobic, and affinity interactions. Journal of Chromatography B-Analytical Technologies in the Biomedical and Life Sciences, 2003. 790(1-2): p. 131-142. Merhar, M., et al., Methacrylate monoliths prepared from various hydrophobic and hydrophilic monomers - Structural and chromatographic characteristics. Journal of Separation Science, 2003. 26(3-4): p. 322-330. Bencina, M., A. Podgornik, and A. Strancar, Characterization of methacrylate monoliths for purification of DNA molecules. Journal of Separation Science, 2004. 27: p. 801-810. Scopes, R.K., Separation by adsorption: general principles. In: protein purification: Principles and Practice, ed. C.R. Cantor. 1994, New York: Springer -Verlag. 102-145. Tennikova, T.B., et al., High-Performance Membrane Chromatography of Proteins, a Novel Method of Protein Separation. Journal of Chromatography, 1991. 555(1-2): p. 97-107. Yang, Y.J. and M.L. Lee, Theoretical optimization of packed capillary column liquid chromatography using nonporous particles. Journal of Microcolumn Separations, 1999. 11(2): p. 131-140. MacNair, J.E., K.C. Lewis, and J.W. Jorgenson, Ultrahigh pressure reversed-phase liquid chromatography in packed capillary columns. Analytical Chemistry, 1997. 69(6): p. 983-989. Wirth, H.J., K.K. Unger, and M.T.W. Hearn, Investigations on the Relation Between the Ligand Density of Cibacron Blue Immobilized Porous and Nonporous Sorbents and Protein-Binding Capacities and Association Constants. Journal of Chromatography, 1991. 550(1-2): p. 383-395. Fulton, S.P., et al., Very High-Speed Separation of Proteins with a 20-µm Reversed-Phase Sorbent. Journal of Chromatography, 1991. 547(1-2): p. 452-456. Gemeiner, P., et al., Cellulose as a (bio)affinity carrier: properties, design and applications. Journal of Chromatography B, 1998. 715(1): p. 245-271. Huber, C.G., Micropellicular stationary phases for high-performance liquid chromatography of doublestranded DNA. Journal of Chromatography A, 1998. 806(1): p. 3-30. Afeyan, N.B., et al., Flow-through particles for the high-performance liquid chromatographic separation of biomolecules: perfusion chromatography. Journal of Chromatography A, 1990. 519(1): p. 1-29. Jungbauer, A., Chromatographic media for bioseparation. Journal of Chromatography A, 2005. 1065(1): p. 3-12. Zeng, X. and E. Ruckenstein, Membrane chromatography: preparation and applications to protein separation. Biotechnology Progress, 1999. 15(6): p. 1003-1019. Suen, S.Y. and M.R. Etzel, A mathematical analysis of affinity membrane bioseparations. Chemical Engineering Science, 1992. 47(6): p. 1355-1364. Lingeman, H. and S.J.F. Hoekstra-Oussoren, Particle-loaded membranes for sample concentration and/or clean-up in bioanalysis. Journal of Chromatography B: Biomedical Sciences and Applications, 1997. 689(1): p. 221-237. Lensmeyer, G.L., et al., Use of Particle-Loaded Membranes to Extract Steroids for High Performance Liquid Chromatographic Analyses Improved Analyte Stability and Detection. Journal of Chromatography A, 1995. 691(1-2): p. 239-246. Baxter International. Composite membranes and methods for making such membranes, Patent WO 00/02638. 1999. Millipore, Cast membrane for sample preparation, Patent US 6048457. 2000. Tokuyama-Soda-Kabushiki-Kaisha, Microporous shaped article and process for preparation therof, Patent US 5238735. 1993. Josic, D., A. Buchacher, and A. Jungbauer, Monoliths as stationary phases for separation of proteins and polynucleotides and enzymatic conversion. Journal of Chromatography B, 2001. 752(2): p. 191-205. Strancar, A., et al., Short Monolithic Columns as Stationary Phases for Biochromatography. Advances in Biochemical Engineering/Biotechnology (ISSN 0724-6145). 2002. p.49-85. Zou, H., et al., Monolithic stationary phases for liquid chromatography and capillary electrochromatography. Journal of Chromatography A, 2002. 954(1-2): p. 5-32. Leinweber, F.C., et al., Characterization of Silica-Based Monoliths with Bimodal Pore Size Distribution. Anal. Chem., 2002. 74(11): p. 2470-2477. Ghosh, R., Protein separation using membrane chromatography: opportunities and challenges. Journal of Chromatography A., 2002. 952: p. 13-27.
19
Chapter 1
27. Liu, H.C. and J.R. Fried, Breakthrough of lysozyme through an affinity membrane of cellulose-cibracron blue. AIChE Journal, 1994. 40(1): p. 40-49. 28. Klein, E., et al., Affinity adsorption devices prepared from microporous poly(amide) hollow fibers and sheet membranes. Journal of Membrane Science, 1997. 129: p. 31-46. 29. Charcosset, C., Purification of proteins by membrane chromatography. Journal of Chemical Technology and Biotechnology, 1998. 71(2): p. 95-110. 30. Klein, E., Affinity membranes: a 10-year review. Journal of Membrane Science, 2000. 179(1-2): p. 1-27. 31. Thömmes, J. and M.R. Kula, Membrane Chromatography - An Integrative Concept in the Downstream Processing of Proteins. Biotechnology Progress, 1995. 11(4): p. 357-367. 32. Roper, D.K. and E.N. Lightfoot, Separation of Biomolecules using Adsorptive Membranes. Journal of Chromatography A, 1995. 702(1-2): p. 3-26. 33. Zou, H., Q. Luo, and D. Zhou, Affinity membrane chromatography for the analysis and purification of proteins. Journal of Biochemical and Biophysical Methods, 2001. 49(1-3): p. 199- 240. 34. Nachman, M., Kinetic Aspects of Membrane-Based Immunoaffinity Chromatography. Journal of Chromatography, 1992. 597(1-2): p. 167-172. 35. Zhou, D., et al., Membrane Supports as the Stationary Phase in High-Performance Immunoaffinity Chromatography. Anal. Chem., 1999. 71: p. 115-118. 36. Bueno, S.M.A., K. Haupt, and M.A. Vijayalakshmi, In-Vitro Removal of Human-Igg by Pseudobiospecific Affinity Membrane Filtration on a Large-Scale - a Preliminary-Report. International Journal of Artificial Organs, 1995. 18(7): p. 392-398. 37. Castilho, L.R., W.D. Deckwer, and F.B. Anspach, Influence of matrix activation and polymer coating on the purification of human IgG with protein A affinity membranes. Journal of Membrane Science, 2000. 172(1-2): p. 269-277. 38. Briefs, K.G. and M.R. Kula, Fast Protein Chromatography on Analytical and Preparative Scale Using Modified Microporous Membranes. Chemical Engineering Science, 1992. 47(1): p. 141-149. 39. Champluvier, B. and M.R. Kula, Dye-Ligand Membranes as Selective Adsorbents for Rapid Purification of Enzymes - A Case-Study. Biotechnology And Bioengineering, 1992. 40(1): p. 33-40. 40. Kasper, C., et al., Fast isolation of protein receptors from streptococci G by means of macroporous affinity discs. Journal of Chromatography A, 1998. 798(1-2): p. 65-72. 41. Platonova, G.A. and T.B. Tennikova, Affinity processes realized on high-flow-through methacrylatebased macroporous monoliths. Journal of Chromatography A, 2005. 1065(1): p. 19-28. 42. Reif, O.W., et al., Immobilized Metal Affinity Membrane Adsorbers as Stationary Phases for Metal Interaction Protein Separation. Journal of Chromatography A, 1994. 664(1): p. 13-25. 43. Way, J.T., On the Power of Soils to absorb Manure. Journal of the Royal Agricaulture Society England, 1850. 11: p. 313. 44. Josic, D., et al., High-performance membrane chromatography of serum and plasma membrane proteins. Journal of Chromatography, 1992. 590(1): p. 59-76. 45. Reif, O.W. and R. Freitag, Characterization and Application of Strong Ion-Exchange Membrane Adsorbers as Stationary Phases in High-Performance Liquid-Chromatography of Proteins. Journal of Chromatography A, 1993. 654(1): p. 29-41. 46. Josic, D., et al., Application of high-performance membrane chromatography for separation of annexins from the plasma membranes of liver and isolation of monospecific polyclonal antibodies. Journal of Chromatography B: Biomedical Applications, 1994. 662(2): p. 217-226. 47. Krajnc, P., et al., Preparation and characterisation of poly(high internal phase emulsion) methacrylate monoliths and their application as separation media. Journal of Chromatography A, 2005. 1065(1): p. 69. 48. Luksa, J., et al., Purification of Human Tumor-Necrosis-Factor by Membrane Chromatography. Journal of Chromatography A, 1994. 661(1-2): p. 161-168. 49. Wang, W.K., et al., Membrane adsorber process development for the isolation of a recombinant immunofusion protein. Biopharm-the Technology & Business of Biopharmaceuticals, 1995. 8(5): p. 52. 50. Lutkemeyer, D., et al., Membrane chromatography for rapid purification of recombinant antithrombin III and monoclonal antibodies from cell culture supernatant. Journal of Chromatography, 1993. 639(1): p. 57-66. 51. Avramescu, M.E., Z. Borneman, and M. Wessling, Mixed-matrix membrane adsorbers for protein separation. Journal of Chromatography A, 2003. 1006(1-2): p. 171-183. 52. Li, Y.M., et al., Continuous Beds For Microchromatography - Cation-Exchange Chromatography. Analytical Biochemistry, 1994. 223(1): p. 153-158. 53. Saiful, Z. Borneman, and M. Wessling, Enzyme capturing and concentration with mixed matrix membrane adsorbers. Journal of Membrane Science, 2006. 280(1-2): p. 406-417.
20
Introduction and background
54. Ghosh, R., Fractionation of human plasma proteins by hydrophobic interaction membrane chromatography. Journal of Membrane Science, 2005. 260(1-2): p. 112-118. 55. Wells, D.A., G.L. Lensmeyer, and D.A. Wiebe, Particle-Loaded Membranes as an Alternative to Traditional Packed-Column Sorbents for Drug Extraction - in-Depth Comparative-Study. Journal of Chromatographic Science, 1995. 33(7): p. 386-392. 56. Bengtsson, S., et al., Solid-Phase Extraction of Pesticides from Surface-Water Using Disks, Bulk Sorbents and Supercritical-Fluid Extraction (Sfe). Pesticide Science, 1994. 41(1): p. 55-60. 57. Kurnik, R.T., et al., Buffer Exchange using Size-Exclusion Chromatography, Countercurrent Dialysis, and Tangential Flow Filtration - Models, Development, and Industrial Application. Biotechnology and Bioengineering, 1995. 45(2): p. 149-157. 58. Hamaker, K., et al., Transport properties of rolled, continuous stationary phase columns. Biotechnology Progress, 1998. 14(1): p. 21-30. 59. Prazeres, D.M.F., A theoretical analogy between multistage ultrafiltration and size-exclusion chromatography. Chemical Engineering Science, 1997. 52(6): p. 953-960. 60. Gupalova, T.V., et al., Quantitative investigation of the affinity properties of different recombinant forms of protein G by means of high-performance monolithic chromatography. Journal of Chromatography A, 2002. 949(1-2): p. 185-193. 61. Kim, M., K. Saito, and S. Furaki, Journal of Chromatography, 1991. 586: p. 27-33. 62. Guo, W., et al., Membrane Affinity-Chromatography Used For The Separation Of Trypsin-Inhibitor. Biomedical Chromatography, 1992. 6(2): p. 95-98. 63. Demmer, W. and D. Nussbaumer, Large-scale membrane adsorbers. Journal of Chromatography A, 1999. 852(1): p. 73-81. 64. Avramescu, M.E., et al., Preparation of mixed matrix adsorber membranes for protein recovery. Journal of Membrane Science, 2003. 218(1-2): p. 219-233. 65. Zhou, J.X. and T. Tressel, Basic concepts in Q membrane chromatography for large-scale antibody production. Biotechnology Progress, 2006. 22(2): p. 341-349. 66. Kubota, N., et al., Comparison of protein adsorption by anion-exchange interaction onto porous hollowfiber membrane and gel bead-packed bed. Journal of membrane Science, 1996. 117: p. 135 - 142.
21
22
CHAPTER 2
PREPARATION OF PARTICLE LOADED ADSORBER MEMBRANES
ABSTRACT This study presents the influence of particle dispersion in a polymer dope on the membrane forming process. Dispersion of ion-exchange particles, 50 % by weight, into a polyethersulfone polymer solution increases the viscosity. The higher the viscosity of the polymer solution, the more restricted is the non-solvent inflow into the polymer solution during the membrane forming process. A high viscosity of the polymer rich phase, also limits the growth of the polymer lean domains. Together with the higher mass flow resistance it results in a denser surface layer covering a porous sub layer containing a lot of small pores. The increase in viscosity changes the membrane morphology from an open structure with “fingerlike” cavities into a macroporous structure containing fine pores. The viscosity of the polymer solution containing dispersed glass flakes, with a very different width to height ratio, was much more shear thinning than that of more spherical particles. This can be explained by a more pronounced disentanglement of the polymer chains. The viscosity increase of a polymer solution by dispersion of ion-exchange particles can not only be contributed to the increase in solids but also to particle swelling thereby withdrawing solvent and non-solvents from the polymer dope. In this work we prove that the swelling is caused by selective non-solvent uptake thereby changing the composition ratio (solvent – non-solvent) in the dope solution. This change in composition stabilizes the polymer solution. Consequently the membrane forming process slows down resulting in excessive shrinkage of the future membrane and strengthening of the formation of macrovoids, which is unfavorable in membrane chromatography systems.
23
Chapter 2
Introduction Recently a lot of research is carried out to optimize the isolation and purification processes for the production of biologics. One of the most promising techniques is the membrane chromatography technology for which the target components are not separated and isolated by slow diffusion controlled processes but by fast convective flows [1]. Up to now, most of the reported work focuses on modification of existing macroporous membranes mainly by chemical modification and radiation grafting methods [2, 3]. Several articles regarding the preparation of membrane adsorbers by physical methods such as blending, mixing, and coating were recently published [4-6]. Particle-loaded membrane adsorbers (PLM’s) are used in membrane-extraction, a new development in the field of solid phase extraction (SPE) [4, 5, 7, 8]. The particle-loaded membrane adsorbers are mainly prepared by sintering of particles with substrates such as polytetrafluoroethylene, glass fibers, poly(vinyl chloride) or chelating membrane-based phases. The types of sorbents applied are silica, styrene and divinylbenzene copolymer, carbon and ion-exchange materials. The particles are preferably small in order to increase their active surface area and to improve their kinetics. An uniform packing allows high flow-rates without channeling problems. Another type of membrane chromatography, the resin-mixed membrane adsorber, is prepared by a phase inversion method. The functionality is incorporated by dispersion of active particles in a porous polymeric matrix. The polymer used should not interfere with the activity of the particles. Such membrane adsorbers can be prepared in different geometrics and can be operated either in stacks of flat membranes or as a bundle of hollow fiber membranes. According to this concept Avramescu et al. [9] have prepared the resin mixed EVAL (ethylvinylalcohol) based flat sheet membrane adsorbers with ion exchange functions showing a highly efficient protein purification. For traditional membrane formation processes there is a lot of information available e.g. as published by Smolders et al. [10]. Nonetheless there is hardly any knowledge until now about membrane formation processes in the presence of particles. For an efficient application of particle-loaded membranes it is important that after embedding, the particles do not show any reduced activity or accessibility with respect to the target molecules. This means that the particles should not be covered by the polymer or embedded in closed cells.
24
Preparation of particle loaded membranes
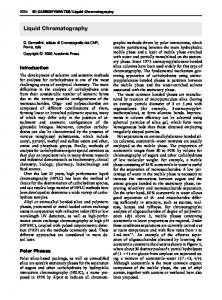
BACKGROUND Particle-loaded membranes can be prepared in different morphologies. Several types of configuration for membrane chromatography devices including flat-sheets, hollow fibers, spiral wounds, and polymer rods have been reported [1, 7-9, 11, 12]. Up to now, most of the work reported focuses on the chemical modification of existing macroporous membranes such as the commercially available products from Sartorius, (Sartobind) and Pall (Mustang). In traditional packed bed chromatographic separation processes, especially in the case of high molecular weight target molecules the interior of the packing does not contribute to the capacity in the capturing and polishing steps. Small particles however are fouling sensitive, and require high pressure drops over the column length as can be deduced from the Ergun equation applicable for incompressible media, which shows that the pressure drop over a column increases exponentially with the reduction in particle size [13]. When compressible beads like the popular Sepharose beads from GE-Healthcare are applied, the pressure drop over the column increases above a critical value more than exponential with the flow velocity. Using Sepharose 4FF beads with a particle diameter of 90 µm, a bed height of 15 cm the maximum linear flow velocity that can be applied is 200 cm/h. When higher flow rates are used bed compression takes place resulting in an exponential increase in flow resistances [14].
10 Bed heigth 15 cm
9
Pressure drop [bar]
8
Sepharose HP 34 µm
7 6 5
Mixed matrix module
4
containing the same beads
3 2 1 0 0
10
20
30
40
Flow rate [BV/h]
Figure 2.1 Pressure drop over a Sepharose HP packed bed, particle size 34 µm and a mixed matrix module containing the same beads as function of flow rate in bed volumes per hour.
25
Chapter 2
By using smaller (34 µm) and more rigid beads (Sepharose HP) the bed compression is less pronounced but even in this situation the pressure drop over the column increases rapidly when using flow rates above 200 cm/h (Figure 2.1). The advantage of particle loaded membrane adsorbers, as studied by Avramescu [9] in flat sheet and fibers and commercialized by Mosaic Systems in a coiled fiber configuration, is the combination of both a high flow rate and a high capacity. This can be established by entrapping of small functionalized particles in a macroporous membrane. The highly porous membrane structure has a low resistance against mass flow ensuring convective transport of the target molecules to the active binding sites. The small embedded particles cause a high adsorption/affinity area per unit of column volume. The embedding of particles in a macroporous matrix makes the column/module insensitive for possible bed compression, even when high flow rates are applied. Because the embedded particles are individually fixated in a three dimensional network, possible deformation of individual beads has no accumulating effect on the flow restriction.
Particles in the membrane forming processes Adding particles to polymers for the production of composite materials is a common process. In general these particles are referred to as fillers and are added to polymeric materials to enhance mechanical properties or to reduce the overall production costs. The fillers are normally cheap and are selected on basis of their unreactivity and compatibility with the polymer matrix. Typical particles with applications in protective clothing, car tires and protective garments for x-ray / electromagnetic shielding material are clays, talc, glass and carbon black. The addition of porous fillers is also known. They are normally added to enhance filtration or separation performance from gasses or liquids [15]. Another approach is to embed zeolite particles into a polymer to form a kind of immobilized adsorber e.g. the trapping of ammonia. Amerace Corporation filed a patent (US 4,102,746) regarding the immobilization of enzymes on filler materials dispersed through a binder material. Enzymes immobilized into a macroporous membrane have relatively high reaction efficiency when used to act on a substrate. In membrane chromatography processes using particles loaded membranes it is important that after embedding the particles are still accessible for the target compounds. This means that during the membrane formation process, the particles should not be coated by the 26
Preparation of particle loaded membranes
matrix forming polymer, entrapped in closed cells, deactivated by the use of solvents or applied physiological conditions. Figure 2.2 proves that this is not straightforward and that not all attempts to entrap particles in a macroporous structures are successful. A
B
C
Figure 2.2 SEM micrographs of attempts that were not successful. A) particles dissolved in the applied solvent, B) deactivated particles by a polymer coating and C) particles entrapped in closed cells.
Furthermore, by the use of porous beads, the polymer chains should not penetrate into the porous structure thereby diminishing the accessibility of the active sites in the interior of the beads. The matrix should have sufficient mechanical strength, inertness and a porous structure that allows convective flow. The pores of the hosting matrix, however should not be too big to prevent particle loss during the formation of the composite structure or during processing. In a simple membrane forming process usually 3 components are involved: polymer, solvent and non-solvent. For the membrane preparation a thin layer of polymer solution typical of about 300 µm is cast on a glass plate or extruded and immediately transferred into a non-solvent bath. Now the solvent exchanges with the non-solvent, which result in an increase of the non-solvent concentration in the polymer solution. The polymer solution becomes instable and phase separates in a polymer rich phase, which solidifies and forms the polymer skeleton and a polymer lean phase that forms the pores of the membrane to 27
Chapter 2
be (Figure 2.3). Ternary systems are always characterized by a liquid – liquid demixing gap (non-stable region). The boundary between the stable and non-stable area is called binodal. The dashed lines are the tielines, a composition situated on the tieline splits-up in the two liquid phases connected by the tieline and situated on the binodal. Nucleation of the polymer lean phase (membrane formation) starts when the non-stable area is entered, this takes place after immersing the polymer solution into a non-solvent bath. polymer binodal
gel
stable soluton
tieline
composition path initial composition
non-stable solution
solvent
non-solvent
Figure 2.3 Schematic representation of a ternary phase diagram. The porous matrix structure is formed when the composition of a polymer solution changes from the stable region into the non-stable region.
The inflow of non-solvent and solvent into the polymer lean domains results into domain growing, pushing away the polymer rich phase. The polymer concentration in the polymer rich phase becomes higher and gelation takes place. Coalescence of the polymer lean domains before solidification leads to the formation of an open porous structure [16]. In the case of particle loaded membrane formation, the viscosity of the dope solution is attributed not only to temperature, molecular weight and polymer concentration but also to the type, size and amount of particles dispersed in the solution. In this chapter we will focus on the effect of particles in the membrane forming process. Special attention will be paid to the influence of particles on the dope viscosity and on the composition change in the dope by selective uptake of solvents and non-solvents, which strongly affects the membrane formation. A minimum total solids (matrix polymer + particles) content is required to allow efficient casting or extruding and for obtaining membranes with sufficient mechanical strength.
28
Preparation of particle loaded membranes
EXPERIMENTAL Materials Polyethersulfone (PES, Ultrason E6020P), kindly supplied by BASF-Nederland, was used as a matrix forming polymer. PES is a slightly hydrophilic engineering plastic with a molecular weight (Mw) of 50 kDa that is commonly used in membrane production. Polyvinylpyrrolidones (PVP’s, Fluka) with different molecular weights (K15, K30 and K90), polyethylene glycol (PEG400, Merck) and demineralized water were used as additives in the membrane preparation. N-methylpyrrolidone (NMP 99 % purity, Acros Organics) was employed as solvent. Lewatit cationic exchange resins (CER) CNP80WS (a weak acidic, macroporous, acrylic-based cationic exchange resin) and MonoPlus SP112WS (a strong acidic, macroporous polystyrene based cationic exchange resin) were kindly supplied by Caldic, Belgium and used as filler materials. The particles were milled and air classified till fractions with an average particle size of about 7 µm were obtained. Glass flakes with a particle size below 15 µm and glass powder beads finer than 50 µm obtained from Kremer Pigmente in Germany were used for comparison. Table 2.1
Particles characteristics
Particle type
CNP80
SP112
Flakes
Beads
Core material Active group Density Water retention IEX capacity Particle size
polyacrylate -COO1.19 48 4.3 7.4
styrene divinylbenzene -SO31.24 54 1.7 7.9
glass -
glass
0.87
Adsorption capacity [mg LZ/g particle]
1000
100
10
1 0.001
0.01
0.1
1
10
2
External particle surface [m /g]
Figure 3.6 LZ adsorption capacities of different size classes. Starting solution 3.5 mg LZ/ml in 10 mM phosphate buffer.
Figure 3.7 Field emission electron micrograph of a milled CNP80 particle. Magnification X100.000; the size bar indicates 100 nm. Clearly visible are the voids originating from collapsed big pores.
54
Static adsorption capacity and accessibility of embedded particles
Influence of particle loading Another route to improve the adsorption capacity of mixed matrix membrane adsorbers is increasing the particle load. Figure 3.8 shows that the BSA adsorption capacity for the prepared adsorptive membranes scales with the particle load. The intercept is amounted to 3.30 mg BSA/g fiber, indicating that the matrix polymer shows a little background sorption. By correcting the adsorption data for this non-specific protein adsorption of the matrix, the BSA adsorption capacity over the whole range 10 – 85 wt% amounts 111 ± 2 mg BSA/g resin. This proves that the embedded resins are in all cases completely accessible for the BSA molecules.
LZ adsorption [mg/g fiber]
120 100 80 60 40 20 0 0
10
20
30
40
50
60
70
80
90
100
IEX-loading [wt %]
Figure 3.8 BSA adsorption capacities of membrane adsorbers with different CNP80 loadings. The adsorption data are calculated from the 24h desorption measurement.
The maximal allowable particle load depends on the polymer solution “tear stress” needed for fiber spinning, the mechanical strength required for module assembling and the robustness of the fiber in the handling process steps. The adsorptive fibers containing 50 - 65 wt % particle loading have normally sufficient mechanical strength to be used in module assembling.
Confocal Laser Scanning Microscopy Confocal microscopy offers the possibility to study the presence and the local distribution of fluorescent labeled components [21]. In the present work we make use of this ability by rhodamine, a cationic fluorescence label, adsorption onto carboxylic functionalized CNP80 particles that are entrapped in a PES based macroporous structure. Since the focus depth 55
Chapter 3
of confocal laser microscopy is limited and it elucidates only the fluorescence labeled areas, SEM is used to visualize the entire morphology (Figure 3.9). Nevertheless, the agreement between the pictures is apparent. Although the rhodamine based CSLM suggest that all particles are well accessible, it is still important to know whether the particles are also accessible for protein adsorption after embedding.
Figure 3.9 Left a CLSM image of CNP80 particles embedded in a polysulphone matrix. The micrograph shows rhodamine to be bound selectively to the embedded particles. Right the accompanying SEM image to visualize the morphology of the macroporous structure.
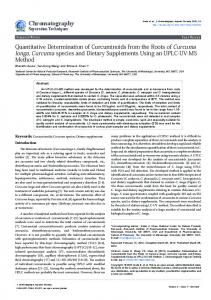
To measure the static adsorption capacity of LZ for the CNP80 containing fibers, the fibers were immersed up to 24 h into a LZ solution (1mg/ml), pH 7.4 at room temperature. At different times some fibers were removed from the solution and examined with CSLM. The amount of protein adsorbed into the particle loaded membranes is presented in Figure 3.10 as a function of adsorption time. It can be observed that the LZ adsorbed into the fibers reached values of 35 mg/ml membrane within 24 h. The green area, which corresponds to adsorbed LZ in the fiber, is in rather good agreement with the fractional adsorption of the adsorption isotherm. Further we can conclude from these micrographs that all embedded particles, also the centrally located particles, are accessible for LZ molecules. Figure 3.10 may suggest that the penetration of LZ into the fiber is very heterogeneous. However the fact that the profile is not progressing concentrically has to do with the limited focus depth (below 1 micron) of confocal microscopy. A variation in the fractured 56
Static adsorption capacity and accessibility of embedded particles
surfaces goes along with height differences causing that the adsorbed LZ above and under the focus point is not visible. However, in the end at about 1400 minutes the particle structure cannot be resolved anymore due to the intense luminescence of high adsorption values.
LZ adsorption [mg/ml fiber]
40
30
20
10
0 0
100
200
300
400
1400
adsorption time [min]
Zoom 200 µm
Figure 3.10 LZ adsorption isotherm and CLSM images to visualize the LZ penetration in CNP80 containing fibers. The fiber diameter is 550 µm. All micrographs are made with the same pinhole and intensity. The zoom 200 µm shows individual resins occupied by labeled LZ molecules. Another reason that the concentration profile is not concentrically has to do with the start-up of the experiment. The adsorption experiment starts with the immersion of a dry 57
Chapter 3
fiber into the LZ solution. The dry fiber soaks its own volume with LZ solution, when the fiber has some heterogeneity in porosity the big pores, with the lowest flow resistance serve as supply channels. The adsorbing sides located at these channels are initially binding small quantities of LZ. In the zoomed picture one observes a completely fluorescent outside whereas the inside shows a grainy fluorescent pattern. The high adsorption values of labeled LZ at the outside causes very intense fluorescence to the extent that the single adsorption particles cannot be distinguished. Only at lower concentrations deeper inside the fiber the fluorescent patterns becomes grainy (see zoom 200 µm), representing the adsorption of LZ on the particles. This data are in agreement with experiments carried out by Hubbuch [21], who followed the adsorption of fluorescent labeled BSA in SP Sepharose FF beads by CLSM. He also found, on single beads level, a good agreement between the adsorption isotherm and the penetration depth of the proteins. Next to the non-porous beads, based on milled IEX-particles, we also prepared particle loaded membranes based on porous gel-type particles, which allow bulk adsorption into the particles. Since such beads are optically transparent it is possible to study the interior of individual beads without bead fracturing.
Figure 3.11 Confocal scanning microscopy height images, Z-stack, of a SP Sepharose bead after LZ adsorption. Especially from the 10.57 µm depth image can be deduced that the LZ penetrates to the centre of the bead. Scan areas 50 x 50 µm2
58
Static adsorption capacity and accessibility of embedded particles
Figure 3.11 represents the height images (Z-stack) of a SP Sepharose bead that was submerged in a FITC labeled LZ solution for 16 hours. From the luminescent crosssections we can deduce that the entire interior of the beads is accessible for LZ molecules. Figure 3.12 shows a cross-section of a polyethersulphone-based fiber with entrapped SP Sepharose beads both in confocal and SEM mode. The SEM micrograph shows clearly that some beads are fractured during the sample preparation. The CLSM image suggests that LZ occupies the surface of the beads whereas the interior does not contain yet any LZ. However, this is an interpretation based on the low depth resolution. The fractured bead located in the centre of the image is a proof that both the LZ intrusion into the fiber as well as the protein penetration in the Sepharose bead can be visualized by CLSM. It also proofs that, PES, the matrix material does not show significant background /non-selective adsorption, which is in agreement with the influence of particle loading experiments.
Figure 3.12 Left a CLSM-image of the SP Sepharose beads embedded in a polyethersulphone matrix. The picture illustrates that, rhodamine, the staining component, has reached the outer surface of the particles. A high fluorescence intensity at the outer layer of a fractured particle indicates that the adsorption capacity in the interior of the particles is not yet completely utilized. Scan area 108 x 108 µm2.
The ultimate support design results from a compromise between kinetics and capacity. The use of non-porous supports leads to rapid kinetics. However, surface area to volume considerations dictate small particle diameters if reasonable capacity is to be achieved. Within packed bed systems this results in high pressure drops, which are usually unsuitable in large scale processes. However, in particle loaded membrane systems not the particles 59
Chapter 3
but the membrane structure determines the flow resistance and thus the pressure drop over the module. Porous agarose based “gel type” beads offer much higher capacities, but at the expense of slower binding kinetics. In addition the open structures of many porous materials further limits their mechanical stability applying additional constraints on the pressure drop achievable in packed bed operation. By embedding small “gel type” beads in porous convective controlled membranes one can benefit from the reduced diffusion resistance of the small sized beads and make use of the excellent hydrodynamic performance of the membranes.
CONCLUSIONS This chapter demonstrates that there are two routes to improve the protein adsorption capacity of particle loaded membranes (a) grinding of non-porous particles to increase the external surface area and (b) increasing the particle load in the membrane adsorber. We proved that the protein adsorption capacity scales with the external surface over volume ratio, which is inverse proportional with the particle diameter. By particle size reduction we were able to increase the lysozyme adsorption capacity with more than 2 orders of magnitude. By increasing the CNP80 particle load up to 85 wt%, the BSA adsorption capacity increases from 3.3 to 95 mg/gram membrane. When expressed in mg BSA per unit of CNP80 weight, the adsorption capacity stays constant at about 111 mg/g particle. It is important to mention that after grinding and embedding the particles maintain their functionality and accessibility for the target compounds. This is also proven by confocal laser microscopy measurements, a powerful technique for visualizing the accessibility of the particles inside the matrix. Unfortunately, the CNP80 resins are not optical transparent therefore only the adsorbed lysozyme at the external surface area can be visualized. By using the optical transparent Sepharose beads also the interior of the beads can be monitored. A disadvantage of the CLSM is the limited focus depth, causing problems for studying cross sections with some height differences. Electron Microscopy, which has an far larger focus depth, is a good additional technique to elucidate the three dimensional morphology of the cross samples.
60
Static adsorption capacity and accessibility of embedded particles
REFERENCES 1.Brandt, S., et al., Membrane-Based Affinity Technology for Commercial Scale Purifications. BioTechnology, 1988. 6(7): p. 779-782. 2.Manganaro, J.L. and B.S. Goldberg, Protein purification with novel porous sheets containing derivatized cellulose. Biotechnology Progress, 1993. 9(3): p. 285-290. 3.Markell, C., D.F. Hagen, and V.A. Bunnelle, New Technologies in Solid-Phase Extraction. LC-GC Magazine of Separation Science, 1991. 9(5): p. 332-337. 4.Jungbauer, A., Chromatographic media for bioseparation. Journal of Chromatography A, 2005. 1065(1): p. 3-12. 5.Ergun, S., Fluid flow through packed columns. Chemical Engineering Progress, 1952. 48(2): p. 89-94. 6.Gemeiner, P., et al., Cellulose as a (bio)affinity carrier: properties, design and applications. Journal of Chromatography B, 1998. 715(1): p. 245-271. 7.Stickel, J.J. and A. Fotopoulos, Pressure-flow relationships for packed beds of compressible chromatography media at laboratory and production scale. Biotechnology Progress, 2001. 17(4): p. 744751. 8.Amatschek, K., et al., Affinity chromatography of human blood coagulation factor VIII on monoliths with peptides from a combinatorial library. Journal of Separation Science, 2000. 23(1): p. 47-58. 9.Anspach, F.B., et al., High-performance liquid chromatography of amino acids, peptides and proteins: XCV. Thermodynamic and kinetic investigations on rigid and soft affinity gels with varying particle and pore sizes: Comparison of thermodynamic parameters and the adsorption behaviour of proteins evaluated from bath and frontal analysis experiments. Journal of Chromatography A, 1990. 499: p. 103124. 10.Merhar, M., et al., Methacrylate monoliths prepared from various hydrophobic and hydrophilic monomers - Structural and chromatographic characteristics. Journal of Separation Science, 2003. 26(3-4): p. 322-330. 11.Podgornik, A., et al., Large-scale methacrylate monolithic columns: design and properties. Journal of Biochemical and Biophysical Methods, 2004. 60(3): p. 179-189. 12.Hagen, D.F., et al., Membrane Approach to Solid-Phase Extractions. Analytica Chimica Acta, 1990. 236(1): p. 157-164. 13.Avramescu, M.E., et al., Preparation of mixed matrix adsorber membranes for protein recovery. Journal of Membrane Science, 2003. 218(1-2): p. 219-233. 14.Charcosset, C., Purification of proteins by membrane chromatography. Journal of Chemical Technology and Biotechnology, 1998. 71(2): p. 95-110. 15.Ghosh, R., Protein separation using membrane chromatography: opportunities and challenges. Journal of Chromatography A, 2002. 952: p. 13-27. 16.Klein, E., Affinity membranes: a 10-year review. Journal of Membrane Science, 2000. 179(1-2): p. 1-27. 17.Lingeman, H. and S.J.F. Hoekstra-Oussoren, Particle-loaded membranes for sample concentration and/or clean-up in bioanalysis. Journal of Chromatography B: Biomedical Sciences and Applications, 1997. 689(1): p. 221-237. 18.Wells, D.A., G.L. Lensmeyer, and D.A. Wiebe, Particle-Loaded Membranes as an Alternative to Traditional Packed-Column Sorbents for Drug Extraction - in-Depth Comparative-Study. Journal of Chromatographic Science, 1995. 33(7): p. 386-392. 19.Zou, H., Q. Luo, and D. Zhou, Affinity membrane chromatography for the analysis and purification of proteins. Journal of Biochemical and Biophysical Methods, 2001. 49(1-3): p. 199- 240. 20.Linden, T., et al., Visualizing patterns of protein uptake to porous media using confocal scanning laser microscopy. Separation Science and Technology, 2002. 37(1): p. 1-32. 21.Hubbuch, J., et al., Dynamics of protein uptake within the adsorbent particle during packed bed chromatography. Biotechnology and Bioengineering, 2002. 80(4): p. 359-368.
61
62
CHAPTER 4
MODULE DESIGN
ABSTRACT In this chapter we report a new type of particle loaded membrane adsorber. The adsorber module is prepared by coiling of adsorptive fibers. To characterize the material and to predict the module performance single fibers are tested in incubation experiments for protein accessibility and mass flux. Layout spacing and the winding tension are useful parameter to tailor the module for stabilization, polishing or pharmaceutical applications. Decreasing the distance between two adjacent fibers during the coiling process affects both the flow resistance and the dynamic adsorption capacity of the module. A higher flow resistance creates a higher convective flow through the fibers resulting in faster adsorption processes. By exerting a high winding tension fiber deformation takes place resulting in modules with a high packing density. The feed flow is now to a greater extent forced through the fibers thereby reducing the diffusive distance to the active sites located in the interior of the fiber, which results in steeper breakthrough curves and a better ligand utilization.
63
Chapter 4
INTRODUCTION Chromatography is undoubtedly the workhorse of downstream processes, affording high resolution for bioseparations. At the same time, it has the notoriety of being the single largest cost center in downstream processing and of being a low-throughput operation. Consequently, ‘chromatographic alternatives’ are an attractive proposition, even if only a reduction in the extent of use of packed beds can be realized [1]. This motive elucidates why a lot of research is focused on chromatographic systems that are highly convective controlled, operate at low pressure, have a low fouling and plugging sensitivity, maintain a constant bed quality and posses a high dynamic capacity. In the separation and purification steps by the production of biologics, the manufacturers are facing two critical parameters: adsorption capacity and flow uniformity. The main disadvantages of chromatographic columns, especially when using gel type resins, are nonuniformity of flow, bed compression and slow diffusion rates. Depending on how a column is packed, flow paths and therefore flow rates can vary in different parts of a column, resulting in different adsorption and desorption rates. In a “worst case” scenario one part of a column may be saturated with the target molecule, while other parts of the column may still have free binding sites, resulting in product binding and breakthrough occurring simultaneously, destroying the resolving power of the column [2]. Monoliths Because of a significantly reduced mass transfer resistance monoliths can be operated at much higher mobile phase flow rates than packed bed systems with minimal loss in resolution. Scaling-up of monoliths is hampered by the difficulty in preparing high volume monoliths with uniform pore structure, owing to the exothermic nature of the polymerization reaction. This problem was circumvented by the preparation of tubular monoliths. Till now the biggest available modules are 800 ml [1, 3]. The 1 to 5 µm big pores of the monoliths have the advantage of a low flow resistance however these big pores are accompanied by a low active surface area and thus a low adsorption capacity. Expanded bed adsorption In an expanded bed, a particulate adsorbent in a column is allowed to rise from its settled state by applying an upward flow. This increases space between the adsorbent particle,
64
Module design
allowing cells and cell debris to flow through without blocking the bed. Usually the size of the adsorbents for expanded bed range from 50-400 µm. Smaller beads give overexpansion even at low flow rates while bigger beads require very high flow velocities to sufficiently expand the bed. In both situations the productivity of the bed is low due to low flow rates or due to restricted diffusion into the beads. Another serious problem is back-mixing, which decreases the efficiency of the adsorption process. Till now expanded beds were not able to meet the requirements of the biopharmaceutical industry in terms of productivity and hygiene [4]. Membrane chromatography Membrane chromatography with chemically functionalized microfiltration membranes has shown to be a very attractive alternative for packed bed systems containing large particles. The dynamic capacities are at least one order of magnitude higher than that of traditional packed bed chromatography. For small target molecules this advantage is however less pronounced. The benefits of adsorptive membranes are the absence of long diffusion times that often occur in packed bed chromatography. A second feature of a typical membrane bed is the large cross sectional area relative to the bed length, which allows high velocities and large volumetric capacities. A large diameter to length ratio, however, introduces the challenge of achieving uniform flow distribution across the membrane. Flow maldistribution can reduce the membrane efficiency to the level of packed bed [5]. Particle loaded membrane chromatography The advantage of the particle loaded membrane (PLM) adsorbers over packed bed systems and chemically functionalized membrane adsorbers for protein applications is the combination of both a high flow rate and a high capacity. This originates from the fact that macroporous membranes, when compared to chromatographic beads, have a very low flow resistance. The big pores in the membrane structure ensure convective transport of the target molecules to the active binding sites located on the surface of the embedded particles. Meanwhile, the use of small particles creates a high adsorption/affinity area per unit of column volume. The embedding of particles in a macroporous matrix makes the column insensitive for possible particle deformation [6]. In this chapter the process performance of coiled PLM-fibers (Figure 4.1) is investigated. A coiled fiber module is prepared by coiling of a particle loaded fiber around a core. When 65
Chapter 4
the thickness of the coiled layer is sufficient the core with the coiled fiber is inserted into an outer shell and potted to fix the fiber pack and to fill-up the dead volumes. The flow performance of a coiled fiber module can be tailored by adjusting the layout spacing (distance between two adjacent coils) and the winding tension (the force exerted on the fiber during the coiling process).
layout spacing
Figure 4.1 Schematic drawing and a photo of a very open winding to visualize the winding distance between two adjacent windings, the so called “pitch”.
The coiled fiber modules can be scaled easily by changing the fiber package diameter or the module length. A disadvantage of the coiled fiber module is the challenge to balance the convective flow around and through the fibers. It is highly desirable to be able to predict whether the adsorption fiber has adequate adsorption performance, even before winding a coiled fiber adsorber module. We hereby present an algorithm to correlate the adsorption kinetics from an incubation experiment with the dynamic breakthrough performance of a coiled fiber module.
66
Module design
BACKGROUND Membrane chromatography is a promising technique for the isolation, the purification and the recovery of biomolecules. When compared with traditional bead chromatography, the process is much faster, easier in processing and more robust. Beside this it is also easier to set up and to scale up [7-9]. The advantage of the particle loaded membrane adsorbers for protein applications is the combination of both a high flow rate and a high capacity. This originates from the fact that macroporous membranes, when compared to chromatographic beads, have a very low flow resistance. The big pores in the membrane structure ensure convective transport of the target molecules to the active binding sites located on the surface of the embedded particles. Meanwhile, the uses of small particles create a high adsorption/affinity area per unit of column volume. The embedding in a macroporous matrix makes the particles insensitive for deformation.
Adsorption
Kinetics from incubation The binding of ligate molecules occurs by adsorption from the liquid phase onto the ligands present on the surface or in the pores of a solid support material. In the case of a protein as the ligate (P) and a vacant immobilized ligand (S), the following reaction scheme applies:
P � S l PS
Eq. 4.1
where PS represents the protein-ligand complex. In a second-order rate expression, equation 4.1 can be written as:
wcs wt
k a c(cl � cs ) � k d cs
Eq. 4.2
t = time in [s] c = feed concentration [mg/ml] cs = protein-ligand complex [mg/ml] cl = ligand capacity [mg/ml] ka = forming constant of complex PS [ml mg -1 s -1 ] kd = dissociation constant of complex PS [s -1 ]
67
Chapter 4
The mass balance over a membrane section can be described by two continuity equations: one for the liquid phase and the other for the solid phase [10, 11]. For the liquid phase wc wc wc w2 c İ �u = Dax - � 1-İ s 2 wt wx wx wt
Eq. 4.3
unsteady state + convection = axial diffusion - adsorption In these equations İ is the void fraction, u the linear flow velocity (m/s), a the exchange area and K the adsorption reaction coefficient (s-1m-2). The concentration gradients in the radial direction are assumed to be negligible because the time scale for radial diffusion is much less than that for axial convection. For mixed matrix systems using one component and assuming that at initial conditions there is no protein in the membrane, equation 4.3 becomes: For the liquid phase
H
wc a K � cs � c wt
Eq. 4.4
For the solid phase
�1 � H
w cs wt
�
� a K cs � c
Eq. 4.5
The factor a K , a lumping parameter including the diffusion and the adsorption kinetics and the protein unfolding and rearrangements during the adsorption process, can be deduced from the kinetics of an incubation experiment where the bulk concentration is plotted as function of time. The initial slope of this kinetic depletion process describes the mass flow ( j ) in the adsorption process if only diffusion occurs (Eq. 4.6).
j
68
V a K 'c
Eq.4.6
Module design
with:
j = mass flow (mg/s) V = reactor volume (m3 ) a = specific adsorption area (m 2 /ml) K = adsorption constant (ml/m 2 s) ǻc = concentration difference (mg/m3 )
Characterization modes For the characterization of the coiled fiber modules we used two different operational modes:
x
the Heaviside step function, which can be realized by changing the eluent after obtaining a steady state value (e.g. an equilibration step) by another eluent containing a target component (adsorptive buffer). This method is applied for measuring the breakthrough curves.
x
The tracer impulse method, in which a small volume of non-binding tracer, often NaCl or acetone is injected at the entrance of a column and the outlet concentration is measured. The resulting peak is used for calculating the plate count and the void volumes of the column. Heaviside step function In the module
tracer step function In the module
Out of the module
Out of the module
1
1
1
1
0
0
0
0
t=0
Time
t=0
Time
t=0
Time
t=0
Time
Figure 4.2 Graphic representation of the concentration profiles of the different characterization modes.
Dynamic binding capacity in a module The dynamic effectiveness of an adsorber can be visualized by measuring the breakthrough curve where the load of the target component is plotted against the eluent concentration (Figure 4.3). After a certain protein load, depending on the physical characteristics of the target molecule, the capacity of the module, the flow rate and the packing of the adsorber,
69
Chapter 4
the chromatographic column becomes partly saturated. The first target molecules break through and the concentration in the eluent starts rising. One can define a value of the dynamic binding capacity of 10% of the feed concentration. The area above the dynamic breakthrough curve (DBC) equals the adsorption capacity of the module. The DBC splits this area into two sections: the operational column volume and unused column capacity. The dynamic binding capacity also determines the amount of product loss, which is the area underneath the breakthrough curve before the DBC of 10%. For evaluation purposes the DBC at 10% is often used.
Ct/C0
1
Unused column capacity Operational column volume
Product loss
DBC10% 0 Protein loading [mg protein / g fiber]
Figure 4.3 Example of a typical breakthrough curve explaining the different areas of operational column volume, unused capacity and product loss.
A broadly disperse breakthrough curve causes a decrease in ligand utilization, delay in saturation time, or loss of product [12]. For an optimal utilization of the column material (often very expensive) and for a minimal product loss a sharp breakthrough curve should be defined. To estimate already in an very early stage the adsorption performance of a module, we will use the simple concept of the dimensionless adsorption number ( R ) that describes, within a time frame, the ratio of the mass flow of protein into the fiber in relation to the mass flow into the module (Eq. 4.7).
70
Module design
R
adsorption rate (mg protein/s) protein load module (mg/s)
m� fiber m� mod ule
Eq. 4.7
For a given fiber, the mass flow of protein into the fiber is constant if diffusion is predominant. R can only change by varying the flow into the module. If as a consequence of the increased protein flow rate the DBC10% does not change with the increasing protein load, the adsorption rate of the fiber is not limiting the adsorption process in comparison with the mass load of the module (Figure 4.4). When the mass flux into the fiber is limiting the adsorption process, DBC10% decreases with an increasing flow rate of the protein load. At high R values the DBC10% approaches the values obtained by the incubation experiments.
m� fiber
m� mod ule Figure 4.4 Visualization of the mass flux into the adsorber module and into the fiber.
An adsorber is effective when the adsorption power (V a k 'C ) is bigger than the mass flux into the adsorber module (Eq. 4.8). For a defined dimensionless adsorber constant R as:
R
j / I c !! 1
Eq.4.8
with
I = volume flow (ml/s) c = feed concentration (mg/ml) 71
Chapter 4
A R ! 1 means that the time necessary for adsorption is shorter than the residence time in the adsorber. Once we have coiled the fiber and prepared a module, a dynamic breakthrough experiment is performed. a K may deviate from the situation of pure diffusion only for two reasons: (a) a K may be larger due to convective flow into the fiber (convective induced diffusion) or (b) a K may be lower due to fluid maldistribution in the module.
From the static incubation experiments we determine the accessibility of the embedded particles. In the case that all particles are accessible, the maximal adsorption capacity based on the embedded particles should be equal to that of free particles (dotted line in Figure 4.5). In situation (a) the breakthrough curve resembles the ideal curve, which means a complete utilization of the particles. Even when operated at somewhat higher flow rates the breakthrough curve remains in the same position because the adsorption power of the fiber dominates over the protein mass flux to the module. The small amount of unused adsorption capacity can be contributed to dispersion effects in the column. In the case (b), visualized as maldistribution in Figure 4.5, there are more possible explanations. The first one is maldistribution due to non-uniform module assembling. Depending on the column packing the flow paths and therefore the flow rates can vary. In the “worst case” scenario the adsorption capacity in one part of the column may be fully utilized, while in other parts of the column the adsorption capacity is hardly used. This means remaining of unused binding sites. As a result the product binding and the breakthrough occurs simultaneously, destroying the resolving power of the column. This can be due to non-uniformly fiber coiling as well as inadequate module potting. Another explanation can be the insufficient diffusion time for the target components to reach the active sites that are located deeper in the interior of the fiber and are not reached by the convective flow. This can be either due to a low surface porosity, a bad pore interconnectivity or a too thick fiber.
72
Module design
1 unused capacity
Ct/C0
maldistribution
no adsorption ideal curve
0 max capacity
Protein loading
Figure 4.5 Possible breakthrough curves.
A breakthrough curve with an ideal profile, but shifted towards a lower adsorption value indicates that part of the module is not accessible for the target components. This occurs when potting material deactivates part of the fiber or when the particles are entrapped in closed cells and can not be reached by the target components. When no adsorption capacity is found at all, the module has a serious bypass, such that the eluted protein has no contact with the adsorptive fiber.
Chromatographic figures of merit Martin and Synge [13] were the first to apply into chromatographic systems the concepts used for describing fractional distillation and extraction. They defined each plate or height equivalent to one theoretical plate (HETP) as ‘the thickness” of the layer such that the solution issuing from it is in equilibrium with the mean concentration of the solute in the non-mobile phase throughout the layer. In the case of chromatographic columns, “the thickness” of a layer translates to a portion of the bed height. The plate concept is used to provide a measure of the peak’s spreading relative to the distance it has migrated. The plate height is normally determined by injection of a small non-binding tracer such as NaCL or acetone. In ideal responses, the peak shapes can be modeled according to a Gaussian distribution function and the number of plates is given by Eq. 4.9. This equation is widely used, even if true Gaussian peaks are rarely observed (Figure 4.6).
73
Chapter 4
A small plate height, or conversely, a large plate count indicates an efficient column. The HETP gives therefore a measure of the separation efficiency per unit length of column, when operated under a given set of conditions. HETP varies with the concentration, nature and volume of the test solute. The column plate number ( N ) can be experimentally determined by measuring the peak retention ( t R ) and the width of the peak at half height ( Wh ). The peak asymmetry is the ratio of peak width to the tail divided by the width to the drop line at 10 % peak height (Eq. 4.10). tR2
Wh Vw Vo A B tR
Peak height [A.U.]
tR1
Wh V0 Inject
= peak width at half height = peak width at given peak height = interstitial void volume = peak width at 10% to drop line = peak width to tail at 10% = retention time
10 % height VW
A
B Time [s]
Figure 4.6 Example of a chromatogram, to explain the different column parameters.
The column efficiency is defined as:
N
§t · 5.54 ¨ R ¸ © Wh ¹
2
Eq.4.9
The peak asymmetry, which represents the tailing of the peak caused by intra and extra column dispersion effects, is given by:
As =
74
B A
Eq. 4.10
Module design
EXPERIMENTAL Materials The used mixed matrix fibers consisting out of SP Sepharose HP beads embedded in a hydrophilized polyethersulfone backbone (Figure 4.7) were kindly supplied by Mosaic Systems. Lysozyme (LZ, Sigma) was employed as test protein in both incubation and dynamic experiments. All solutions were freshly prepared before use with ultra pure water using a Millipore purification unit Milli-Q-plus.
Figure 4.7
Cross-section of a solid adsorptive fiber with SP Sepharose HP particles.
Methods
Incubation experiments Daily fresh prepared solutions of hen egg white lysozyme (LZ) were used as test protein. All the adsorption experiments were carried out using a 50 mM phosphate buffer pH 7.0. The ionic strength of the buffer was adjusted with NaCL to 0.154 mM, which corresponds to the physiological conditions of living cells. A known amount of adsorber fiber was immersed into a 25 ml buffer solution containing 1 mg LZ/ml. The protein uptake by the fiber was determined in time by measuring spectrophotometric the protein depletion at 280 nm.
75
Chapter 4
The maximal LZ adsorption rate ( j ) of a fiber can be calculated from the LZ depletion of an employed feed solution. By plotting the feed concentration as a function of time (Figure 4.8), the slope ƨ multiplied by the feed volume represents the maximal protein mass flux, which is the amount of protein that can be adsorbed per unit of time and per volume of supplied fiber (Eq. 4.6).
1,1
1,0
LZ [mg/ml]
0,9
amount LZ on 131cm fiber
0,8
T 0,7 feed concentration
-3
j = 1.9x10 g LZ/s m
0,6
at equilibrium
0,5 0
100
200
300
400
500
600
time [ min ]
Figure 4.8 Incubation with a mixed matrix fiber. C0 = 1.04mg/ml, V = 25ml, mass of the fiber = 0.045 gram and the fiber length 131 cm. j = 1.88x10⁻³g LZ/s m.
Module production For the module production the adsorptive fibers were coiled on a 15.0 cm long tube, till a package with a thickness of about 2.4 cm was obtained using a Sahm 400 E winder (Figure 4.9 G). End caps with flow distributors were attached and the whole assembly was inserted in a housing with an external diameter of 2.5 cm. The empty space between the housing and the fiber package was filled-up with potting material to minimize the dead volume and to fix the end caps. After 24 hours of hardening the modules were ready to be characterized. To optimize the adsorptive performance, modules with different winding tension and layout spacing were assembled.
76
Module design
D A F
C
A B A E
G
A B C D E F G
pullies dancer arm counter weight gas pressure, adjusting winding tension displacement system fiber feeding internal tube with coiled fiber
Figure 4.9 The uptake part of the SAHM 400 E winder.
Winding tension and layout spacing A Sahm 400E parallel winder (Figure 4.9) was used for assembling the modules. The winder works with the slave–master principle, therefore it has to be used in combination with a fiber feeding system. The feeding, preferable constant, determines the take-up speed. The Sahm winder (the slave) follows the speed of the feeding system (the master) keeping the dancer arm, with a control of the winding tension, in the same position. The winding tension can be varied by either changing the position of the counter weight or by applying a gas pressure. The most important parameter that can be varied apart from the winding tension is the layout spacing between two adjacent coils (the “pitch”). By changing the ratio between the uptake and the traverse speed (horizontal displacement) the layout spacing of the fiber pack can be varied. It is easy to imagine that a horizontal displacement of 1 fiber diameter per revolution creates a dense parallel winding pattern. By increasing the speed of the horizontal displacement with respect to the up-take speed, a diamond like pattern is obtained (Figure 4.1).
Separation power of a module To determine the separation power of a mixed matrix module an Akta Prime or an Akta Explorer system (GE Healthcare) was used. 1 M NaCl was used as a non-binding tracer and injected via a 1 ml loop on top of the column and eluted with 60 cm/h. The response was followed by measuring the conductivity of the eluent. The injection starts as a block77
Chapter 4
flow pattern comparable with plug-flow. During elution through the module, the pattern changes due to dead-volumes, channeling, mixing effects and axial dispersion (in the ideal case) into a Gaussian distribution. The number of theoretical plates, the peak asymmetry (Eq. 4.9 and 4.10) and the column hold-up volume (Ve) were calculated as an indicator of the module effectiveness.
Dynamic binding capacity The LZ-breakthrough curves were monitored by continuous elution of 1 mg LZ/ml solutions experiments, unless else is mentioned, through the modules using the Akta systems as described above. Buffer and ionic strength conditions were identical as described under incubation experiments. The protein concentration was measured as function of eluted volume and time by UV absorption at 280nm.
RESULTS Winding tension To gain insight in the effect of the winding tension on the process performance, modules with different winding tensions were constructed. The gravity enforced on the dancer arm (Figure 4.9B) was varied from 30 to 180 grams using the same layout spacing. This results in a decrease of the effective layer thickness with an increase of the winding tension, which can only be explained by fiber deformation, especially on the fiber junctions. A reduced effective layer thickness means that the porosity of the module decreases. The consequence should be a reduced external fiber volume per module and a higher flow resistance. These hypothesizes were tested. Figure 4.10 proves that the increase in the flow resistance is more than proportional with the winding tension. A winding tension of 180 gram creates a pressure drop that exceeds the maximum allowable system pressure of 10 bars using a flow rate of 3 ml/min (| 68 cm/h). Because of this low allowable flow rate, this module is not taken into account in the further research. Table 4.1 presents the module characteristics and the flow resistance data.
78
Module design
Table 4.1
Influence of the winding tension, layout spacing 2.5mm. Winding tension [gram]
30
60
120
180
Layer thickness [mm]
0.088
0.079
0.068
0.057
Pressure drop [bar/m]
9.1
24.7
54.3
>91.7*
DBC 10% [mg LZ/g resin]
41
55
65
nd
* Flow rate 68 cm/h; others 100 cm/h.
Contrary to the decreased flow behavior, the dynamic adsorption capacity of the prepared modules is much more positive. When modules with different winding tensions are compared, (Figure 4.11) the capacity at 10% breakthrough (DBC10%) increases with the winding tension. A higher-pressure drop over the module ensures more fiber convection. So the active sites located deeper in the interior of the fiber are now reached by convective mode. This shift towards higher dynamic capacities means a better utilization of the fiber pack. The breakthrough curve is also steeper, which means that at DBC10% the product loss is lower (area under the curve is smaller). The winding tension is therefore a good tool to tailor the adsorptive properties of a module, dependent on the requested recovery and productivity. A high winding tension can be applied to minimize the product loss while
-3
Flow resistance x10 [cm/hr/cm/bar]
coiling with a somewhat lower tension results in modules with higher throughput.
1.4 1.2 1.0 0.8 0.6 0.4 0.2 0.0 20
40
60
80
100
120
140
160
180
200
Winding power [gram]
Figure 4.10 The flow resistance of adsorptive modules constructed with different winding tension.
79
Chapter 4
When modules are coiled using a higher winding tension, the layer thickness and thus the hold-up volume in the membrane adsorber module decreases due to fiber deformation. This results in a higher flow resistance and thereby a higher pressure drop over the module. Figure 4.12 presents the flow transport through the module as a parallel resistance model. From this scheme it is obvious that an increase in the external flow resistance favors the internal flow transport. This leads to a better accessibility of the active sites located more in the interior of the fiber. As a consequence, the dynamic capacity increases and the adsorption process is less flow dependent.
0,6 0,5
120 gram 60
Ct/C0
0,4
30
0,3 0,2 0,1 0,0 0
10
20
30
40
50
60
70
80
90
100
loading lysozyme [mg/ml resin]
Figure 4.11 Influence of winding tension on the dynamic adsorption behavior. The winding tension ranges from 30 to 120 gram. The feed solution is 5mg LZ/ml and the flow rate 25cm/h.
Layout spacing After entering the module the flow experience parallel flow channels: around or through the fibers. Narrower layout spacing reduces the external fiber volume (porosity) of the modules thereby favoring the flow through the fiber, similar to a high winding tension (Figure 4.12).
80
Module design
Outlet
Internal fiber volume
External fiber volume
Inlet
Figure 4.12 Block diagram of the flow resistance model of a membrane adsorber module.
Since, the adsorption process is now not solely controlled by slow diffusional processes but is enhanced by convection, the dynamic adsorption capacity is less strongly dependent on the residence time in the module (flow rate). Table 4.2 presents the module pressure drop and the dynamic adsorption capacity combining different layout spacings and winding tensions. It clearly shows that both parameters can be used to tailor the module performance characteristics. Table 4.2
The influence of the layout spacing on the module pressure drop and on the dynamic adsorption capacity for two different winding tensions. Feed flow is 100 cm/h, LZ concentration is 1 mg/ml.
Winding tension
Layout spacing
Pressure drop
Adsorption capacity
mm
bar
mg LZ/ml resin
30
1.25 2.5
4.6 1.6
21 17
60
2.5 5.0
3.4 2.6
51 38
Separation power of a module The chromatographic characteristics of the different modules were compared on plate count (N), peak asymmetry and hold-up volume by injecting of 1 ml 1M NaCL op top of
81
Chapter 4
the column. From the obtained chromatogram the peak retention time and the peak width at half height were determined to calculate with equation 4.9 and 4.10 the plate number and the peak asymmetry. The hold-up volume (porosity of the module) decreases with the winding tension. Applying a winding tension of 30 gram the module porosity is about 80%. By increasing the winding tension up to 120 gram the porosity drops till approximately 55%. It is remarkable that the module with the best adsorption performance has the lowest plate number and the highest asymmetry factor (Table 4.3). The excellent breakthrough curve of the 120-module can only be explained by the high pressure drop, which cranks up the fiber convection of and outweighs the dispersion increase. Table 4.3
Module characteristics measured with a linear velocity of 60 cm/h. winding tension (gram)
Peak width
plates/m
asymmetry
30
57.46
114
1.32
60
33.90
144
1.82
120
99.03
31
3.98
Dynamic adsorption rate A membrane adsorber module is assembled by coiling 270 m fiber as described in (Figure 4.8) on an internal tube using a 30 gram tension. After potting the module, the net flow area measures 2.81 cm2. According to the fiber characteristics this module should be able to capture 0.51 mg LZ/s (= j ). When this module is loaded at 508 cm/h with 5 mg LZ/ml solution the dimensionless adsorption number ( R ) is amounted to 0.25 (Eq. 4.8). This means that the mass flux to the adsorber is bigger than the maximal adsorptive mass flux of the fiber. The consequence should be that product binding and breakthrough occurs simultaneously. Figure 4.13 (curve denoted with 508 cm/h) proves that this hypothesis is right. When the mass flux into this module is lowered to 25 cm/h the value of ( R ) increases to 5.20. Now the adsorptive mass flux of the fiber is bigger than the mass flux into the adsorber module. So, all the initially loaded LZ on the module will be adsorbed by the fiber. The LZ concentration in the eluent becomes zero, which means that the breakthrough curve sticks to the base line. When almost all the active sites in the chromatographic column are occupied by protein molecules the protein concentration in the eluent starts rising However the slope at the breakthrough point is quite flat. The 82
Module design
reason for this can be that the time needed by a component to diffuse to the active site is insufficient. This can be tailored by adjusting the winding tension. By increasing the winding tension for a new module from 30 to 60 gram the external fiber volume in the module decreases promoting the convection through the fiber.
0.9
5 mg LZ/ml
0.8 0.7 winding tension 60
winding tension 30 0.6
C /C t 0
0.5 508
0.4
25 0.3
25 cm/h
0.2 5.20
R=0.25
0.1
4.09
0.0 0
10
20
30
40
50
60
70
loading lysozyme [mg/ml resin]
Figure 4.13 The dynamic breakthrough curves of modules constructed with the fiber from figure 4.8. The module with a winding tension of 30 gram is diffusive controlled where as the module construction with a winding tension of 60 gram shows an almost ideal breakthrough behavior. Al modules have 2.5 mm layout spacing.
The utmost curve to the right shows a breakthrough curve of a module prepared with 178 m of the same fiber using a winding tension of 60 gram. Because of the higher convective contribution the breakthrough curve shifts toward higher adsorption capacities and becomes steeper, which means less product loss and a better utilization of the embedded resins. This proves that the layout spacing and the winding tension are powerful parameters that can be used to design a module for a certain application. Modules for complete capturing can be made by combining high winding tensions with a narrow layout spacing and for polishing applications a low winding tension combined with a big layout spacing is preferred.
83
Chapter 4
CONCLUSIONS For membrane adsorbers applications it is not only important how to prepare suitable fibers with adsorptive properties, but of even more importance is the module construction. In this chapter we focused on the module assembling, trying to rearrange the adsorptive fiber packing in such a way that they perform the up most for a specific application. First fibers were characterized by determining their adsorptive properties in incubation tests. The dimensionless adsorption number (R), which is the most important module characteristic gives information about the protein uptake speed. When R > 1, the flow to the adsorptive sites is limiting the process, thus all the components loaded into the module are bound to the active sites. Under dynamic conditions, this means that the breakthrough curve sticks to the base line followed by a steep increase at the breakthrough point. For module assembling two critical parameters the layout spacing and the winding tension are equally important. By increasing the distance between two adjacent fibers during the coiling process, the module porosity increases. This affects both the dynamic adsorption capacity and the permeability of the module. Bigger layout spacing gives a lower flow resistance thereby promoting the flow around the fibers, and making the adsorption capacity highly flow rate dependent. By applying a high winding tension during the coiling process, fiber deformation takes place resulting in modules with a higher packing density and a higher flow resistance. Now the feed flow is to a greater extent forced through the fibers thereby reducing the diffusive distance to the active sites located more in the interior of the fiber. The resin utilization increases for a given residence time. Modules with coiled adsorptive fibers can be easily tailored to fulfill the demands of a given separation process. Combining wide layout spacing with a low winding tension, modules with very high permeability can be produced. This can be very beneficial in product stabilization and standardization especially when big volumes have to be treated. Narrow layout spacing and a high winding tension favors resin utilization and minimize the product loss. These settings are especially useful in pharmaceutical application where the components of interest are very valuable and product loss should be avoided.
84
Module design
REFERENCES 1. 2. 3. 4. 5. 6. 7. 8. 9. 10. 11. 12. 13.
Przybycien, T.M., N.S. Pujar, and L.M. Steele, Alternative bioseparation operations: life beyond packedbed chromatography. Current Opinion In Biotechnology, 2004. 15(5): p. 469-478. Pendlebury, D., Life Sciences: New Innovations in Membrane Chromatography. A2C2, 2003. May. Podgornik, A., et al., Large-scale methacrylate monolithic columns: design and properties. Journal of Biochemical and Biophysical Methods, 2004. 60(3): p. 179-189. Hjorth, R., Expanded bed adsorption: elution in expanded bed mode. Bioseparation, 1998. 8(1-5): p. 1-9. Teeters, M.A., T.W. Root, and E.N. Lightfoot, Performance and scale-up of adsorptive membrane chromatography. Journal of Chromatography A, 2002. 944(1-2): p. 129-139. Avramescu, M.E., Z. Borneman, and M. Wessling, Dynamic behavior of adsorber membranes for protein recovery. Biotechnology and Bioengineering, 2003. 84(5): p. 564-572. Brandt, S., et al., Membrane-Based Affinity Technology for Commercial Scale Purifications. BioTechnology, 1988. 6(7): p. 779-782. Manganaro, J.L. and B.S. Goldberg, Protein purification with novel porous sheets containing derivatized cellulose. Biotechnology Progress, 1993. 9(3): p. 285-290. Markell, C., D.F. Hagen, and V.A. Bunnelle, New Technologies in Solid-Phase Extraction. LC-GC Magazine of Separation Science, 1991. 9(5): p. 332-337. Thomas, H.C., Heterogeneous ion exchange in a flowing system. Journal of theAmerican Chemical Society, 1944. 66: p. 1664-1666. Suen, S.Y. and M.R. Etzel, A mathematical analysis of affinity membrane bioseparations. Chemical Engineering Science, 1992. 47(6): p. 1355-1364. Arnold, F.H., H.W. Blanch, and C.R. Wilke, Analysis of affinity separations: I: Predicting the performance of affinity adsorbers. The Chemical Engineering Journal, 1985. 30(2): p. B9-B23. Martin, A.P. and R.L.M. Synge, A new form of chromatogram employing two liquid phases 1. A theory of chromatography. 2. Application to the micro-determination of the higher monoamino-acids in proteins. Biochem J. 1941 December; 35(12): 1358-1368., 1941. 35(12): p. 1358-1368.
85
86
CHAPTER 5
DEVELOPMENT OF NEW PARTICLE LOADED ADSORPTIVE HOLLOW FIBER MEMBRANES FOR MEMBRANE CHROMATOGRAPHY APPLICATIONS
ABSTRACT This chapter reports the application of particle loaded hollow fiber membranes for membrane chromatography. The membranes were prepared as Mixed Matrix Adsorber Membranes by dispersing cation exchange particles into the membrane forming polymer solution. The high flow resistance of the surface layer can be reduced by co-extrusion of a macroporous particle-free protection layer. This layer is also suppressing the potential particle loss from the membrane adsorber during chromatography. Potential liquid flow maldistribution due to wall thickness variations and inhomogeneity of the membrane morphology was compensated by connecting in series a minimum of 5 hollow fiber modules. Sharp breakthrough curves in dynamic adsorption were demonstrated for lysozyme (LZ) and J-globuline (h-IgG). The dynamic lysozyme adsorption capacity was almost independent of the flow rate over the range of 30 – 250 bed volumes per hour. The dynamic IgG adsorption capacity was 2 times larger than the one of packed beds of protein-A functionalized sepharose and macroporous beads at equal hydrodynamic conditions. The adsorptive hollow fibers were also applied for the isolation of LZ from a crude mixture of fresh chicken egg white. The particle loaded membranes offer high fluxes up to 1500 l m-2h-1 combined with a high dynamic capacity, selectivity and purity. The obtained dynamic capacities of 60 mg LZ/ml membrane were similar to static values and belong to the highest values reported in the literature.
87
Chapter 5
INTRODUCTION Column chromatography is a highly developed method used as a final step (in both capturing and polishing) in the recovery of biomolecules out of complex biomolecular mixtures. The first chromatographic columns were realized as packed beds with approximately 100 µm beads. Their main drawback apart from the low capacity for large sized target compounds, such as high molecular proteins, monoclonal antibodies and DNA is the long diffusive path length inside the chromatographic support making the dynamic capacity strongly flow rate dependent [1]. A higher capacity and a shorter diffusion path can be obtained by using smaller beads. However, the drawback of small sized beads is that they are more densely packed and create a high pressure drop resulting in a low throughput. In radial direction and inside the chromatographic beads diffusional processes are determining the capacity of the system. It is easy to understand that the convective transport through a macroporous membrane is superior to the slow diffusional processes through the pores of the chromatographic beads having random tortuous paths (Figure 5.1) [2, 3]. The use of membranes eliminates pore diffusion, leaving film diffusion from the core of the liquid to the membrane surface in the interior of a through-pore as the only transport resistance. As film diffusion is usually orders of magnitude faster than pore diffusion, mass transport limitations are drastically reduced in membrane chromatography, shifting the limitation of the process to the properties of the matrix-solute interactions [3-5]. bulk convection film diffusion pore diffusion
Figure 5.1 Visualizations of convectional and diffusional pathways in bead columns (left) and in membrane chromatographic systems (right). 88
Particle loaded adsorptive hollow fibers
Since a typical membrane bed (including flat sheets and hollow fibers) has a much larger cross-sectional area relative to the bed height compared with packed bed columns, the pressure drop is drastically reduced. This results in higher flow rates and thus higher productivities. Short diffusional distances allow for an optimal utilization of the immobilized ligand situated on the pore walls. The disadvantages of the membrane chromatographic systems are related to their high flow rates. For a given membrane thickness a high flow rate can only be achieved when having big pores. This goes along with a low internal surface area (the area available for ligand binding), and thus a low adsorption capacity. Typical BET-areas for macroporous membranes are in the range of 5 to 16 m2/g of membrane material [6-8], which is 1 to 2 orders of magnitude lower than that of the classical chromatographic beads [9]. However for the recovery of big ligate molecules this is not disastrous since anyway these molecules cannot penetrate into the fine porous bead structure. This means that the adsorption capacity is controlled only by the exterior bead surface. The advantage of the particle loaded membrane adsorbers, as developed by Avramescu [10] and commercialized by Mosaic System, is the combination of both a high flow rate and a high capacity. This can be established by entrapping small functionalized particles in a macroporous membrane. The highly porous membrane structure has a low resistance against mass flow ensuring convective transport of the target molecules to the active binding sites. The small embedded particles cause a high adsorption/affinity area per unit of column volume. The embedding of particles in a macroporous matrix makes the column insensitive for eventually bed compression, even when high flow rates are applied. Because the embedded particles are individually fixed in a three dimensional network, possible deformation of individual beads has no accumulating effect on the flow restriction. Membrane chromatography systems are available in different geometries: coiled solid fibers [Mosaic Systems], flat sheets [Pall and Sartorius] and hollow fibers [not yet commercially available]. The disadvantage of the solid fibers is that the majority of the solute flow bypasses the fiber, while transport into the fiber is mostly diffusion controlled. This makes that a full fiber module is for a large extend diffusive controlled. The disadvantages of flat sheet membranes are the dispersion effects due to the entrance and exit effect as well poresize distribution and thickness variations. To overcome this disadvantage at least 30 membrane layers are necessary to average out heterogeneities and membrane nonuniformities, which leads to an enormous increase in pressure drop [11]. 89
Chapter 5
A disadvantage of adsorptive hollow fiber membranes is their decrease in radial elution velocity with increasing fiber length due to a decrease in axial pressure drop. This causes flow maldistribution making the breakthrough curve less steep, hampering full ligand utilization. Despite this disadvantage the adsorptive hollow fibers are interesting because of their high frontal area. They are convective and in contrary with some of the other geometries the hollow fiber modules may be cleaned and regenerated by back or forward flushing. The prepared mixed matrix hollow-fiber membranes were used for the recovery of the model components lysozyme and J-immunoglobulin. They were also investigated for the the isolation of lysozyme out of crude chicken egg white. Chicken egg white (CEW) is the cheapest source for lysozyme recovery, even though it only represents about 3.5 wt% of the total CEW protein mixture [12]. Egg white proteins are very different in size, isoelectric points and composition of hydrophobic amino acids (Table 5 1). It is thus possible to use their electrostatic and hydrophobic interactions or the ability to bind to metals as a mean of recognition in adsorptive separation.
Table 5.1
Selection of properties for the major proteins in the chicken egg white [12].
Protein
Amount (%)
MW (kDa)
pI
Intrinsic viscosity
Ovalbumin Ovotransferrin Ovomucoid Lysozyme Ovomucin G2 Ovoglobulin G3 Ovoglobulin Ovoflavoprotein Ovostatin Cystatin Avidin Thiamine-binding protein Glutamyl aminopeptidase Minor glycoprotein 1 Minor glycoprotein 2
54 12-13 11 3.4 - 3.5 1.5 - 3.5 1.0 1.0 0.8 0.5 0.05 0.05 -
45 77.7 28 14.3 220 - 270000 47 50 32 760 - 900 12 68.3 38 320 52 52
4.5 6.0 4.1 10.7 4.5 - 5.0 4.9 - 5.3 4.8 4.0 4.5 - 4.7 5.1 10.0 4.2 5.7 5.7
0.043 0.084 0.055 0.027 2.1 0.065 -
90
Particle loaded adsorptive hollow fibers
The flexible concept of mixed matrix adsorber membranes allowed us the incorporation of cation-exchange particles into porous structures. Having an isoelectric point (pI) of 10.7, lysozyme is, except the minor component Avidin, the only egg white protein with a pI higher than 7. Hence we hypothesize that the adjustment of the adsorption conditions allows the lysozyme to be retained inside the membrane by adsorption while the low isoelectric point proteins pass freely through the membrane.
The aim of this chapter is the development of new particle loaded adsorptive hollow fiber membranes as an alternative for the chromatographic techniques described above. By clever linking up together series of modules we try to minimize the maldistribution. This results in systems that are characterized by steep breakthrough curves, which mean optimal ligand utilization.
BACKGROUND There exist two challenges for a viable application of hollow fiber membranes in membrane chromatography: (a) variation in wall thickness and (b) variation in porosity. Too large variation in either of them can result in reduced chromatographic performance.
Variation in wall thickness The wall thickness of affinity hollow fibers should be at least in the order of 500 µm. to obtain sufficient adsorption capacity and to limit the axial dispersion effects. Variation in wall thickness due to miss centering of the bore needle is unavoidable. Figure 5.2 represents a fiber with a wall thickness variation of about 10 %. Assuming a constant pressure drop over the hollow fiber and a constant permeability, the permeation rate calculated with the Blake–Kozeny equation (Eq. 5.1) gives a 20 % difference in flow velocity between the thin and the thick part. It is therefore easy to imagine that during an adsorptive run the thin site is much faster saturated with ligate, due to a higher flow velocity and a shorter permeation path. The calculated overall loss in adsorption capacity is about 25% [13].
91
Chapter 5
'P
150 u L µ ( 1- H )2 D p2 H 2
Blake � Kozeny equation
Eq. 5.1
ǻP = pressure drop (bar) u = linear velocity (m/s) L = membrane thickness (m) µ = viscosity (Pa s) İ = porosity (-) D p = particle size (m) protein adsorption front unused capacity at breakthrough used capacity at breakthrough
450 µm
550 µm
450 µm
550 µm
Figure 5.2 Electron microscope image of a hollow fiber with 10 % variation in wall thickness. The dotted-dashed line in the right drawing represents the amount of utilized ligand at the breakthrough point.
Variation in porosity A second disadvantage of both hollow fiber as well as flat sheet membrane adsorbers is the variation in porosity, which hampers the full utilization of adsorption capacity. For a good understanding of the problem it is important to know how the hollow fiber membranes are produced. Most manufactures, including the authors of this chapter, make use of the phase inversion wet spinning process in which a homogeneous polymer solution is extruded through a tube in orifice spinneret into a water bath (Figure 5.5).
92
Particle loaded adsorptive hollow fibers
For polymeric solutions with a low viscosity the polymer lean nucleus can grow (as long as the solvent composition in the nucleus exceeds a certain minimum) by indiffusion of solvent and non-solvent molecules. The macrovoid (big volume of polymer lean phase) growth will cease when the solution in front of the macrovoid remains stable [14]. These macrovoids, which are stochastically randomly distributed over the fiber wall cause a nonuniform mass flow over the fiber wall (Figure 5.3). The flow path A contains no macrovoids and it is likely that the linear fluid velocity a, is lower compared to the linear fluid velocity b in the macrovoid containing flow path B.
A
B
macrovoid
Figure 5.3 Cross-section of a hollow fiber adsorber membrane containing CNP80 particles. A indicates a path without macrovoids where as B is a low resistance pathway containing a big macrovoid. This difference in flow resistance results in a preferential flow through the macrovoids. Assuming that all the particles are homogeneously distributed throughout the matrix, the particles located in path B are � b/a times faster saturated with ligate than the particles in flow path A. Suen et al. [13] calculated for flat sheets that 10 % porosity variation results in a 40 % loss in adsorption capacity.
Diffusion limitation To describe the membrane chromatography performance Peclet numbers can be used. The radial Peclet number ( Per ) describes the dispersion in radial direction, which is strongly related to the pore radii in the membrane wall (Eq. 5.2). The axial Peclet number ( Pea ) describes the dispersion in the convective flow direction, which in membrane 93
Chapter 5
chromatography with hollow fibers is perpendicular to the fiber bore (Eq. 5.3, Figure 5.4). For optimal membrane performance the axial Peclet number must be greater than 40 and the radial Peclet number smaller than 0.04 [15].
L
Per
Pea
feed flow
Figure 5.4 Illustration of a hollow fiber to clarify the directions of the Peclet numbers.
Per
characteristic diffusion time residence time
Pea
characteristic diffusion time residence time
r0 = D= L= u =
r02 L
L2 L
D � 0.04 u
Eq. 5.2
D ! 40 u
Eq. 5.3
membrane mean pore radius [m] diffusion coefficent of the ligate [m2 /s] membrane thickness [m] average linear velocity of the fluid [m/s]
Comparison beads and fibers There are only a few articles in literature, which compare one-to-one bead and membrane chromatography. Because of the difference in aspect ratio between bead columns and membrane modules, there is a lot of indistinctiveness how to compare these two techniques. Klein and Kubota used the space velocity as a fair comparison between beads and membranes [7, 16, 17]. Kubota uses the whole fiber volume, while Klein subtracted the lumen contribution to the volume. We define the space velocity according to the equations
94
Particle loaded adsorptive hollow fibers
5.4 analogue to Kubota. In case of a series of fibers, the bed volume (BV) is the summation of the total fiber volumes.
Space Velocity = flow rate 4
ʌ d02 L
Eq. 5.4
with
d0 = outer diameter fiber (m) L = fiber length (m)
Klein [7] compared affinity adsorption devices containing flat sheet and hollow fiber membranes for IgG isolation. He assembled cross flow and dead-end flat sheet modules with a length of 23 cm and dead-end hollow fiber modules with a fiber length of 8 and 2.5 cm. He respectively found that the stacked flat sheets modules containing 23 layers have the lowest void volume and the highest pressure drop but show a sharp front-elution profile. The short dead-end hollow fiber modules showed in spite of a single passage through the thin wall an almost similar adsorption profile. The cross flow system, which is longer, and the only one that can handle cell suspensions, showed a broader breakthrough behavior. The excellent performance of the small dead-end modules was explained by the minimal pressure drop over the module combined with an instant equilibrium. For IgG isolation Kim et al. [18] used single tryptophan functionalized dead-end fibers of 12 cm long that are fed from both sides. They obtained broad breakthrough curves with a maximum adsorption capacity of 10 mg/ml. In this chapter we present first the details on the fiber preparation and the morphological characterization of the obtained particle loaded adsorber fibers. Then the static and the dynamic LZ adsorption are discussed with focus on the permeation rate and the protein residence time of a in a module. In the final part a various number of modules were linked together analogue with the stacking of flat sheet membranes, with the goal of sharpening the breakthrough curve by averaging out heterogeneities in wall thickness and porosity. Finally the prepared adsorptive hollow fiber modules were evaluated on their applicability to the recovery of LZ from crude chicken egg white.
95
Chapter 5
EXPERIMENTAL Materials Polyethersulfone (PES, Ultrason E6020P) kindly supplied by BASF-Nederland was used as matrix forming polymer. PES is a slightly hydrophilic engineering plastic with a Mw of 50 kDa commonly used for membrane production. Polyvinylpyrrolidone (PVP, Fluka) with different molecular weights (K15, K30 and K90) was used as polymeric additive, while polyethyleneglycol (PEG400, Merck) and glycerol (Merck) were used as non-solvent additives in the dope solution. N-methylpyrrolidone (NMP, 99 % purity Acros Organics) was used as solvent. Ion exchange (IEX) functionality was introduced by embedding Lewatit CNP80WS (a weak acidic, macroporous, acrylic-based cationic exchange resin) kindly supplied by Caldic, Belgium. The particles were milled and air classified to obtain a fraction with an average particle size of 7.4 micron. Lysozyme, (LZ, Sigma) originating from hen egg white and J-globulin, (hIgG, Sigma) were used as test protein. All the buffers were freshly prepared in ultra pure water using a Millipore purification unit Milli-Q-plus. Fresh hen eggs were purchased from the local market. The egg white was manually separated from the yolk and diluted three times with ultra pure water. Subsequently, the solution was adjusted to pH 6 with 1M HCl and allowed to stir for minimum 4 h. The white gelatinous precipitate containing mainly ovomucin was pre-filtered through a filter paper, and afterwards through 5 and 1 µm membranes respectively. The filtrate was used as feed solution for the lysozyme separation experiments.
Methods
Fiber preparation All fibers were prepared by a wet phase inversion process. After the complete dissolution of 12% PES and 7.5 % PVP in N-methylpyrrolidone at 50°C the solution was cooled down to room temperature. Where after 20% PEG and the IEX-particles, equivalent by weight to PES were suspended. The dispersion was stirred with a low speed for 16 hours to break down the possible clusters of particles and then transferred into the storage tank. The dope solution was allowed to degas for 20 hours before spinning by extrusion through a small extrusion head into a water coagulation bath (Figure 5.5). In case of co-extruded fibers, the same dope composition without particles was spun through the outer orifice of a triple
96
Particle loaded adsorptive hollow fibers
layered spinneret. The prepared hollow-fibers were washed in water to remove the solvents and the additives and afterwards exposed to a 4000 ppm NaOCl solution for 24 h to break down the remaining PVP. The particle load is defined as the weight of particles divided by remaining weight of solids in the fiber, thus not taking into account the polymeric additives PVP and PEG400. polymer solution storage tank
gear pump
spinneret
air gap
uptake winder washing bath coagulation bath
Figure 5.5 Schematic representation of a wet phase inversion spinning process.
Scanning Electron Microscopy (SEM) Cross-sectional samples for characterization by scanning microscopy were prepared by cryogenic breaking of fresh wet fibers in liquid nitrogen. The samples are allowed to dry overnight under vacuum at room temperature and then coated with a thin platinum layer using a JEOL JFC-1300 auto fine coater. The cross-sectional morphology was visualized by use of a Scanning Electron Microscope (JEOL JSM 5600LV).
Membrane porosity The membrane porosity was determined from the volume difference between the volume occupied by the polymer (equal to the volume of the dried membrane) and the volume of the membrane equilibrated in pure water. The volume of polymer was calculated as the ratio between weight of dried membrane and the polymer density. Average values were obtained from three different samples. The permeation rate through the hollow-fiber membranes was determined in dead-end filtration mode both with ultra pure water and solutions of 50 mM phosphate buffer pH 7.4.
97
Chapter 5
Static adsorption capacity The static protein adsorption capacity of the prepared mixed matrix hollow fibers was determined by lysozyme (LZ) depletion experiments. A known amount of adsorber was equilibrated with a LZ containing phosphate buffer at pH 7.4 and the protein uptake per weight of adsorber was measured. The ionic strength of the buffer was set to 130 mM, close to the physiological conditions. Initial LZ concentrations of about 1 mg/ml were employed in the adsorption experiments as a realistic concentration for many commercial processes. The protein concentration in the solutions was determined by measuring the UV-absorbance at 280 nm using a Varian Cary 300 spectrophotometer. The amount of adsorbed protein (mg LZ/g fiber) was calculated from the protein mass balance. All the adsorption tests were carried out at room temperature in a shaking machine with a frequency of 1.66 Hz. The static adsorption isotherm was determined by immersing the same amount of fiber in different lysozyme concentrations. The linear form of the Langmuir equation (Eq. 5.5) has been often used for interpretation of experimental data related to adsorption of biomolecules onto ion exchange resins.
1 q*
1 Kd 1 � qm qm c*
linear form Langmuir equation
Eq. 5.5
The graphical representation of equations 5.6 is called the Scatchard plot. Since the parameters q* and c* are experimental data the dissociation constant K d , and the maximum adsorption capacity qm , can be calculated from a linear curve fit [10, 19, 20]
Module preparation All the membranes were dried in air before potting them with polyurethane in a tube-in-shell configuration containing one single hollow-fiber. The effective filtration length of the module is 20 cm (unless else is mentioned) the internal diameter (bore) of the fibers is typically 500 µm, which means an active filtration area of 3.14cm2 per single fiber module. The outer diameter is of the fiber is 1500 µm. This means that the membrane volume of each single fiber module is amounted to 0.31 ml. The protein adsorption
98
Particle loaded adsorptive hollow fibers
capacity of a single membrane is limited therefore the hollow-fibers were housed in rigid cylindrical shells and mounted in series to achieve the necessary adsorptive capacities.
Dynamic adsorption capacity Breakthrough curves were established by permeating a solution containing 1 mg LZ/ml of 50 mM phosphate buffer pH 7.4 through single fiber modules in dead-end mode. The ionic strength of the buffer was 130 mM. The feed flow (ranging from 15 till 1500 l.m-2.h-1) was regulated by adjusting the nitrogen pressure of the feed storage tank. The effluent was fractionated in samples of 3 ml and the LZ concentration in the collected fractions was determined by UV-absorption at 280 nm using a Cary 300 UV spectrophotometer. The breakthrough curve was determined from the eluted volume and the calculated LZ– depletion. To increase the adsorption capacity and to average out the possible flow maldistribution series of up to 10 fibers were investigated. To investigate the adsorption performance of a high molecular weight antibody, IgG (158 kDa) was dissolved in a 50 mM acetate buffer at pH 5.0 and tested using similar module configurations and flow conditions. In the case of complex egg white mixtures, the protein concentrations were analyzed using a Waters 717 plus HPLC system equipped with a BiosuiteTM CM 10 Pm CXC cationexchange column and a Waters 2487 dual O absorbance detector. The developed analytical method was based on a gradient protocol using 20 mM phosphate buffer pH 6.1 as binding buffer and 0.5 M NaCl containing phosphate buffer pH 6.1 as eluting buffer.
Lysozyme separation from crude egg white mixtures To demonstrate and to quantify the potential of the newly developed hollow-fibers for protein fractionation, the effect of filtration flow rate and module design on lysozyme separation was investigated. If the membranes are operated at a pH lower than the isoelectric point of lysozyme, the protein is positively charged, meanwhile the cationexchange particles have a negative net charge. The lysozyme is therefore adsorbed into the mixed matrix membranes by electrostatic interactions, while the adsorption of the low pI proteins is minimized. The optimum pH in the permeation step was therefore considered to be slightly on the basic side (pH>7). In this condition, LZ has a positive net charge and compensates the negative surface charge of the sorbent. Meanwhile, all the other CEW 99
Chapter 5
proteins (referred to as albumin fraction) are negatively charged and thus their adsorption is expected to be negligible. The competitive adsorption of the egg white proteins on the hollow-fiber membranes was studied at the optimal operational conditions (deduced from the single protein adsorption experiments). The pre-filtered egg white solution was permeated through series of hollowfibers at a constant filtration flow rate of 200 l źh-1źm-2. The protein concentrations in the feed, the collected permeate and the eluent fractions were calculated by numerical integration of the peak areas in the HPLC curves based on pre-determined calibration curves. The protein mass adsorbed per unit of membrane bed volume was calculated as already mentioned in the membrane characterization part.
The separation efficiency was evaluated by the separation factor S LZ/Albumin (Eq. 5.6) where
Cf,LZ and Cf,Albumin are the protein concentrations in the feed solution and Cp,LZ and
Cp,Albumin are the average protein concentrations in the collected permeate fractions during filtration, calculated by numerical integration of permeation curve over the filtration run.
S LZ/Albumin =
C p,LZ C p,Albumin C f,LZ C f,Albumin
Eq. 5.6
After reaching the breakthrough point, the membranes were rinsed with adsorptive buffer and subsequently used for LZ desorption at constant flow rate using a 0.5 M NaCl eluent. In these high ionic strength conditions the protein is released from the membrane and passes freely through the porous matrix in the bulk solution. The eluent was fractionated and the LZ and the albumin concentrations in the collected eluent fractions were monitored as previously described.
RESULTS AND DISCUSSION Fiber preparation For the particle loaded membrane adsorbers the amounts, size of embedded particles as well as their accessibility are important. For investigating their effect on fiber morphology we varied the polymer content in the casting solution and the particle loading. As already 100
Particle loaded adsorptive hollow fibers
pointed out in chapter 3 the increase in particle loading goes hand in hand with the increase in viscosity.
A
B
C D
Figure 5.6 Electron microscope images of PES hollow fiber adsorbers containing 50 wt% cation exchange resins CNP80. A) cross-section magnification x50, the size bar indicates 500 µm; B) crosssection of the outer layer X1000, the size bar indicates 10 µm; C) cross-section of the inner layer X1000, the size bar indicates 10 µm and D) outer surface X1000, the size bar indicates 10 µm
Figure 5.6 shows the Scanning Electron Microscope (SEM) images of the prepared fibers. Due to their high interconnectivity and porosity (|75% obtained from water up-take experiments) the prepared hollow-fibers have flow rates in the range of microfiltration membranes. Values over 6.000 lźh-1źm-2źbar were obtained when permeating ultra pure water through a single fiber module. As can be seen in Figure 5.6A the fibers are typically 1500 till 2000 µm with a lumen of about one third to half of the diameter. This means that at least 75% of the bed volume can be used for adsorption purposes. The continuous porous structure of the adsorber enables the use of series of hollow-fiber membranes
101
Chapter 5
avoiding the well-known packing problems that arise with conventional particles in packed bed systems. To increase the capacity of the adsorber membranes the resin load in the polymer has to increase. A disadvantage of a high resin loading is the increase in viscosity of the polymer dope, which results in narrowing of the pore size and increased flow resistance. This is because a high solid concentration in the dope implies a high volume fraction of solids, which consequently means a low porosity. The consequence is a densified skin layer. Using a 60 % particle loading we did not only observe a dense skin layer causing a high flow resistance but also particles embedded in closed cells being hardly accessible for the target proteins.
Figure 5.7 Electron microscope images showing particles that are puncturing through the outer surface. Magnification X1000, the size bar indicates 10 µm.
By using a triple layer spinneret and co-extruding a polymer solution without particles (low viscosity) we were able to tailor the morphology of the surface layer independent from the particle containing substructure. By this way the high flow resistance of the surface layer could be reduced, which results according to Zhang et al. [21] in a fiber with a much better adsorption behavior and higher adsorbing rates. An additional advantage of co-extrusion is that particle loss to the product side is prevented, since particles that in a process without co-extrusion puncture through the skin layer and tend to fall out (Figure 5.7) are now covered by the co-extrusion layer (Figure 5.8D). Thus co-extrusion also prevents contamination by particle loss of the end product, which should require an additional purification step.
The co-extrusion of a polymer dope consisting of the same solvents and polymers, but without particles, shows a good adhesion between the different layers. By applying 102
Particle loaded adsorptive hollow fibers
co-extrusion it is important that the individual layers in the solvent state are completely (or at least partly) compatible. If the contact between the layers is incomplete, the layers phase separate as two independent layers each with their morphology and shrinking [22, 23]. As can be observed in Figure 5.8C on top of the IEX-particles containing matrix, a layer of about 15 microns without particles is located. The pore size and the porosity of this layer are bigger than that of the original matrix. The originally skinned layer is replaced by a smooth transition between the different porous layers, compare Figures 5.6B and 5.8B. A
B
C
D
Figure 5.8 Electron microscope images of the co-extruded PES hollow fiber adsorbers containing 50 wt% cation exchange resins CNP80. A) cross-section, magnification X60, the size bar indicates 200 µm; B) cross-section of the outer layer X1000, the size bar indicates 5 µm; C) crosssection of the outer layer X5000, the size bar indicates 5 µm and D) outer surface X10000, the size bar indicates 1 µm.
Static adsorption To determine the accessibility of the IEX-particles located inside the hollow fiber matrix LZ kinetic adsorption isotherms were measured. To ensure a complete equilibrium the adsorption capacities were determined after 24 hours. These experiments proved not only 103
Chapter 5
the particles accessibility, but can also be used later on as an indicator for the effectiveness of the dynamic performance. Comparing the static adsorption capacities of the different spinning batches, we found that the fibers spun with 50 wt% particle loading possess a maximum LZ adsorption of over 200 mg/g membrane (Figure 5.9). By increasing the particle load up to 60 wt%, keeping the PES concentration in dope constant to maintain sufficient mechanical strength in the fiber, the weight of suspended particles in the dope increases with 50 %. The adsorption capacity of the resulting membrane however, reduced by a factor of five. This performance decrease could be explained by the increased viscosity of the dope solution. Even after increasing the dope temperature up to 60 °C the viscosity was still higher compared to the 50 % dope at 30 °C. This high viscous dope possesses a different phase separation behavior, which results in a dramatic change in membrane morphology. The originally open interconnected porous structure has changed to a system with particles embedded in closed cells being almost not accessible for target molecules. For all the dynamic experiments described in this chapter we make use of adsorptive hollow fibers that contain (based on dry weight) 50 % CNP80 IEX-resins. 240
Adsorption capacity [mg LZ/g membrane]
200
160 120
80
40
qm = 208 mg/g Kd = 0,17 mg/ml
0 0.0
0.5
1.0
1.5
2.0
2.5
3.0
Lysozyme concentration [mg/ml]
Figure 5.9 The LZ adsorption isotherm of adsorptive hollow fibers containing 50 wt% particle loading. The solid line is the best curve fit with the Langmuir equation. Data were measured after 24 hours in 50 mM phosphate buffer at pH 7.4.
Dynamic adsorption For testing the performance of the adsorber membranes, modules containing a single hollow fiber of about 20 cm length were prepared. A solution of 1 mg LZ/ml was
104
Particle loaded adsorptive hollow fibers
permeated in dead-end mode through the fiber with a flow rate of 65 l.m-2.h-1. To study the existence of flow maldistribution the fibers were stacked in series of up to 10 fibers, analogue to commercial flat sheet membrane adsorbers. While in flat sheet membrane applications at least 30 layers are recommended, for the hollow fiber concept stacking of 5 membranes was sufficient to average out the heterogeneities in porosity and the thickness variation (Figure 5.10). The experiments performed on series of 8 or 10 hollow-fibers did not show any further improvement in the protein adsorption capacities therefore we concluded that series of 5 hollow-fibers were sufficient to obtain the maximum dynamic lysozyme adsorption capacity.
0.5
Ct/C0 [ - ]
0.4
0.3
0.2
5 fibers 3
0.1
1
2
0.0 0
50
100
150
200
250
Protein loading [mg LZ/g fiber]
Figure 5.10 LZ breakthrough curves of different series of hollow fiber membranes, the flow rate is 4.8 cm/h (| 8 - 40 BV/h). The individual membranes have a filtration length of about 20 cm, an inner and outer diameter of 500 µm and respectively 1500 µm.
The low number of fibers in a series needed to obtain a good breakthrough behavior has to do with the intermediate permeate mixing in between two fibers, which levels of the local higher concentration obtained by maldistribution. Any parallel connection of adsorber modules reduces flow resistance, maximizing the throughput. Unfortunately, the performance deteriorates because inequalities in flux or capacity among the different modules cause a loss of dynamic capacity of the whole system. On the other hand, connection in series improves breakthrough behavior, but increases the flow resistance. Since our fibers have very high flux values (>6000 l.m-2.h-1bar-1) the later is no limitation for operating the mixed matrix fibers in a serial mode.
105
Chapter 5
According to the Equations 5.2 and 5.3 for the lowest applied flow rate 65 l.m-2.h-1, pore size 1 µm and a LZ diffusion coefficient of 1.13x10⁻¹⁰ m2/s [24] the value of radial Peclet number, Per is below 0.0003 whereas the value for Pea is higher than 75. This means according to Tejeda that for our system the radial and axial diffusion resistances can be neglected [15]. By operating the fibers in a serial mode the residence time in the adsorptive matrix increases. This has a positive effect on the axial diffusion resistance, which increases proportional with the residence time. Linking up together 5 single fibers modules proved to be very effective for LZ-binding. After permeating 130 ml LZ solution, which represents about 75 bed volumes, there was still no breakthrough.
Figure 5.11 shows the influence of the linear velocity on the dynamic adsorption capacity. When the adsorption is independent of the flow rate, it means that all particles are reached by convective flow and that the elution rate over the whole fiber length is constant. When a system is very sensitive to the flow rate it means that a lot of active sites are not reached by convection but by slow diffusional processes or that slow binding kinetics are dominating the adsorption process. This slow diffusion controlled adsorption is the main draw back of packed bed systems. Kubota found for a packed bed (DEAE functionalized Sepharose FF) a 72 % lower BSA adsorption capacity by a four fold increase in flow rate [17].
0.6 Adsorption capacity, DBC10% [mg LZ/g fiber]
250
0.5
Ct/C0
0.4
0.3
static capacity
1500
200
1000
150
100
200
50
0 0
50
0.2
100
150
200
150
250
Flow rate [BV/h]
65 l/m2h
0.1
0.0 0
40
80
120
160
200
240
280
loading lysozyme [mg/ml resin]
Figure 5.11 LZ dynamic breakthrough data for a series of 5 hollow fiber membranes as a function of the loading velocity. The LZ feed concentration is 1 mg/ml in 50 mM PBS buffer, pH 7.4.
106
Particle loaded adsorptive hollow fibers
Figure 5.11 shows that in our hollow fiber concept the loss in adsorption capacity is only 35 % by a 20-fold increase in flow rate. According to the manufactures, the commercially available adsorber membranes do not show adsorption capacity-flow dependence. However, literature revealed breakthrough values depending on the protein filtration flow rates for ovalbumine and lysozyme [25-27]
Optimal fiber length The loss in dynamic capacity can also be caused by the axial dependency of the permeate flux, which originates from the axial pressure drop in the bore of the fiber. This pressure drop in axial direction is due to friction of the liquid with the fiber wall. The result is that the permeate flux decreases over the length of the fiber (Figure 5.12). This leads to early saturation of the active sites located in the first part of the module, while binding sites located farther on in the fiber still have free binding sites. This results in product binding and breakthrough occurring simultaneously, destroying the resolving power of the adsorptive hollow fiber. To obtain a good breakthrough behavior, which means fully utilization of the embedded functionalities without product loss, it is important that the permeate flow profile over the whole length of the hollow fiber is almost constant. permeate flux
feed
Figure 5.12 Visualization of the drop in permeate flow as function of the hollow fiber length.
The axial pressure drop is a function of the flow rate (velocity) of the fluid in the fiber. The higher the flow rate, the higher the pressure drop. The flow rate in the fiber depends on the permeate flux, which in turn is a function of the applied pressure and the permeability of the fiber. Furthermore, the pressure drop increases with decreasing diameter of the fiber. To study the influence of the axial pressure drop for a range of fiber diameters and membrane permeabilities, the maximum length of the fiber was calculated at which the pressure drop was 10 %. We assume that using this condition the axial pressure drop 107
Chapter 5
contribution to the preferential flow is of minor importance in comparison to the contributions of variations in porosity and wall thickness. The problem can be solved with a system of two coupled differential equations. The first equation uses Darcy’s law to describe the change of the axial flow rate as a function of the position (x) in the fiber (Eq. 5.7). The second equation (Eq. 5.8) uses the Fanning equation to calculate the pressure drop as a function of the flow rate. The equation assumes a laminar flow in a tube. d 2 P(x) r ʌ ĭ(x) = � dx Ș Rm
Eq. 5.7
d 8.0 ĭ(x) Ș P(x) = � dx ʌ r4
Eq. 5.8
The first boundary condition was: P(x=0) = 4·104 Pa, which is the typical operating pressure for the modules. The second boundary condition is that at the axial flow rate at the end of the fiber is 0: ĭ (L)=0. The system of the two equations was solved analytically using Maple V8.0. From the obtained solution for P(x), see Eq. 5.9, L was solved for a pressure drop of 10% (P/P(0) = 0.9). The value for L is a function of the bore diameter and the permeability as is shown in figure 5.13.
P 2e = § ¨ P(0) ¨ e
§ ¨ -4L ¨ ¨ §¨ 3 ·¸ ¨ r © 2 ¹ Rm ©
· ¸ ¸ ¸ ¸ ¹
Eq. 5.9
· ¸
-8L ¸ ¨ ¸ ¨ §¨ 3 ·¸ ¸ ¨ r© 2 ¹ R ¸ m¹ ©
+1
The bold line (3600 l źh-1źm-2bar-1) in the Figure 5.13 represents the highest LZ permeate flux used in this chapter (1500 l źh-1źm-2). Using these conditions the active filtration length of the hollow fiber should be less than 0.15 m. This value is somewhat lower than the applied length of the fiber modules.
108
Particle loaded adsorptive hollow fibers
0.8
2
permeability l/m .h.bar 1200 1440
Module length [m]
0.6
1800 2400
0.4
3600 4800
0.2
14400
7200 this study
0.0 0
200
400
600
800
1000
1200
Bore diameter [µm]
Figure 5.13 The maximal filtration length of an adsorptive hollow fiber represented as function of the bore diameter and permeability. The axial pressure drop in the fiber is 10%.
Since in our dynamic adsorption experiments we are connecting series of 5 hollow fiber modules, this affects only the last fiber of the series. The overall loss in dynamic adsorption capacity will therefore be more dictated by the variation in wall thickness but especially by the variation in porosity of the fiber.
Protein desorption The adsorption-desorption cycle for a series of 5 hollow fiber modules is presented in Figure 5.14. The feed solution containing 1 mg LZ/ml in 50 mM PBS buffer pH 7.4 was permeated through the hollow fibers at a constant flow rate of 8 BV/h. The obtained dynamic capacity at 10 % breakthrough of about 230 mg/g fiber slightly surpasses the maximum adsorption capacity measured in the static mode. This may be due to a better accessibility of LZ to the functional sites during permeation. This means that within the time frame all the active sites located in the interior of the fiber are accessible and therefore occupied by the protein molecules. After reaching the breakthrough point the membrane series was disconnected and the individual modules are drained and rinsed with adsorptive buffer. Then the modules were reconnected for performing the desorption step at a higher flow rate (36 BV/h) using a 0.5 M NaCL eluent. The LZ concentration in the first eluted fraction was more than 15 fold increased when compared with the initial feed
109
Chapter 5
concentration. This offers perspectives for the adsorber membranes to function both as purifier and concentrator. 20
LZ concentration [mg/ml]
adsorption
washing
desorption
16
12
8
4
0 0
50
100
150
200
250
300
Effluent volume [ml]
Figure 5.14 Typical LZ breakthrough and elution curves for a series of 5 hollow fiber modules. The adsorption is performed with a flow rate of 15 ml/h (8 BV/h), trans membrane pressure 0.25 bar, with a 1mg LZ/ml solution containing 50mM PBS buffer, and pH 7.4. Desorption is carried out by adding 0.5M NaCl to the adsorption buffer. The flow rate during elution was 36 ml/h (20 BV/h).
Mixed matrix hollow-fiber membranes for lysozyme separation Figure 5.15 presents the results obtained by injecting the CEW feed solution (A), the different collected permeate samples (B-C) and the eluted protein sample (E) into a BiosuiteTM column. Chromatogram A (feed solution) shows the existence of two peaks, the large one corresponding to the low iso-electric point proteins in the egg white solution (the albumin fraction) and due to its low concentration in the feed a much smaller lysozyme peak.
110
Particle loaded adsorptive hollow fibers
A.U.
Albumin fraction 1.0 0.8 0.6 0.4 0.2 0.0 1.0 0.8 0.6 0.4 0.2 0.0 1.0 0.8 0.6 0.4 0.2 0.0 1.0 0.8 0.6 0.4 0.2 0.0
Lysozyme A
B
C
D
1.0 0.8 0.6 0.4 0.2 0.0
E 1.0
2.0
3.0
4.0
5.0 6.0
7.0
8.0
9.0 10.0 11.0 12.0 13.0
Minutes
Figure 5.15 Chromatograms of the feed (A), the collected permeate samples (B-C), unified permeate samples (D) and the eluted sample (E) injected into a Waters 717 plus HPLC system equipped with a Biosuite™ CM 10 µm CXC cation-exchange column
Chromatogram B shows a typical analysis of the collected permeate fractions until the LZ breakthrough point. Since the peak area of the albumin fraction is (within the error limits) equal to the one in the feed, one can conclude that the low isoelectric point proteins did not bind to the adsorber but passed almost unhindered through the membrane. Meantime, the lysozyme concentration in the permeate samples was below the HPLC detection limit (5 µg LZ/ml). The missing peak indicates that all the lysozyme was fully adsorbed into the hollow-fiber membrane. Hence we conclude that for the permeation of CEW protein mixture at pH 7.4, the hollow-fibers adsorb a major proportion of LZ due to opposite protein/membrane charge while the albumin fraction is adsorbed to a significantly smaller extent. The LZ breakthrough curve is, within the experimental errors, similar with the one for single component adsorption. The albumin fraction passes very fast through the membrane and its average concentration into the permeate was practically equal with the feed concentration while the LZ was still totally adsorbed into the matrix.
111
Chapter 5
At a certain point, depending on the module capacity (fiber length, number of hollowfibers in series) and the operational parameters (flow rate, initial protein concentration and ionic strength), the lysozyme concentration in the eluent increases (Figure 5.15C) and the LZ peak appears in the chromatogram. All the collected fractions, until the lysozyme concentration in the permeate was 50 % of the feed value were combined and re-injected into the HPLC system. Chromatogram D represents the analysis of the unified samples, showing an extremely small lysozyme peak. In order to dissociate the protein-membrane complex, the adsorbed proteins were consecutively eluted at a constant flow rate with 50 mM phosphate buffer containing 0.5 M NaCl. The LZ recovery was calculated by numerical integration over the elution curves and resulted in almost 95 % recovery (Figure 5.16). Furthermore, based on 80 % recovery the lysozyme was concentrated on average 10-fold into the desorptive buffer offering perspectives for the prepared hollow-fiber membranes to function both as purification as well as concentration media. Meantime, the concentration of the low isoelectric point proteins into the desorptive buffer was about 30 times lower than the albumin feed concentration (see also Figure 5.15E). This means a separation factor of about 150 for the protein desorption step.
100 concentration desorption
8
80
6
60
4
40
2
20
0
LZ desorption [ % ]
Eluent concentrtation [mg LZ/ml]
10
0 0
10
20
30
40
50
60
Eluent volume [ml]
Figure 5.16 Elution curve for the adsorbed proteins into the mixed matrix hollow-fibers at a constant filtration flow rate of 200 l źh-1źm-2and an ionic strength of 150 mM. (LZ concentration in the feed is 0.35mg/ml)
One can also estimate the purification factor, which is the ratio of the LZ purity in the eluate divided by the LZ purity in the feed, for the separation of LZ from CEW (also 112
Particle loaded adsorptive hollow fibers
referred by other authors as the purification effectiveness). After one single adsorptiondesorption cycle using the prepared hollow-fiber membranes, the lysozyme concentration increased from about 3 % in the feed solution to around 83 % in the desorptive buffer, which is sufficient high for food applications. This leads to a LZ purification factor of about 27 at 95 % LZ recovery. When comparing the values of the LZ separation obtained with the mixed matrix hollowfiber membranes with data reported in the literature, the first thing that draws attention is the high flux values in our research ranging from 65 to 1500 l źh-1źm-2. Whereas Fang et al. [28] reported permeate fluxes of 74 l źh-1źm-2 with polysulfone based cation-exchange membranes in a plate-and-frame stack of 9 by 9 cm. The obtained dynamic LZ capacity of 15 mg/ml was only 44 % of the determined static value. Separation of lysozyme by ultrafiltration was also widely investigated in the recent years. Ghosh [29] reports egg white filtration for LZ recovery using 25 kDa and 50 kDa polysulfone membranes operated with permeate rates of 26 and 72 l źh-1źm-2. The authors obtained recoveries of 88 % with the 50 kDa membrane and only 62 % for the 25 KDa membrane. The purities were 91 and 99% respectively. About the same data were reported by Wan et al. [30] by applying membranes with a cut off value of 30kDa. Using a flow rate of 66 l źh-1źm-2 they obtained a purity of 82 %. Wei [31] used high flux monolithic columns operated at 3 ml/min (= 15 bed volumes per hour) and obtained a dynamic capacity of 3.6 mg/ml. In a second paper Ghosh et al. [32] applied PS hollow-fibers with a cut-off of 30 kDa in a cross-flow mode. At the highest reported cross flow velocity of 0.6 m/s they obtained a permeate flux 26 l źh-1źm-2 and LZ purity ranging from 80 to 90 %. Yilmaz et al. [33] reported high adsorption capacities using Reactive Green 19 green immobilized chitosan composite membranes. However they only performed incubation experiments in which they achieved an adsorption capacity of 60.8 mg/ml membrane with recoveries slightly over 80 %. With these in mind, one can conclude that the proposed principle of the particle loaded hollow-fibers is a viable alternative for the separation of lysozyme from chicken egg white. The membranes offer high fluxes values combined with a high dynamic capacity. Dynamic LZ adsorption capacities of 60 mg/ml were obtained similar to the highest static membrane adsorber data reported in literature. The membranes are showing similar separation factors and LZ recoveries with the best data reported in the literature for similar operating conditions. 113
Chapter 5
Dynamic IgG adsorption For investigating the hollow fiber performance with a high molecular weight component IgG,(158 kDa) was dissolved in a 50 mM acetate buffer at pH 5.0. According to literature the diffusion coefficient of IgG is with 4.3x10⁻¹¹ m2/s § 2.5 times lower than that of LZ [24]. This means that using the same hydrodynamic conditions the adsorptive module is in comparison with LZ less affected by radial dispersion (Eq. 6.2) but it is more sensitive for axial dispersion (Eq. 5.3). However since the flow rate in IgG test with 26 BV/h was somewhat higher than 8.0 BV/h in the LZ test, the Pea value is around 90. This value is above the critical value of 25 given by Liu [11] and 40 given by Tejeda [15] and Suen [13] in which conditions dispersion effects can be neglected.
0.5
0.4
Ct/C0 [ - ]
0.3
0.2
5
3
2
0.1
8 fibers
0.0 0
20
40
60
80
100
Protein loading [mg IgG/g fiber]
Figure 5.17 IgG breakthrough curves for the prepared adsorptive membranes as a function of number of fibers in series. The individual fibers have a filtration length of about 16 cm and an inner diameter of 500 µm and an outer diameter of 1500 µm. The modules were operated at constant flow rate of 25 cm/h (26 and 105 BV/h), 50 mM acetate buffer pH 5.0.
By linking up together more than 5 fibers and operating them at 25 cm/h (42 BV/h) the dynamic capacity at 10% breakthrough exceeds 70 mg/g of fiber, equivalent with about 22 mg/ml fiber (Figure 5.17). The obtained value exceeds the highest adsorption capacities reported in literature using the same flow conditions ranging from 7 to 13 mg/ml for agarose type beads and 15 to 18 mg IgG/ml for other media [34]. As also expected from the LZ breakthrough data linking up together 5 fibers in series was sufficient to obtain a sharp breakthrough curve.
114
Particle loaded adsorptive hollow fibers
Besides the fact that the concentration of proteins are usually significantly above the overall association constant of ligand/protein equilibria leads to fast binding kinetics, even in dilute protein concentrations. This feature makes membrane chromatography especially interesting for processing of dilute solutions without lowering the process yield, as in the case with diffusion limited gel systems.
CONCLUSIONS The prepared adsorptive hollow fiber membranes are an attractive alternative for the chromatographic packed bed systems. They can operate under high flow rates maintaining a high adsorption capacity. Co-extrusion proved to be a good tool to prevent particle loss during operation and to lower the mass transfer resistance by opening the dense skin layer. A drawback of the hollow fiber membranes is the flow maldistribution caused by variations in wall thickness and porosity. Because of a pressure drop in the bore side a decline in perfusion rate in the axial direction can also occur. The preferred flow creates early local saturation of the adsorption sites, which results in early ligate breakthrough. In this study we were able to cancel out the effects of flow maldistribution by linking up together series with a different number of hollow fibers. Due to their high permeability (> 6000 l źh-1źm-2bar-1) there is no pressure limitation in doing so. We proved that by linking together 3 to 5 hollow fibers a very steep breakthrough curve can be obtained. The dynamic LZ adsorption capacity using an elution rate of 17 bed volumes per hour exceeded 200 mg/g fiber (60 mg LZ/ml membrane), similar with the value obtained in 24 hours of static adsorption. When increasing the flow rate up to 255 BV/h, the dynamic capacity shows only a slight decrease. In the desorption step up to a 15 fold increase in lysozyme concentration was obtained with over 90% recovery. The loss in dynamic capacity caused by the axial dependency of the permeate flux is related to the fiber diameter and the fiber permeability. For the applied fibers with a bore diameter of 500 µm and a permeability of 3600 l źh-1źm-2źbar-1 is calculated that the axial pressure drop is 10 % using an effective filtration length of 15 cm. It is assumed that the generated preferential flow because of that does not significantly contributes to the preferential flow in relation to the contributions caused by variation is thickness and porosity. Repeated adsorption/desorption cycles showed no significant loss of LZ capacity. Selective adsorption of LZ into the cation adsorber membrane allows its separation from the 115
Chapter 5
complex CEW protein mixture with an average separation factor of 150, calculated over the filtration run until the LZ breakthrough of 10% of the feed concentration. The lysozyme was purified 27-fold in a single step with recoveries of 95%. Since the protein was, based on 80% recovery, concentrated on average up to 5-fold in the eluent, the mixed matrix membranes function also as a concentration medium. By applying this linking up together concept for the recovery of high molecular IgG, the obtained data (using similar hydrodynamic conditions 42 BV/h) are exceeding the highest data reported in literature for packed bed systems. Because of the surface to volume ratio and the low contribution of diffusive pores, the hollow fiber adsorber can operate at much lower residence times than the packed bed systems. This often translates to simpler equipment and safer operations. Compared to flat sheet configuration where 30 layers are necessary for an efficient ligand utilization series of 3 to 5 hollow fibers are sufficient for constructing adsorbers with a good adsorptive performance.
REFERENCES 1.
Iwata, H., K. Saito, and S. Furusaki, Adsorption characteristics of an immobilized metal affinity membrane. Biotechnology Progress, 1991. 7: p. 412-418. 2. Ghosh, R., Protein separation using membrane chromatography: opportunities and challenges. Journal of Chromatography A, 2002. 952: p. 13-27. 3. Thömmes, J. and M.R. Kula, Membrane Chromatography - An Integrative Concept in the Downstream Processing of Proteins. Biotechnology Progress, 1995. 11(4): p. 357-367. 4. Brandt, S., et al., Membrane-Based Affinity Technology for Commercial Scale Purifications. BioTechnology, 1988. 6(7): p. 779-782. 5. Unarska, M., et al., Comparative-study of reaction-kinetics in membrane and agarose bead affinity systems. Journal of Chromatography, 1990. 519(1): p. 53-67. 6. Avramescu, M.E., W.F.C. Sager, and M. Wessling, Functionalised ethylene vinyl alcohol copolymer (EVAL) membranes for affinity protein separation. Journal of Membrane Science, 2003. 216(1-2): p. 177-193. 7. Klein, E., et al., Affinity adsorption devices prepared from microporous poly(amide) hollow fibers and sheet membranes. Journal of Membrane Science, 1997. 129: p. 31-46. 8. Shinano, H., et al., Ion-Exchange of Lysozyme during Permeation across a Microporous SulfopropylGroup-Containing Hollow Fiber. Biotechnology Progress, 1993. 9(2): p. 193-198. 9. Nash, D.C., G.E. McCreath, and H.A. Chase, Modification of polystyrenic matrices for the purification of proteins Effect of the adsorption of poly(vinyl alcohol) on the characteristics of poly(styrenedivinylbenzene) beads for use in affinity chromatography. Journal of Chromatography A, 1997. 758(1): p. 53-64. 10. Avramescu, M.E., et al., Preparation of mixed matrix adsorber membranes for protein recovery. Journal of Membrane Science, 2003. 218(1-2): p. 219-233. 11. Liu, H.C. and J.R. Fried, Breakthrough of lysozyme through an affinity membrane of cellulose-cibracron blue. AIChE Journal, 1994. 40(1): p. 40-49. 12. Awade, A.C., On hen egg fractionation: Applications of liquid chromatography to the isolation and the purification of hen egg white and egg yolk proteins. Z. Lebensm. Unters. Forsch., 1996. 202(1): p. 1-14.
116
Particle loaded adsorptive hollow fibers
13. Suen, S.Y. and M.R. Etzel, A mathematical analysis of affinity membrane bioseparations. Chemical Engineering Science, 1992. 47(6): p. 1355-1364. 14. Smolders, C.A., et al., Microstructures in Phase-Inversion Membranes.1. Formation of Macrovoids. Journal of Membrane Science, 1992. 73(2-3): p. 259-275. 15. Tejeda, A., et al., Optimal design of affinity membrane chromatographic columns. Journal of Chromatography A, 1999. 830(2): p. 293-300. 16. Kubota, N., et al., Comparison of two convection-aided protein adsorption methods using porous membranes and perfusion beads. Biotechnology Progress, 1996. 12(6): p. 869-872. 17. Kubota, N., et al., Comparison of protein adsorption by anion-exchange interaction onto porous hollowfiber membrane and gel bead-packed bed. Journal of Membrane Science, 1996. 117: p. 135 - 142. 18. Kim, M., et al., Adsorption and elution of bovine gamma-globulin using an affinity membrane containing hydrophobic amino-acids as ligands. Journal of Chromatography, 1991. 585(1): p. 45-51. 19. Garke, G., et al., The influence of protein size on adsorption kinetics and equilibria in ion-exchange chromatography. Separation Science and Technology, 1999. 34(13): p. 2521 - 2538. 20. Sun, H., et al., A study of human [gamma]-globulin adsorption capacity of PVDF hollow fiber affinity membranes containing different amino acid ligands. Separation and Purification Technology, 2006. 48(3): p. 215. 21. Zhang, Y.Z., et al., Adsorption behavior of cation-exchange resin-mixed polyethersulfone-based fibrous adsorbents with bovine serum albumin. Desalination, 2006. 192(1-3): p. 224-233. 22. Albrecht, W., et al., Formation of porous bilayer hollow fibre membranes. Macromolecular Symposia, 2002. 188: p. 131-141. 23. He, T., et al., Preparation of composite hollow fiber membranes: co-extrusion of hydrophilic coatings onto porous hydrophobic support structures. Journal of Membrane Science, 2002. 207(2): p. 143-156. 24. Tyn, M.T. and T.W. Gusek, Prediction of diffusion coefficients of some binary liquids. Biotechnology and Bioengineering, 1990. 35: p. 327 - 338. 25. Saiful, Z. Borneman, and M. Wessling, Enzyme capturing and concentration with mixed matrix membrane adsorbers. Journal of Membrane Science, 2006. 280(1-2): p. 406-417. 26. Santarelli, X., et al., Characterization and application of new macroporous membrane ion exchangers. Journal of Chromatography B: Biomedical Sciences and Applications, 1998. 706(1): p. Pages 13-22. 27. Shiosaki, A., M. Goto, and T. Hirose, Frontal Analysis of Protein Adsorption on a Membrane Adsorber. Journal of Chromatography A, 1994. 679(1): p. 1-9. 28. Fang, J.K., et al., Preparation of polysulfone-based cation-exchange membranes and their application in protein separation with a plate-and-frame module. Reactive & functional polymers, 2004. 59(2): p. 171183. 29. Ghosh, R. and Z.F. Cui, Purification of lysozyme using ultrafiltration. Biotechnology and Bioengineering, 2000. 68(2): p. 191-203. 30. Wan, J.H., J.R. Lu, and Z.F. Cui, Separation of lysozyme from chicken egg white using ultrafiltration. Separation and Purification Technology, 2006. 48(2): p. 133-142. 31. Wei, Y., et al., Preparation of a monolithic column for weak cation exchange chromatography and its application in the separation of biopolymers. Journal of Separation Science, 2006. 29: p. 5-13. 32. Ghosh, R., S.S. Silva, and Z. Cui, Lysozyme separation by hollow-fibre ultrafiltration. Biochemical Engineering Journal, 2000. 6(1): p. 19-24. 33. Yilmaz, M., G. Bayramoglu, and M.Y. Arica, Separation and purification of lysozyme by Reactive Green 19 immobilised membrane affinity chromatography. Food Chemistry, 2005. 89(1): p. 11-18. 34. Hahn, R., R. Schlegel, and A. Jungbauer, Comparison of protein A affinity sorbents. Journal of Chromatography B, 2003. 790: p. 35-51.
117
118
CHAPTER 6
SELECTIVE REMOVAL OF POLYPHENOLS AND BROWN COLOR FROM APPLE JUICES USING PES/PVP MEMBRANES IN A SINGLE-ULTRAFILTRATION PROCESS
ABSTRACT Custom-made membranes made of polyethersulphone (PES) and polyvinylpyrrolidone (PVP) were studied and compared with commercial regenerated cellulose membranes to reduce the amount of polyphenols and yellowish-brown color pigments in model solutions and apple juice. PES/PVP-membranes were prepared with different pore sizes by varying the PES/PVP composition. At a pressure of 1 bar no water flux was obtained through the membrane without PVP. In comparison with regenerated cellulose membranes the PES/PVP membranes were found more effective for the reduction of polyphenols, as well as discoloration. The flux was also remarkably higher. Polyphenol removal rates from the model solution were up to 40 % for a membrane prepared out of a solution with 22.5 wt% polymer in which the PES/PVP ratio is 3.5. Initial adsorption and flux values could be restored easily by regenerating the membranes in 0.1 M NaOH solution for 30 min.
119
Chapter 6
INTRODUCTION Ultrafiltration (UF) has gained in importance for clarification of fruit juices during the last ten years. Among the advantages introduced into the juice industry with UF, avoidance of filtering aids is the most important one in terms of cost saving [1-8]. However, clear juices and concentrates processed using UF are not always stable during storage. Unfavorable changes, e.g., haze formation and coloration may occur during storage causing loss of product quality. Polyphenols have been found to be responsible for these problems [7,913] because they are relatively small molecules that can easily pass through the membranes during UF processing. A number of agents, including gelatine/bentonite, activated carbon, casein, ion-exchange waxes and polyvinylpolypyrrolidone (PVPP), have been studied for the removal of polyphenols from fruit juices [10,13-16]. However, these are all batch processes which lead to additional costs in the existing processing line. In the last decade, PVPP stabilization of the juices after UF has been well established in the juice industry. PVPP which is crosslinked polyvinylpyrrolidone (PVP), is a well-known adsorbent for polyphenols [8,13,15]. The regenerative use of PVPP due to its insolubility in water is the most important reason for its acceptance in the juice processing industry. In this study, custom-made membranes in different compositions of polyethersulphone (PES) and polyvinylpyrrolidone (PVP) were studied to reduce the total amount of polyphenols and the yellowish-brown color in model solutions and apple juice. Adsorption and regeneration capacity of the membranes were also determined. An additional article, [17], focusing on the stabilization of apple juice is published in the Journal of Food Science.
120
Selective removal of polyphenols and brown color …
MATERIALS AND METHODS
Membrane materials Membranes were prepared using polyethersulphone, PES, (Mw 43 kDa BASF) and polyvinylpyrrolidone, PVP, (K90), (Mw 360,000 Acros Organics). As solvent, 1-methyl-2pyrrolidone (NMP Acros Organics) is used. For the post-treatment, sodium hypochlorite (Merck, technical grade) is used. The commercial regenerated cellulose membranes were supplied by Millipore and have cut-off values of 10 kDa and 100 kDa.
Model solution A model solution containing 500 mg total polyphenol per liter was prepared using the analytical standards of the following polyphenols (+)-catechin (100 mg/l), (-)-epicatechin (100 mg/l), chlorogenic acid (100 mg/l), phloridzin (50 mg/l), gallic acid (50 mg/l), ferulic acid (50 mg/l), and p-coumaric acid (50 mg/l). These polyphenols, commonly present in apple juices, were supplied by Sigma.
Apple Juice In order to determine the effects of membranes on removal of yellowish-brown color, clear apple juices were obtained from the local market and used without any further treatment.
Membrane preparation Flat sheet phase inversion membranes were prepared by casting a polymer solution at 50 °C with a casting knife of 100 µm on top of a glass plate followed by immersion in a non-solvent bath (water). The polymer solutions were prepared by mixing polymer, additives and solvent for 24 h at 50 °C. PES is used as the membrane forming polymer because of its good chemical and mechanical properties. Besides that, it is also blendable with PVP. PVP is used being a good adsorbent for polyphenols and it possesses the property of improving the interconnectivity of pores in membranes. Water (a non-solvent for PES) is added to the casting solution to enhance the demixing in order to induce the formation of smaller pores. NMP is a good solvent for both PES and PVP. After the membranes were formed they were rinsed for 48 hours in a water bath to remove any
121
Chapter 6
remaining traces of solvent. To avoid flux decline, due to swelling, the membranes were post-treated with sodium hypochlorite as described by Wienk et al. [18].
Table 6.1
Compositions of the polymer solutions.
Membrane
PES (%)
PVP (%)
H2O (%)
NMP (%)
A
22.5
7.5
5.0
65.0
B
22.5
5.0
5.0
67.5
C
17.5
5.0
5.0
72.5
D
22.5
0.0
5.0
72.5
Cryo-Scanning Electron Microscopy (cryo-SEM) In general the structure of membranes can be studied using SEM. In order to prevent both the contamination of the microscope and preservation of the high vacuum necessary inside during measurement (10-7 Bar), the samples are often dried. However, the main disadvantage of drying is uncontrolled shrinkage of the membrane material, leading to undesired changes in morphology of the membrane. To have a better and more realistic view of the membrane structure in its working environment we examined the membranes with cryo-SEM. The advantage of cryo-SEM is that samples are examined in their most natural state. Instead of drying, the samples are quenched in a liquid nitrogen slush (under cooled nitrogen containing liquid and solid nitrogen). The freezing speed is so high, almost doubled when compared with liquid nitrogen (up to 1200 K/s) [19] that the water solidifies in the amorphous state. This minimizes the deformation of the sample. After the samples were frozen, they were fractured and subsequently the ice was sublimated to reveal the membrane structure. Finally the samples were gold coated and analyzed.
Ultrafiltration An Amicon model 8200 lab-scale filtration unit was used for the ultrafiltration experiments. Operating pressure was set and maintained at 1 bar to produce flux through the membranes. The volume of the filtration cell was 180 ml. The UF process was stopped when a concentration factor, (K) defined in equation (6.1), of six was reached. 122
Selective removal of polyphenols and brown color …
The concentration factor is defined as: K
Vi Vi � V p
Eq. 6.1
Vi = initial volume (ml) V p = permeate volume (ml)
Permeate was collected in 10 ml portions to determine changes of flux and polyphenol concentration with permeate volume. Afterwards the membranes were regenerated in 0.1 M NaOH solution for 30 minutes and rinsed with water. The adsorption capacity of regenerated membranes and water-flux rates were measured.
Analysis of Total Polyphenols Total polyphenols concentrations in the samples were determined using the FolinCiocalteau method reported by Rentschler and Tanner [20].
Color Color of apple juice samples was measured as the absorbance at 420 nm using a LKB Pharmacia model 4060 UV-VIS scanning spectrophotometer.
123
Chapter 6
RESULTS AND DISCUSSION Membrane characterization
Flux Clean water fluxes of the membranes were 18, 104 and 140 l/m2.h.bar for membranes A, B and C respectively. This order is in agreement with the polymer content or viscosity of the casting solution. And since membrane formation is related strongly to the viscosity of the original polymer solution also with this parameter. The amount of PVP, with a molecular weight about 9 times higher than PES, has a greater influence on the viscosity than the PES content. This explains the large difference in flux comparing membrane A and B (PVPcontent) and the relative small difference between B and C (PES-content). For the commercial membranes the fluxes were 60 (10 kDa) and 725 (100 kDa) l/m2.h.bar. At 1 bar no flux was obtained for membrane D that was made out of PES only. According to flux measurements and cryo-SEM photographs, PVP plays an important role in the membrane formation. In addition to the flux values (membrane D no measurable flux, membrane B 104 l/m2.h.bar) this can also be deduced from the scanning electron micrographs.
Cryo-SEM The cryo-SEM photograph (Figure 6.1D1) shows the morphology of a PES membrane, type D, a sub layer with large "fingerlike" cavities surrounded by closed cells. Figure 6.1D2 shows that this sub layer ends in a selective skin layer with a thickness of approximately 0.5 µm. Adding PVP to the polymer solution results in a drastic flux increase (membrane B). Figure 6.1B1 illustrates that the structure of the sub layer has been changed from a well defined sub-layer/skin part to a porous system with interconnective pores, its size decreasing gradually in the direction of the selective layer. Figure 6.1B2 shows that this sub-layer ends in a skin layer of approximately 3 µm thickness. As can be seen clearly this skin layer is less densified compared to the skin layer of the membranes containing PES only.
124
Selective removal of polyphenols and brown color …
D1
B1
D2
B2
Figure 6.1 D1 and D2) are cross-sections of membrane D; B1 and B2) are cross-sections of membrane B.
Model solutions Figure 6.2 shows the changes in flux and polyphenol concentration as a function of the permeate volume for model solutions. The concentration of polyphenols in the permeate streams collected as 10 ml portions increased as a function of permeate volume, whereas the flux rate slowly decreased. This indicated that adsorption of polyphenols caused fouling, leading to a decrease in permeate flux through the membranes. Membrane C was the most effective with respect to the removal of polyphenols from model solutions. Using this membrane 40 % of polyphenols could be removed. The removal percentages of polyphenols for membranes A and B were 35 and 34 %, respectively. Polyphenol removal using custom made membranes was better than that of the commercial membranes. Although the 100 kDa membrane showed higher flux rates, it exhibited no retention. Both flux rates and polyphenol retention were lower for the 10 kDa membrane when compared to the custom-made membranes.
125
Chapter 6
200
350 150 300
2
C 100
250 B
200
Flux [ l / m h bar]
polyphenol concentration [ppm]
400
50 A
150
100
0 0
50
100
150
Permeate volume [ml]
Figure 6.2 Change of flux and polyphenol concentration with permeate volume in the model solution. The symbols � � � are data of membrane A, B and C respectively. The open symbols are polyphenol data and the closed symbols are flux data.
Apple juice Fluxes for membranes A, B and C reached a steady state after approximately 50 ml of permeate volume (figure 6.3). Flux decline was still continuing, but no drastic decrease was observed beyond this point. This is a well-known problem of dead-end filtration systems.
200
350 150
100
250 C
200
50
2
300
Flux [ l / m h bar]
polyphenol concentration [ppm]
400
B
150
A
100
0 0
50
100
150
Permeate volume [ml]
Figure 6.3 Change of flux and polyphenol concentration with permeate volume in apple juice. The symbols � � � are data of membrane A, B and C respectively. The open symbols are polyphenol data and the closed symbols are flux data. It is well-known that UF membranes currently used by the juice industry do not cause any remarkable decrease in polyphenol content of apple juice during the clarification procedure. Giovanelli and Ravasini [10] have reported a 12 % reduction in phenolic
126
Selective removal of polyphenols and brown color …
content of apple juice by UF only. This is in agreement with our measurements for the 10 kDa membrane. Padilla and McLellan [3] have shown that decreasing the molecular weight cut-off of the membrane causes a more profound reduction of the phenolic content of ultrafiltrated apple juice. Others used the UF process in combination with PVPP stabilization or recently discovered adsorber resins. Schobinger et al. [21] have shown that PVPP stabilization and adsorber resins caused approximately 20 and 40 % polyphenol reduction, respectively. In this research polyphenol adsorption and flux decline were related during the filtration of apple juices. However, in comparison with the model solution, this relation was more distinct, as illustrated in figure 6.2 and 6.3. This was due to the additional adsorption of yellowish-brown color pigments. All membranes were found effective for a sufficient discoloration with an acceptable final color of ultrafiltrated apple juice. Figure 6.4 shows the changes of color with permeate volume ranging from 28% for membrane A to 45% for membrane C. Different authors use activated carbon and adsorber resins to improve color of apple juice. Maier et al. [22] have reported 25 to 65 % color reduction in apple juice using adsorber resins. Furthermore, a 22 to 47 % color reduction was obtained by Giovanelli and Ravasini depending on the amount of activated carbon [10].
Color Abs. at 420 nm [ - ]
0,25
0,20
0,15
0,10 0
50
100
150
Permeate volume [ml]
Figure 6.4 Change of color of apple juice with permeate volume. The symbols membrane A, B and C respectively.G
� � �
are data of
127
Chapter 6
Regeneration The custom made membranes that were fouled by adsorption of polyphenols and yellowish-brown color components of apple juice could be regenerated very well. Even 0.1 M NaOH solution was able to remove the adsorbed polyphenols and deposits.
initial flux rate flux after regeneration
100
2
Flux [ l / m .h.bar ]
150
50
0 A
B
C
Figure 6.5 Regeneration of water flux rates of the membranes with 0.1 N NaOH solutions. The membranes recovered their original white color and the flux was almost completely restored. Figure 6.5 shows water flux rates of regenerated membranes in comparison with their initial flux rates. It was also possible to restore the adsorption capacity completely. Table 6.2 shows the removal percentage of polyphenols in three consecutive filtration steps of the model solution through membranes.
Table 6.2
Regeneration of adsorption capacity of membranes in three consecutive filtration steps of model solution Membrane type
Custom-made “A” Custom-made “B” Custom-made “C”
128
Removal of polyphenols (%) first UF second UF third UF 37 37 31 34 35 33 42 39 40
Selective removal of polyphenols and brown color …
Finally, figure 6.6 shows the overall results comparing custom-made membranes with the commercial regenerated cellulose membranes. As can been seen, the flux of the 100 kDa membrane is much higher than the flux of the other membranes. Additionally, the 100 kDa membrane shows no retention of color and polyphenols. The custom made membranes however have both a higher fluxes and retention values when compared with the 10 kDa membrane.
725
2
waterflux (l/m .h.bar) removal of polyphenol (%) removal of color (%) 140
150
104 100 60 45
50 28 28
30 31
36
18
18
13 18
0 A
B
C
10 kDa