Particuology 21 (2015) 107–117
Contents lists available at ScienceDirect
Particuology journal homepage: www.elsevier.com/locate/partic
Particle size distribution in CPFD modeling of gas–solid flows in a CFB riser Qinggong Wang a , Timo Niemi b , Juho Peltola b , Sirpa Kallio b , Hairui Yang a , Junfu Lu a,∗ , Lubin Wei c a Key Laboratory for Thermal Science and Power Engineering of Ministry of Education, Department of Thermal Engineering, Tsinghua University, Beijing 100084, China b VTT Technical Research Centre of Finland, P.O. Box 1000, FI-02044 VTT, Finland c School of Chemical and Environmental Engineering, China University of Mining and Technology, Beijing 100083, China
a r t i c l e
i n f o
Article history: Received 2 December 2013 Received in revised form 18 June 2014 Accepted 24 June 2014 Keywords: Circulating fluidized bed riser Particle size distribution CPFD Numerical simulation
a b s t r a c t A computational particle fluid dynamics (CPFD) numerical method to model gas–solid flows in a circulating fluidized bed (CFB) riser was used to assess the effects of particle size distribution (PSD) on solids distribution and flow. We investigated a binary PSD and a polydisperse PSD case. Our simulations were compared with measured solids concentrations and velocity profiles from experiments, as well as with a published Eulerian-Eulerian simulation. Overall flow patterns were similar for both simulation cases, as confirmed by experimental measurements. However, our fine-mesh CPFD simulations failed to predict a dense bottom region in the riser, as seen in other numerical studies. Above this bottom region, distributions of particle volume fraction and particle vertical velocity were consistent with our experiments, and the simulated average particle diameter decreased as a power function with riser height. Interactions between particles and walls also were successfully modeled, with accurate predictions for the lateral profiles of particle vertical velocity. It was easy to implement PSD into the CPFD numerical model, and it required fewer computational resources compared with other models, especially when particles with a polydisperse PSD were present in the heterogeneous flow. © 2014 Chinese Society of Particuology and Institute of Process Engineering, Chinese Academy of Sciences. Published by Elsevier B.V. All rights reserved.
Introduction Because of its unique low pollutant emissions and fuel flexibility, the circulating fluidized bed (CFB) combustor has become an important and widely used technology; CFBs are not only used in energy conversion processes, but also in chemical and metallurgical industries (Li, Yang, Wu, Lu, & Yue, 2013). Flows in fluidized beds are inherently multiphase in character, involving at least one fluid phase and one particulate solid phase. In virtually all real life situations, the particles in the fluidized beds are polydispersed. On the one hand, the properties of the particle size distribution (PSD) can have a dramatic impact on the overall behavior of the particulate flow (Rao, Curtis, Hancock, & Wassgren, 2011). On the other hand, the chemical reactions, as well as physical processes inside the reactors, continually affect the size of these particles (Miller &
∗ Corresponding author. Tel.: +86 10 62794129. E-mail address:
[email protected] (J. Lu).
Schobert, 1993). Therefore, the gas–solid flow characteristics and the PSD patterns in a CFB riser will directly influence the distribution of combustion fractions and heat transfer efficiency, ultimately determining the final performance of the CFB boiler (Lu, Zhang, Zhang, Liu, & Yue, 2007). Hence, PSD in the riser is one of the most important factors to consider in CFB design (Yue et al., 2005). In recent decades, computational fluid dynamic (CFD) approaches have emerged as a popular tool in the development of fluidized bed technology. Since field measurements are hard or even impossible to carry out, experimental studies have been complemented by numerical studies, which model particulate flows (Hartge, Ratschow, Wischnewski, & Werther, 2009; Mazzei & Lettieri, 2008; Schneiderbauer, Aigner, & Pirker, 2012), combustion/gasification processes (Wischnewski, Ratschow, Hartge, & Werther, 2010), and pollutant emission control (Han, Schnell, & Hein, 2001). However, the complex nature of multiphase particulate flow makes this modeling process very challenging. One of the key problems in particulate flow modeling is how to implement a particle size distribution. Traditionally, the particle
http://dx.doi.org/10.1016/j.partic.2014.06.009 1674-2001/© 2014 Chinese Society of Particuology and Institute of Process Engineering, Chinese Academy of Sciences. Published by Elsevier B.V. All rights reserved.
108
Q. Wang et al. / Particuology 21 (2015) 107–117
phase has been modeled using only a mean particle size, disregarding other important characteristics of the PSD (He, Deen, van Sint Annaland, & Kuipers, 2009; Zhang, Lu, Wang, & Li, 2008). This minimizes computational expense, since modeling with a size distribution is computationally intensive. However, with the increase in computational power and improvement in modeling methods over the last few decades, implementing a PSD into these models has recently become a topic of interest. For example, in Eulerian-Eulerian (EE) schemes, a series of particle–particle drag models have been developed to describe interactions between different solid phases (Bell, 2000; Chao, Wang, Jakobsen, Fernandino, & Jakobsen, 2011; Gidaspow, Syamlal, & Seo, 1986; Lu, He, Gidaspow, Yang, & Qin, 2003; Mathiesen, Solberg, & Hjertager, 2000; Syamlal, 1987; van Sint Annaland et al., 2009). However, the reliability and the accuracy of these models are still in question, even for binary mixtures, especially when extended to polydisperse systems. In contrast, in Eulerian-Lagrangian (EL) schemes, a PSD can be readily incorporated for the particulate phase, with relatively little extra coding and computational effort; the properties of each individual simulated particle (e.g., diameter) can be freely designated. Particle-particle collision models, such as soft-sphere or hard-sphere models, are usually used to describe these interactions (Feng & Yu, 2007; Garg, Galvin, Li, & Pannala, 2012). Unfortunately, even with the much faster hard-sphere model, the amount of particles that can be simulated is still quite small for simulations of full-scale CFBs. As a result, EL methods are confined to simulate a limited number of particles, often with only 2D geometries. To overcome these limitations, an alternative computational particle fluid dynamics (CPFD) numerical scheme has been developed recently to compensate problems with the EE and traditional EL methods. It has been implemented in commercial CFD codes such as Barracuda VR® (CPFD Software, LLC, NM, USA). The CPFD method describes the fluid as a continuum (Eulerian) and the particles as Lagrangian, with proper size and density distributions (Snider, 2001). Fluid flow is modeled using Navier–Stokes equations, while particle momentum is modeled using an adapted multiphase-particle-in-cell (MP-PIC) numerical method. Mutual strong coupling occurs between the fluid and discrete particles. To reduce solution costs for large commercial scale reactors with billions of particles, a numerical particle is defined as a group of particles sharing the same properties, such as species, density, and size. Particle-particle collision forces are simulated by means of a spatial gradient, using a particle stress model to describe particle collisions. Under these conditions, a wide PSD in gas–solid flows can be simulated at low computational cost (Wang, Yin, Lu, Yang, & Wei, 2013). Comparable MP-PIC implementations are available in the open source codes MFIX (Garg & Dietiker, 2013) and OpenFOAM (OpenCFD Ltd., 2014), as well as in the Ansys Fluent CFD package (Ansys Inc., PA, USA), where it is known as the dense discrete particle model (DDPM) approach. The CPFD method was successfully used to simulate fundamental granular flows (Snider, 2007). It also has been used to simulate CFB risers. Chen, Werther, Heinrich, Qi, and Hartge (2013) concluded that a drag correction function should be included in the CPFD model to obtain acceptable vertical profiles of the solids volume fraction in the CFB riser, and to model the dense bottom bed. Li, Song, Benyahia, Wang, and Li (2012) applied the energy minimization multi-scale drag model to obtain a more realistic solids distribution in the CFB riser using the CPFD model. In the works of Chen et al. (2013) and Li et al. (2012), the large riser geometry required a coarse computational mesh. Benyahia and Sundaresan (2012) found that similar drag corrections were necessary in both EE and CPFD simulations carried out on coarse meshes. Thus, the
need for a drag correction in the studies of Chen et al. (2013) and Li et al. (2012) most likely arises from the failure of the coarse mesh to resolve the fine structures related to clustering in gas–solid flows. To validate the use of a CPFD method for CFB conditions, it is necessary to carry out simulations on a finer mesh, so that uncertainties related to the use of a coarse mesh are avoided. Using the related DDPM method, Adamczyk et al. (2014) carried out a simulation of a pilot scale CFB with a fine computational mesh. Qualitatively, the pressure profile obtained by Adamczyk et al. (2014) was reasonable, but the DDPM method clearly underestimated the particle concentration at the bottom of the riser. Given that the numerical implementations of the MP-PIC approach in the DDPM and CPFD schemes differ, conclusions on the validity of the CPFD method for CFB simulations cannot be drawn based on the DDPM simulations. Moreover, in the work of Adamczyk et al. (2014), the simulated results were only compared with measured pressure profiles, limiting the ability to draw conclusions on the validity of this approach. In this study, we carried out an independent evaluation of the CPFD method with more extensive experimental comparisons. Specifically, we used the CPFD numerical scheme to model the gas–solid flows in a small CFB riser, for which a sufficiently fine computational mesh could be used. Both a binary PSD case and a polydisperse PSD case were simulated to investigate the effects of PSD on flows. Our simulation results were compared with experiments, as well as with EE simulations for the same CFB riser used by Niemi (2012) using a simplified Eulerian description of the PSD. Effects of PSD predicted by the CPFD scheme were described. In addition, the effects of mesh resolution and division of particles in parcels were assessed to evaluate the validity of CPFD scheme for simulation of CFB riser flow.
Model and simulation conditions Gas–solid flow model The CPFD numerical scheme, incorporated into the Barracuda VR® software, was used to solve gas–solid flow in three dimensions. The gas phase was modeled as a continuum, while the solid phase was treated as Lagrangian computational particles. To reduce computational expense, each numerical particle was defined to represent a number of real particles of the same size. In our present simulations, three numbers of particle parcels (approximately 400,000, 540,000, and 890,000) were used to describe the particulate phase in the polydisperse PSD case; while in the binary PSD simulation, the number of parcels was 490,000. The particle–particle collision force was modeled using a particle stress model, with a self-adapting time step to speed up its execution. The interphase drag model described by Gidaspow (1994), based on the Wen–Yu model and standard Ergun equation, was used in this work (a similar combination of Wen–Yu and Ergun drag models was used by Niemi (2012) in the simplified EE simulations). A large eddy simulation (LES) turbulence model (Smagorinsky, 1963) also was applied in the simulation. Fluid velocity and pressure were coupled by a semi-implicit pressure correction equation derived from mass conservation equations. The SIMPLE algorithm was used to correct the pressure and the fluid velocity fields to satisfy the continuity equation of the fluid (Snider, Clark, & O’Rourke, 2011). Details of the gas–solid flow models used in the CPFD scheme can be found in our previous work (Wang et al., 2014), where the governing equations are given in full, and modeling parameters for a full-loop CFB model are determined.
Q. Wang et al. / Particuology 21 (2015) 107–117
109
Table 1 Modeling parameters used for the two simulated cases.
PSD
Bed mass (kg) Fluidization velocity (m/s)
Case 1: binary PSD
Case 2: polydisperse PSD
78% 255 m & 22% 416 m, with SMD: 279 m 2.85 2.25
75–710 m (Fig. 2), with SMD: 291 m 2.86 2.25
NB: PSD, particle size distribution; SMD, Sauter mean diameter.
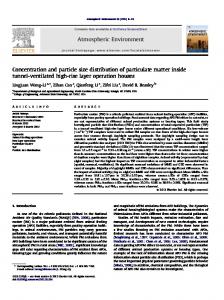
Fig. 2. Polydisperse particle size distribution used in the experiment.
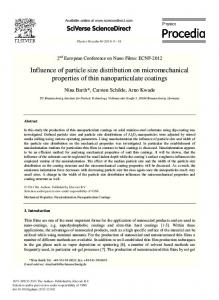
Fig. 1. Dimensions of the computational model used in the simulations.
Initial and boundary conditions The dimensions of the simulated small CFB riser are shown in Fig. 1. Compared with the real test rig described in Niemi (2012), our model excluded the solids separator, the return channel and the loop seal and included only a small part of the recirculation channel. The riser has a width of 40 cm and a height of 300 cm. The distance between the front and back walls of the riser is 1.5 cm. To capture local flow structures, a fine mesh size of 5 mm was used in the simulations. In addition, one simulation with a coarser mesh of 10 mm was carried out for the polydisperse PSD case to evaluate the effects of mesh spacing on our solution. A pressure outlet boundary condition with constant atmospheric pressure was set at the top outlet of the riser, while a flow boundary condition was defined at the bottom. The fluidizing air velocity and the total solid mass used in the simulation were set according to the experimental report (Niemi, 2012). The particle feeding rate at the inlet of the recirculation channel was automatically matched to the mass flow rate of particles leaving the riser during the simulation, to keep the total mass of particles constant. The PSD of the escaping particles was monitored from the start of the simulation using a programmed script and the incoming PSD was updated accordingly until a steady simulation state was achieved. Hence, the real particle circulation characteristics were fully matched in our simulations for a virtual-loop CFB system. For the particle–wall interactions, the normal-to-wall momentum retention coefficient was set as 0.3 and the corresponding tangential coefficient to 0.99. Both the binary PSD case and the more realistic polydisperse PSD case were modeled in our simulations, in accordance with experiments. The parameters used for both cases are given in Table 1.
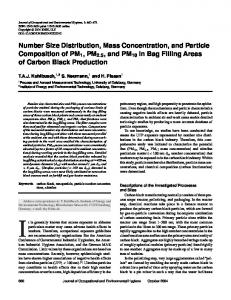
Cumulative PSD in the second case is shown in Fig. 2. Images shown in Fig. 3 illustrate the instantaneous solid distribution patterns in both experiments, as well as the instantaneous solids volume fraction distributions from the EE simulations for comparison. Each simulation was run long enough to reach steady state, and then for an extended period to compute the time-averaged results. In this work, the CPFD simulation cases reached steady-state after about 6 s. The time-averaging process began at 10 s, and the whole calculation lasted for 30 s. In the EE simulations, the average run time was 120 s. Results and discussion Binary PSD case Simulated flow patterns for the binary PSD case are shown in Fig. 4. The distributions of the instantaneous particle volume fraction at different time points reveal fine details in the flow structure; particle clusters and strands are clearly present. Importantly, the instantaneous particle flow patterns obtained using the fine mesh resolution in our simulations are similar to the flow structures generated in the experiments (Fig. 3). Characteristics of the timeaveraged particle concentration field are shown in Fig. 4(b). On average, simulated particles flow upwards in the center and fall down as clusters near the walls. Thus, particle concentration is higher in the bottom region of the riser, and becomes more diluted with increasing height. The CPFD simulation predicts that the highest solids volume fraction occurs higher up in the riser than in the experiments, where the maximum concentration of solids was below the level of the opening of the solids return channel. Distribution of the solids volume fraction as a function of riser height in our binary PSD simulation is compared with both experimental and the 2D EE simulated results from Niemi (2012) (Fig. 5). The 2D EE simulations neglect the effects of front and back walls on flow, which is clearly seen in these results. Comparisons of 2D and 3D simulations with mono-size particles indicate that 3D EE simulations produce more realistic flatter solid velocity profiles.
110
Q. Wang et al. / Particuology 21 (2015) 107–117
Fig. 3. (a) Images of instantaneous particle distribution patterns in the experiments with a binary (left) and polydisperse (right) PSD; and (b) snapshots of solid volume fraction distributions simulated by Eulerian-Eulerian method for the binary (left) and polydisperse (right) PSD (Niemi, 2012).
However, no 3D EE simulations for our particular PSD cases were carried out in Niemi (2012), which makes it difficult to draw conclusions about the merits of each simulation approach. Niemi (2012) used the direct quadrature method of moments (DQMOM) in the
EE scheme to deal with differently sized particles; thus, a momentum equation for a mixture was used for the solids. The differences between the velocities of particles with different sizes and the average mixture velocity were solved from algebraic equations.
Fig. 4. Instantaneous (a) and time-averaged (b) distributions of particle concentration for the binary PSD case (logarithmic scale).
Q. Wang et al. / Particuology 21 (2015) 107–117
Fig. 5. Mean solids volume fraction distributions as a function of height simulated using CPFD and EE methods for the binary PSD case.
Thus, Niemi’s EE method differs from a traditional EE simulation approach, where momentum equations are solved for each particle size separately, and consequently it is significantly faster but less accurate. A 5-mm mesh spacing was also used in Niemi’s EE simulations. In the experiments, particle velocities were determined by particle image velocimetry (PIV), and the particle volume fraction was estimated based on light intensity in the recorded images. Measurements were carried out in eight separate divisions to increase measurement resolution. These divisions are minor discontinuities as seen in the time-averaged profiles. Vertical profiles (Fig. 5) show that the EE simulation produced a very dense region close to the bottom of the riser, and that the particle concentration dropped very quickly as height increased. This trend is accurately reflects experimental observations (Fig. 3). In contrast, the CPFD simulation has a much lower particle concentration in the bottom section, and a slow decrease in concentration with increasing height. The distributions of the particle volume fraction between 0.5 and 1.25 m show good consistency between the different methods. For a more detailed comparison between
111
methods, the horizontal volume fraction profiles at four different heights are plotted in Fig. 6. The simulated distributions of particles in the lower regions of the riser show the largest deviation from the experiment, while good agreement is obtained in the higher regions. This difference is partly attributed to the fact that the measurement technique was not accurate for high solids volume fractions. Since particle volume fraction is estimated from light intensity in the PIV image frames, larger errors occur when the suspension is dense (Peltola, Kallio, Honkanen, & Saarenrinne, 2010). Typically, solid concentration is overestimated in regions, where clusters with densities close to the packing limit occur. In the binary mixture, particles with different diameters show segregation (Fig. 7). Large particles are mainly distributed in the lower parts of the riser, while small particles are entrained to higher regions. The distribution of mean particle diameter as a function of height is shown in Fig. 8. In the EE simulation, particle diameter is evenly distributed below 1.5 m-height, while above 1.5 m, mean particle diameter decreases. Thus, the higher suspension density at the bottom of the riser reduces the segregation tendency of particles because of stronger particle–particle interaction forces. This could also explain differences between the EE and CPFD simulation results. In addition, the 2D geometry of the EE simulation could contribute to these differences. In the CPFD simulation, particle segregation is more obvious, resulting in a steady decease in particle size with increasing height; this can be described with a power-function. The time-averaged mean diameter of particles in the outflow was 260 m in the CPFD simulation, while the experimental samples from the loop seal had a mean diameter of 264 m, demonstrating that a good approximation was obtained for the circulation. In the EE simulation, the average particle size at the outlet was 266 m, while at the bed bottom it was 304 m, close to the measured value of 306 m. No average particle size information is available as a function of riser height from the experiments, so the shape of the actual diameter profile is not known. The horizontal profiles of the vertical component of timeaveraged solid velocity at four different heights in the riser are shown in Fig. 9. These velocities are mass-weighted (Favre)
Fig. 6. Mean solids volume fraction profiles at different heights for the binary PSD case.
112
Q. Wang et al. / Particuology 21 (2015) 107–117
is satisfactorily predicted in the 3D CPFD simulation, but not in the 2D EE simulation. Overall, the simulated velocities show quite good agreement with the experiments, especially at lower heights, where the 3D CPFD method exhibits greater accuracy than the 2D EE method. However, if the bed density predicted by CPFD was as high as that observed in the experiment, then this might also affect the velocity profiles, and this good agreement may be coincidental. Despite this concern, profiles of particle volume fraction (Fig. 6) and the core-annulus flow structure in the CFB riser are reproduced in the CPFD simulation. Polydisperse PSD case
Fig. 7. Instantaneous distributions of large and small particles for the binary PSD case (red: large particles; blue: small particles).
Fig. 8. Mean particle diameter as a function of riser height for the binary PSD case.
averages. Although measured values may be slightly distorted by overestimation of solid density in dense region, results should be reliable in the higher more dilute regions of the riser. The vertical velocity produced by the CPFD simulation has positive values in the core region of the riser and negative values near the walls. Since there are clear interactions between the particles and the walls, frictional forces reduce the down flow velocity of the particles, producing a clear drop in velocity near the walls. This phenomenon
Here, we evaluate the effect of a polydisperse PSD on our CPFD modeling of the CFB riser. We conducted four tests with variable numbers of parcels and mesh resolutions to determine the sensitivity of our results to these factors. Detailed information for each test is given in Table 2. The distributions of instantaneous and timeaveraged particle concentrations in each test are shown in Fig. 10, while the distributions of mean particle volume fraction in horizontal and vertical directions are given in Figs. 11 and 12, respectively. For this case, we also compare our simulation results with the simplified EE simulation of Niemi (2012), where particles were divided into three size classes using the DQMOM approach to approximate a polydisperse particle size distribution. In general, the flow structure produced by CPFD simulation for the polydisperse PSD case is similar to that for the binary case. However, some effects related to particle size exist. The CPFDsimulated horizontal distributions of particle volume fraction show good agreement with experimental results at all four heights. However, even in this case, the dense bottom region observed in the experiments is not fully reproduced in the CPFD simulation, as can be seen in the transient flow patterns (Fig. 10(a)), and the horizontal concentration profiles (Fig. 11). In addition, increasing the total number of computational particles does not appear to change the flow patterns in the riser (Fig. 10). In test 3, with the largest number of parcels, many particles were stacked in the feeding duct, resulting in a lower mean particle concentration in the riser. No such accumulation of solids was observed in the experiment. The reduction of solid volume fraction in the riser is clearly seen in Fig. 12, which compares the simulated vertical solids distributions for the four tests. In Test 3, with the highest parcel number, the circulation rate exceeds the capability of the return leg, which is only covered by a limited number of computational cells. As a result, particles accumulate in the return leg. This effect could be reduced by improving the mesh in the return duct, but is beyond the scope of the present study. The difference between the results of Tests 1 and 2, both with smaller numbers of parcels, is relatively small (Figs. 11 and 12). Thus, the effects of the parcel number on the predicted solids volume fraction and velocity distributions in the riser are minimal, as long as the return duct behaves correctly in the simulation. Decreasing the mesh resolution to 10 mm in Test 4 had only minor effects on the particle distribution in the riser, with particle accumulation in Test 4 occurring slightly more toward the riser bottom (Fig. 10). A small effect on the shape of the horizontal solid concentration profile adjacent to the walls also can be seen (Fig. 11). Thus, coarsening the mesh resolution reduces the ability to accurately describe the effects of particle-wall interactions, with the result that the wall effects are less pronounced in the coarse-mesh simulation. Otherwise, the horizontal and vertical profiles are not largely affected by mesh resolution (Figs. 11 and 12). A slight increase in solids concentration at the center of the riser occurs at the lower region in this CPFD prediction, which is not observed in the measurements or in the EE simulation.
Q. Wang et al. / Particuology 21 (2015) 107–117
113
Fig. 9. Horizontal profiles of time-averaged vertical solid velocity for the binary PSD case.
Particle concentration produced by CPFD modeling at the bottom of the riser is higher in this case than for the binary case (Fig. 12). The peak in the particle volume fraction profile is at a lower height, and accumulation of particles occurs at a lower point in the riser. Overall, these results look realistic (Kallio, Guldén, & Hermanson, 2010; Mahmoudi, Chan, Brems, Seville, & Baeyens, 2012). Interestingly, the results for the EE simulation for the polydisperse PSD case yield distributions of particle volume fraction that are quite similar to the results for the binary case. Particle segregation is clearly observed in the instantaneous particle size distributions, with large particles present in the lower part of the riser and smaller particles concentrated in the higher regions (Fig. 13). In the vertical distributions of particle diameter (Fig. 14), different results are obtained with each method. The EE simulation shows an evenly distributed mean particle diameter below 1.5 m, with a slight increase between 1.5 and 2.3 m, and a sharp drop in size close to the top of the riser. This rather unrealistic phenomenon could be attributed to the mixture model used in the EE simulation, which simplifies the interactions between the phases. In the CPFD simulations, mean particle diameter shows a steady decrease with height, although less than for the binary case (Fig. 8). The timeaveraged particle diameter at the outlet of the riser is about 252 m (Test 2), compared with 269 m measured in the loop seal in the experiments. The EE simulation gives an average particle size of 273 m at the outlet, while at the bed bottom it gives 312 m, which is slightly smaller than the measured value of 323 m. Particle accumulation in the return duct in Test 3 clearly affects the particle size allocation in the riser (Fig. 14).
The horizontal distributions of time-averaged particle vertical velocity show reasonably good agreement with the experiments at lower heights, while there is a discrepancy in the upper regions (Fig. 15). Only slight differences in the results are obtained with different numbers of parcels or with different mesh resolutions. Near-wall effects are correctly predicted in the CPFD simulations at each height, while they are not fully demonstrated in the simplified 2D EE simulation. One CPFD simulation (binary case and Test 1 of the polydisperse PSD case) ran for approximately 5–8 days on one CPU core, while it took about 15–30 days for the EE computations (using at most 12 CPU cores). Given that the averaging time chosen for the EE simulation was four times longer, we deduce that the 2D EE simulation with 12 cores and the 3D CPFD simulation on a single core (with three times the number of computational cells) could be equally fast. The accuracy of the EE results could be improved by carrying out the simulation in 3D. However, if this were done using the same mesh resolution as the CPFD simulation and the same simulation setup, then the EE simulation would take at least three times longer. Thus, we conclude that to match the speed of the CPFD approach, the present EE approach requires significantly more computational capacity. Effects of PSD in CPFD modeling By comparing the simulated results in both the cases, it is clear that the PSD has obvious influences on the gas–solid flow characteristics in the CFB riser. When the polydisperse PSD is used, the
Table 2 Tests in model validation for the polydisperse PSD case. Purpose
Test
Average parcel number
Mesh size (mm)
Simulation time (h)
Variation of parcel number
Test 1 Test 2 Test 3 Test 4
∼400,000 ∼540,000 ∼890,000 ∼480,000
5 5 5 10
∼190 ∼240 ∼400 ∼50
Variation of mesh spacing
114
Q. Wang et al. / Particuology 21 (2015) 107–117
Fig. 10. Distributions of (a) instantaneous and (b) time-averaged particle concentrations for the polydisperse PSD case (logarithmic scale).
Q. Wang et al. / Particuology 21 (2015) 107–117
115
Fig. 11. Horizontal profiles of mean volume fraction at different heights for the polydisperse PSD case.
Fig. 12. Mean solid volume fraction distributions as a function of height for the polydisperse PSD case.
particles are divided into more size classes; thus, the gas–solids interactions, as well as the interactions between different particle groups become more important and need to be described more precisely. Consequently, both the distributions of particle volume fraction and particle vertical velocity can be predicted better if the actual PSD is taken into account. The CPFD simulation shows some obvious advantages in its capacity for gas–solid modeling compared with the simplified 2D EE simulation for the same conditions. Even though the polydisperse PSD was treated as three particle size classes using the DQMOM approach in the EE simulation, the vertical distributions of particle diameter are not satisfactorily modeled, and larger discrepancies occurred in the particle flow characteristics compared with experimental results. In part, this can be attributed to the 2D nature of the simulation, rather than to the EE approach itself. However, a 3D EE simulation would significantly increase computational time. In contrast, our CPFD scheme can easily deal with a polydisperse size distribution of particles, as calculations can be sped up by grouping particles by size. As discussed above, both the binary case and the polydisperse PSD case show qualitatively good predictions compared with the
Fig. 13. Instantaneous distributions of particle diameters for the polydisperse PSD case.
corresponding experimental results, although the CPFD scheme was unable to reproduce the dense bottom region observed in the experiments. However, although they had similar accuracy, the simulations with CPFD scheme for the polydisperse PSD case produced results closer to the measured data. Of course, the actual particle size distribution in the binary PSD case was not fully bimodal, but it consisted of a relatively narrow distribution. Although this distribution had been described in the CPFD scheme, a binary distribution was applied to provide results that were
116
Q. Wang et al. / Particuology 21 (2015) 107–117
Fig. 14. Mean particle diameter as a function of riser height for the polydisperse PSD case.
Fig. 15. Horizontal profiles of time-averaged vertical solid velocity for the polydisperse PSD case.
comparable to the EE simulations of Niemi (2012). In the polydisperse PSD case, the measured size distribution was used for the simulation. This could also explain the slightly better results achieved for this case, indicating a need to accurately account for the true size distribution. Conclusions In this study, gas–solid flow and particle distributions in a labscale CFB riser were simulated using CPFD method implemented with Barracuda software. The CFB riser had the same geometry as used by Niemi (2012), and used solid particles with a binary and a polydisperse PSD. The mesh resolution was fine (5-mm). The simulated velocities, volume fractions, and particle sizes were compared with experimental data as shown in Niemi’s work (2012). Three different numbers of computational particle parcels were evaluated. Differences in the simulation results obtained using the two smallest numbers of parcels were relatively small, but for the highest number of parcels, the particle flow pattern in the feeding duct changed, causing accumulation of solids, and significantly reducing solids in the riser.
Comparison of our results with a simplified 2D EE simulation (Niemi, 2012) was used to assess the relative benefits of the Barracuda software code in terms of accuracy and computational time. In general, our simulation results were satisfactory. In particular, in regions close to the walls, the CPFD method produced better results than the simplified 2D EE method in Niemi (2012). However, at the center of the riser, the CPFD method predicted a slight increase in the solids volume fraction, which was not observed in either the experimental data or in the 2D EE simulation results. Both CPFD and EE simulations predicted segregation of larger particles at the bed bottom. CPFD simulation showed that this tendency was stronger for the polydisperse PSD case, which is in agreement with the measurements. The average particle size at the riser exit was well predicted by both approaches. However, the EE simulation predicted better mixing in the bed bottom, and separation of the particle sizes occurring at higher positions in the riser. In contrast, the CPFD results showed segregation occurring from the bottom. Since the mesh resolution used in this study was fine enough, the incapability of the CPFD simulations to produce a dense bottom bed should be related to the method itself, rather the mesh resolution. Both the simulations and experiments clearly
Q. Wang et al. / Particuology 21 (2015) 107–117
revealed a significant effect of particle size distribution on the solids distribution and velocity fields in the CFB riser. In conclusion, the study showed that the main benefit of the CPFD method was its capability to accurately account for the particle size distribution. Moreover, the simulations with the Barracuda software required significantly less computational effort than the simplified 2D EE simulations implemented with Ansys Fluent software. Although the CPFD simulation results were not satisfactory in all respects, for upper regions of the riser (above the bottom bed), the differences with measured results were not large. Thus, the method can be considered suitable for CFB riser simulations. Acknowledgements Financial support for this work was provided by the National Program on Key Basic Research Project (973 Program) of China (No. 2012CB214900). The authors also gratefully acknowledge the financial support from Tekes, VTT Technical Research Centre of Finland, Etelä-Savon Energia Oy, Fortum, Metso Power Oy and Numerola Oy, and the support from Saarijärven Kaukolämpö Oy. Dr. Markus Honkanen at the Tampere University of Technology helped with the PIV measurements, while Mr. Alf Hermanson provided valuable input during the experiments at Åbo Akademi University. References Adamczyk, W. P., Klimanek, A., Białecki, R. A., Wecel, G., Kozołub, P., & Czakiert, T. (2014). Comparison of the standard Euler–Euler and hybrid Euler–Lagrange approaches for modeling particle transport in a pilot-scale circulating fluidized bed. Particuology, 15, 129–137. Bell, R. A. (2000). Numerical modelling of multi-particle flows in bubbling gas-solid fluidized beds (Doctoral dissertation). Australia: Swinburne University of Technology. Benyahia, S., & Sundaresan, S. (2012). Do we need sub-grid scale corrections for both continuum and discrete gas-particle flow models? Powder Technology, 220, 2–6. Chao, Z., Wang, Y., Jakobsen, J. P., Fernandino, M., & Jakobsen, H. A. (2011). Derivation and validation of a binary multi-fluid Eulerian model for fluidized beds. Chemical Engineering Science, 66(16), 3605–3616. Chen, C., Werther, J., Heinrich, S., Qi, H. Y., & Hartge, E. U. (2013). CPFD simulation of circulating fluidized bed risers. Powder Technology, 235, 238–247. Feng, Y. Q., & Yu, A. B. (2007). Microdynamic modelling and analysis of the mixing and segregation of binary mixtures of particles in gas fluidization. Chemical Engineering Science, 62(1), 256–268. Garg, R., & Dietiker, J. F. (2013). Documentation of open-source MFIX–PIC software for gas-solids flows. Retrieved from https://mfix.netl.doe.gov/ documentation/mfix pic doc.pdf Garg, R., Galvin, J., Li, T., & Pannala, S. (2012). Open-source MFIX-DEM software for gas-solids flows: Part I – Verification studies. Powder Technology, 220, 122–137. Gidaspow, D. (1994). Multiphase flow and fluidization: Continuum and kinetic theory descriptions. New York: Academic Press. Gidaspow, D., Syamlal, M., & Seo, Y. (1986). Hydrodynamics of fluidization of single and binary size particles: Supercomputer modelling. In Proceedings of the fifth engineering foundation conference on fluidization (Vol. 5, 1-8) Elsinore, Denmark. Han, X., Schnell, U., & Hein, K. R. G. (2001). Applying Eulerian and Lagrangian approaches to the modeling of dry desulfurization process in pulverized coal furnaces. Energy & Fuels, 15, 1069–1076. Hartge, E. U., Ratschow, L., Wischnewski, R., & Werther, J. (2009). CFD-simulation of a circulating fluidized bed riser. Particuology, 7, 283–296. He, Y. R., Deen, N. G., van Sint Annaland, M., & Kuipers, J. A. M. (2009). Gas-solid turbulent flow in a circulating fluidized bed riser: Numerical study of binary particle systems. Industrial & Engineering Chemistry Research, 48(17), 8098–8108. Kallio, S., Guldén, M., & Hermanson, A. (2010). Experimental study and CFD simulation of a 2D circulating fluidized bed. In G. Yue, H. Zhang, C. Zhao, & Z. Luo (Eds.),
117
Proceedings of the 20th international conference on fluidized bed combustion (pp. 799–804). Berlin: Springer. Li, F., Song, F., Benyahia, S., Wang, W., & Li, J. (2012). MP-PIC simulation of CFB riser with EMMS-based drag model. Chemical Engineering Science, 82, 104–113. Li, J. J., Yang, H. R., Wu, Y. X., Lu, J. F., & Yue, G. X. (2013). Effects of the updated national emission regulation in China on circulating fluidized bed boilers and the solutions to meet them. Environmental Science & Technology, 47(12), 6681–6687. Lu, H. L., He, Y. R., Gidaspow, D., Yang, L. D., & Qin, Y. K. (2003). Size segregation of binary mixture of solids in bubbling fluidized beds. Powder Technology, 134(1), 86–97. Lu, J., Zhang, J., Zhang, H., Liu, Q., & Yue, G. (2007). Performance evaluation of a 220t/h CFB boiler with water-cooled square cyclones. Fuel Process Technology, 88(2), 129–135. Mahmoudi, S., Chan, C. W., Brems, A., Seville, J., & Baeyens, J. (2012). Solids flow diagram of a CFB riser using Geldart B-type powders. Particuology, 10, 51–61. Mathiesen, V., Solberg, T., & Hjertager, B. H. (2000). An experimental and computational study of multiphase flow behavior in a circulating fluidized bed. International Journal of Multiphase Flow, 26(3), 387–419. Mazzei, L., & Lettieri, P. (2008). CFD simulations of expanding/contracting homogeneous fluidized beds and their transition to bubbling. Chemical Engineering Science, 63(24), 5831–5847. Miller, S. F., & Schobert, H. H. (1993). Effect of fuel particle and droplet size distribution on particle size distribution of char and ash during pilot-scale combustion of pulverized coal and coal-water slurry fuels. Energy & Fuels, 7(4), 520–531. Niemi, T. J. (2012). Particle size distribution in CFD simulation of gas-particle flows (Master Thesis). Finland: Aalto University. OpenCFD Ltd. (2014). OpenFOAM release: OpenFOAM ®2.3.0. http://www.openfoam. org/version2.3.0/ Peltola, J., Kallio, S., Honkanen, M., & Saarenrinne, P. (2010). Image based measurement of particle phase Reynolds stresses in a laboratory scale circulating fluidized bed. In Proceedings of 7th international conference on multiphase flow—ICMF 2010 Tampa, USA. Rao, A., Curtis, J. S., Hancock, B. C., & Wassgren, C. (2011). Classifying the fluidization and segregation behavior of binary mixtures using particle size and density ratios. AIChE Journal, 57(6), 1446–1458. Schneiderbauer, S., Aigner, A., & Pirker, S. (2012). A comprehensive frictional-kinetic model for gas–particle flows: Analysis of fluidized and moving bed regimes. Chemical Engineering Science, 80, 279–292. Smagorinsky, J. (1963). General circulation experiments with the primitive equations, Part I: The basic experiment. Monthly Weather Review, 91(3), 99–164. Snider, D. M. (2001). An incompressible three-dimensional multiphase particle-incell model for dense particle flows. Journal of Computational Physics, 170(2), 523–549. Snider, D. M. (2007). Three fundamental granular flow experiments and CPFD predictions. Powder Technology, 176(1), 36–46. Snider, D. M., Clark, S. M., & O’Rourke, P. J. (2011). Eulerian–Lagrangian method for three-dimensional thermal reacting flow with application to coal gasifiers. Chemical Engineering Science, 66(6), 1285–1295. Syamlal, M. (1987). The particle-particle drag term in a multiparticle model of fludization. Springfield: National Technical Information Service. Topical Report, DOE/MC/21353-2373, DE87 006500. van Sint Annaland, M., Bokkers, A., Goldschmidt, M. J. V., Olaofe, O. O., van der Hoef, M. A., & Kuipers, J. A. M. (2009). Development of a multi-fluid model for polydisperse dense gas–solid fluidised beds, Part I: Model derivation and numerical implementation. Chemical Engineering Science, 64(20), 4222–4236. Wang, Q., Yang, H., Wang, P., Lu, J., Liu, Q., Zhang, H., et al. (2014). Application of CPFD method in the simulation of a circulating fluidized bed with a loop seal, Part I – Determination of modeling parameters. Powder Technology, 253, 814–821. Wang, Q., Yin, W., Lu, J., Yang, H., & Wei, L. (2013). Predictions of gas-solid flow in a coal beneficiation fluidized bed by KTGF and CPFD methods. International Journal of Mineral Processing,. Submitted. Wischnewski, R., Ratschow, L., Hartge, E. U., & Werther, J. (2010). Reactive gassolids flows in large volumes—3D modeling of industrial circulating fluidized bed combustors. Particuology, 8, 67–77. Yue, G. X., Lu, J. F., Zhang, H., Yang, H. R., Zhang, J. S., Liu, Q., et al. (2005). Design theory of circulating fluidized bed boilers. In ASME, Proceedings of the 18th international conference on fluidized bed combustion (pp. 135–146). Zhang, N., Lu, B., Wang, W., & Li, J. (2008). Virtual experimentation through 3D fullloop simulation of a circulating fluidized bed. Particuology, 6, 529–539.