Available online at www.sciencedirect.com
Procedia Engineering 00 (2011) 000–000
Procedia Engineering 30 (2012) 1146 – 1154
Procedia Engineering www.elsevier.com/locate/procedia
International Conference on Communication Technology and System Design 2011
Particle swarm optimization based generation maintenance scheduling using probabilistic approach K.Suresha, N.Kumarappanb , a* b
a Department of EEE, Sri ManakulaVinayagar Engineering College, Pondicherry 605107, India Department of Electrical Engineering, FEAT, Annamalai University, Annamalainagar 608002 , India
Abstract This paper presents maintenance scheduling (MS) of generating units using particle swarm optimization (PSO) based probabilistic levelized risk method. The PSO for the generator maintenance scheduling generates optimal and feasible solution and overcome the limitations of the conventional methods. The maintenance of generators are directly associated with the overall reliability of the power system. The objective function of this paper is to reduce the loss of load probability (LOLP) for a power system. The capacity outage probability table (COPT) is the initial step in creating the maintenance schedule using the probabilistic levelized risk method. Probabilistic techniques are widely used in power system reliability evaluation of long-term planning. Moreover, this paper proposes the PSO to construct the generation model COPT without utilizing the analytical model. A case study for the roy billinton test system (RBTS) and real power system model, Thailand power system shows that the developed algorithm can achieve a substantial levelization in the reliability indices over the planning horizon and demonstrates the effectiveness of the proposed approach. © 2011 Published by Elsevier Ltd. Selection and/or peer-review under responsibility of Amrita University
Open access under CC BY-NC-ND license.
Keywords: Levelized risk method; Particle swarm optimization; Loss of load probability; Capacity outage probability table
1. Introduction Preventive maintenance scheduling of generating unit is an important requirement which is a challenging task in a power system. It plays a vital role in minimizing the unexpected outages, extending equipment lifetime and extension operation planning. Mathematically, the unit maintenance scheduling problem is a multiple-constraint, non-linear and stochastic optimization problem. However, the MS problem is a constrained optimization problem [1]. Many kinds of intelligence computation methods such as artificial neural network, simulated annealing, expert system, fuzzy systems, tabu search and evolutionary optimization methods have been applied to solve the unit maintenance scheduling problem. * K. Suresh. Tel.: +91 0413 2222551; fax: +91 0413 2641136. E-mail address:
[email protected]. 1185
1877-7058 © 2011 Published by Elsevier Ltd. Open access under CC BY-NC-ND license. doi:10.1016/j.proeng.2012.01.974
K.Suresh and N.Kumarappan/ Procedia Engineering 00 (2011) 000–000
1147
K. Suresh and N. Kumarappan / Procedia Engineering 30 (2012) 1146 – 1154
[3-5]. In recent years with rapid development of the evolutionary theory, GA and PSO have become very powerful optimization tool and obtained wide application in power engineering. In a global maintenance scheduling problem, the network constraints were included [4]. Generation adequacy of Mexico‟s national interconnected power system was analyzed [7]. The PSO algorithm had used to solve the operation planning problem in power system [10]. In power system MS, there are two categories of objective functions are used namely, either deterministic or probabilistic. The methods reported in the literature [35] are considered the deterministic based levelized reserve method. The main drawback of the deterministic approach is that it neglects the randomness of the available generating unit‟s capacity. The probabilistic reliability objective function removes the above defect by taking into account the random forced outage of the generating units [1-2]. The removal of generators create excessive risk to the power system. This paper emphasizes the PSO algorithm based probabilistic levelized risk method MS which is considered the random outage of generators. Moreover, the PSO is utilized to create the COPT which is the essential step for the probabilistic levelized risk method. Since the analytical method based COPT becomes tedious for the large scale power system problems to find the global optimum solutions for MS problem. Complexity of the MS problem increases dramatically with large number of generating units. Nomenclature LOLPi , LOLPj t T LOLE p n Pi Ci Li Pi(Ci1. However, the following constraint must still be met
k Vr
m kt
Vrt
(5)
3. Probabilistic levelized risk method The effective load carrying capacity (Ce) and the equivalent load (Le) are the two significant factors to be calculated in the probabilistic levelized risk method. The COPT is formed; the risk characteristic coefficient ‘m’ is computed. The ‘m’ is defined as the corresponding change of the generating unit‟s outage capacity in MW when the system‟s risk or P(X) changes by a factor of e. So m
XB
XA
p( X A ) ln p( X B )
(6)
where P(XA) is the probability of outage at point A, P(XB) is the probability of outage at point B, XA is the outage at point A, XB is the outage at point B. Effective load carrying capacity is the actual capacity used for meeting the load demand. The reserve capacity of the system should be increased when a generating unit is added so as to maintain the system‟s risk at a constant level in power system. Ce C m * ln( p q exp(c / m)) (7) where p is the availability of a machine, q is the unavailability or forced outage rate of a machine, C is the capacity of the generator being added. In the levelized risk method equivalent load is used in place of the maximum load in the maintenance time interval. The equivalent load can be computed as
1187
K.Suresh and N.Kumarappan/ Procedia Engineering 00 (2011) 000–000
1149
K. Suresh and N. Kumarappan / Procedia Engineering 30 (2012) 1146 – 1154
Le
Lm
m * ln(
Tp j 1
(exp( L j
(8)
Lm ) /m)Tp )
where Lm is the maximum load of the interval under study, Lj is the daily maximum load of the interval under study, Tp is the number of days in an interval. 3.1. Capacity outage probability table The generation model consists of a table which contain states of capacity unavailable due to outages in the ascending order [2], [7]. Analytical approaches require mathematical modelling to generate the system states which will add more burdens on the process of creating the COPT. The total number of probable outage system capacity outcome (states) of generators which is 2N [6]. The outage state of the generating units in the states array are represented as follows state11 state12 state1N (9) states array state21 state22 state2 N state2N1 state2N1 state2N N The “capacity in service” and the “capacity out of service” of the generating units are calculated for each system state from the system states array using the following equations state capacity ini ( MW )
N k 1
(10)
stateik capk
(11) state cap outi (MW) =TIC-state capacity ini where capk is the capacity of unit k, state ik is the state of unit k in the system state i, TIC is the total installed capacity in MW, N is the number of generating units. State probability is calculated as follows state probabilityi =
N
k 1
probk
(12)
probk = FORk ; if stateik=0 (13) =1-FORk ; if stateik=1 where probk is the state probability of unit k, FORk is the forced outage rate (FOR) of unit k. The total probability of the collected states “cumulative probability” is calculated as follows cumulative probabilitym=cumulative probabilitym-1+
M
state probabilityi
(14)
i 1
where M is the total number of states at the end of iteration process. 4. Implementation of proposed maintenance scheduling in power system Step (1): Get the generator data viz the number of generators, their rated capacity and FOR. Step (2): Get the load data for 52 weeks which includes the daily maximum load data. Step (3): Create the COPT using the PSO algorithm. Step (4): Select cumulative probability values (corresponds to outage capacities of generator) close to P(XA)= 0.1 and P(XB)= 0.0001. Step (5): Compute the value of PSO based ‘m’ using Eq. (6). according to the data in the COPT. Step (6): Calculate the values of effective load carrying capacity of each generator using Eq. (7). Step (7): Find the equivalent load using Eq. (8). Step (8): Take the first generator and calculate the minimum sum of the Ce and Le . Step (9): Schedule the generator by searching the intervals with minimum sum of equivalent load and effective load carrying capacity on the load curve and schedule the generator until the maintenance intervals are exhausted for that particular generator. 1188
K.Suresh and N.Kumarappan/ Procedia Engineering 00 (2011) 000–000
1150
K. Suresh and N. Kumarappan / Procedia Engineering 30 (2012) 1146 – 1154
Step (10): Repeat steps 8 and 9 for all the generators for MS. Step (11): If the MS is not feasible within the limits of the generation system, go to step 3. Otherwise terminate the program. Step (12): Obtain the reliable and optimal maintenance schedule for the generators. 4.1. Proposed PSO algorithm for outage system state probability and risk characteristic co-efficient PSO is a population based optimization tool which is motivated from the simulation of the behaviour of social systems such as fish schooling and birds flocking [8]. It is easy to implement and there are few parameters to control which is used to solve the large scale power system problems [10]. 4.1.1. Algorithm Step (1): Choose the input parameters for PSO. Risk characteristic co-efficient, outage state capacity of generators are taken as control variables. Select the COPT of the generators. Set the time counter t=0, create the initial population for ‘m’ values, all possibilities of system outage capacities of the power system. Generate „n’ particles by randomly selecting a value with uniform probability over the search space between maximum and minimum outage capacities of generator [xmin,xmax]. For example if there are N outage capacities in the COPT, the i th particle of risk characteristic co-efficients are represented as follows: Xmi=( Xm1, Xm2, Xm3,………….. Xm N). Step (2): Generate random initial velocity of all particles over the search space [vmin,vmax]. Maximum velocity of a particular dimension is given by the equation V k max=(x max-xmin )/Na where xmax, xmin are the maximum and minimum position of the particles , Na is the number of iteration. Step (3): Evaluate the fitness of each particle according to the objective function using Eq. (6) and (10).Calculate system state capacity out of service using Eq. (11). Calculate the system state probability using Eq.(12) and (13). The cumulative probability of system capacity outage states are calculated using Eq. (14). Step (4): Set evaluated fitness values as pbest values for each particle, identify gbest value among all pbest value that corresponds to the particle shown by xmi (0)= [xmi t (0),…, xmi N(0)], where xmi(0) is the initial particle position. Step (5): Update the time counter t=t+1.Update the velocity using the gbest and the pbest of each particle, the ith particle velocity in the jth dimensions are updated. Based on the updated velocity, each particle changes its position. If a particle violates its position limits in any dimension, set its position at the proper limit. Step (6): Update the position of the each particle. Step (7): Evaluate the fitness function for each particle. If the current value is better compared to the previous pbest of the particle, the previous value is replaced by the current value. Otherwise the current value is replaced by the previous value. Step (8): If stopping criterion is reached terminate the program, the position of particles represented by gbest, the optimal solution. Otherwise, the procedure is repeated from step 5. 5. Numerical results and discussion In order to verify the usefulness of the proposed method which is tested on RBTS and the real power system model in Thailand have been considered for the case study. The RBTS has 11 generating units, ranged from 5 MW to 40 MW. The system peak load is 185 MW and the total generation is 240 MW. The detailed system data is given in [9]. The PSO based MS using probabilistic levelized risk method is implemented in Matlab 7.0. The corresponding PSO parameters are itermax=1000, n=330, k = 0.7298,c1 = 1189
K.Suresh and N.Kumarappan/ Procedia Engineering 00 (2011) 000–000
1190
1151
K. Suresh and N. Kumarappan / Procedia Engineering 30 (2012) 1146 – 1154
2.05 and c2 =2.05, Wmax and Wmin are set at 0.9 and 0.2 respectively. COPT has been built using the PSO. The total number of states for the RBTS is 211 (2048) states. The COPT for RBTS is shown in Table 1. The initial population of PSO algorithm for the first iteration which is generated randomly. The PSO search the state space to test out the most possible failure states of the generator and store them in a state array using Eq. (9). The state probabilities of each outage capacity of the units are calculated using Eq. (12). The “capacity in service” and the “capacity out of service” are calculated for each system outage state of the generators recovered in the system state array. Moreover, the unrepeated states are added to a system state array which creates new population for PSO algorithm. The repeated trivial states will be truncated from the COPT. From Table 1 the fitness values for the repeated states (230 MW, 235 MW and 240 MW) are assigned a very small value and appears as zero, it is revealed that the state probability of system outage states 230 MW, 235 MW and 240 MW are identical. It depicts that all of the system outage capacity states of generator are recovered at the end of iterations. However, it is not practical to incorporate all of the outage of generator system states in the COPT for the large scale systems. Iterations are performed until the cumulative probability value reaches 1 and all the significant states with high probabilities are recovered. The cumulative probability approaches 1.0 corresponding to the maximum outage capacity of the generator in the power system. Table 1. COPT results for RBTS Outage capacity(MW)
Cumulative probability
Outage capacity(MW)
Cumulative probability
Outage capacity(MW)
Cumulative probability
0 5 10 15 20 25 30 35 40 45 50 55 60 65 70 75 80
1.000000000000000 0.187140385743580 0.170718979394965 0.154047071279746 0.153711940537938 0.083353402522989 0.081932052110152 0.080489019584235 0.080460012432953 0.011190283753061 0.009790898254492 0.008370165708533 0.008341606820807 0.002513155213010 0.002395411629758 0.002275871916808 0.002273468986538
85 90 95 100 105 110 115 120 125 130 135 140 145 150 155 160 165
0.000271985961167 0.000231552205827 0.000190501650260 0.000189676471580 0.000030226637111 0.000027005512527 0.000023735251019 0.000023669513782 0.000002446752258 0.000002018016308 0.000001582740169 0.000001573990455 0.000000110586595 0.000000081023774 0.000000051009983 0.000000050406661 0.000000002790435
170 175 180 185 190 195 200 205 210 215 220 225 230 235 240
0.000000001828552 0.000000000851997 0.000000000832367 0.000000000039499 0.000000000023483 0.000000000007224 0.000000000006897 0.000000000000294 0.000000000000161 0.000000000000026 0.000000000000023 0.000000000000001 0.000000000000000 0.000000000000000 0.000000000000000
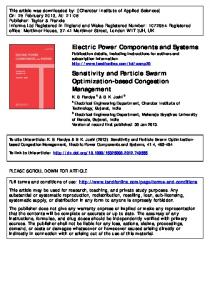
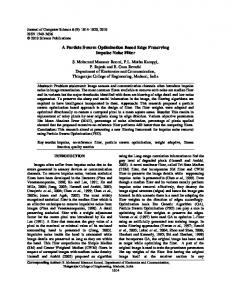
Most of these states have low probability of occurrence which means that they are unusually to occur. They do not influence significantly on the power system reliability evaluation. COPT results for the Thailand power system is shown graphically in Fig 1. From Fig 1. it is noticed that the cumulative probability of generators are obtained for all outage capacities of generator ranging from 0-4950MW. The cumulative probabilities of the collected states are evaluated. Obviously, the cumulative probability starts with zero; the cumulative probability varies between 0-1. Fig 2.shows the LOLP values for maintenance time interval for case study 2. The effective load carrying capacity is shown in Fig 3. From Fig 3.it is clear that each generator contributes a specific amount of its capacity for the entire system‟s reserve in power system. Fig 4. shows the equivalent load in the maintenance time interval. The Ce , Le varies with change 1190
K.Suresh and N.Kumarappan/ Procedia Engineering 00 (2011) 000–000
1191
1152
K. Suresh and N. Kumarappan / Procedia Engineering 30 (2012) 1146 – 1154
in the risk characteristic co-efficient. The obtained optimal ‘m’ is 10.445 MW by Eq. (6) in 302 iterations using the PSO which cannot normally be analyzed by hand calculations for large scale systems.
Fig 1. Cumulative outage probability for case study 2
Fig 2. LOLP values for RBTS
Fig 3. Effective load carrying capacity for RBTS
Fig 4. Equivalent load for RBTS
The calculated LOLEa value is 15.5 days per year using Eq. (2) and (3). It is observed that the expected number of days (approximately 16 days) in a year in which the daily peak load exceeds the available generation (capacity deficiency). The second case study considered the real power system model, Thailand power system [11] in Thailand. Electricity Generating Authority of Thailand (EGAT) is responsible for the long term planning based on the forecasted demand through the year 2025. Table 2. Maintenance schedule for RBTS Generating unit 1 2 3 4 5 6
Maintenance intervals 38-39 12-13 35-36 10-11 38-39 14-15
Generating unit 7 8 9 10 11
Table 3. Maintenance schedule for Thailand power system Maintenance intervals 31-32 40-41 12-13 34-35 8-9
Generating unit 1 2 3 4 5 6 7
Maintenance intervals 15-18 6-9 10-13 33-36 42-45 19-21 38-41
1191
1153
K. Suresh and N. Kumarappan / Procedia Engineering 30 (2012) 1146 – 1154
The total installed capacity of the generation is 4950 MW. The forecasted peak demand for the year 2015 is 20981 MW. The LOLE value obtained is 23.5643 hours per year. The obtained optimal maintenance schedule for the RBTS and Thailand power system are given in Table 2 and Table 3 respectively. None of the generating units are maintained in the maintenance time interval 50-52 for both the case studies. Since the obtained LOLP (risk) values and equivalent loads are maximum in that particular intervals. The risk gradually increases when the load is increased. It is found that all the generators are continuously scheduled in the specified maintenance time intervals which satisfy the maintenance constraints according to Eq. (4) and (5). The obtained results indicated that the leveling of risk (more or less same) is achieved over the planning horizon incorporating the uncertainties in power system. The optimal MS is obtained through minimization of LOLE, which maximizes (reserve capacity) the overall reliability of the power system. The proposed probabilistic MS model effectively incorporates the stochastic nature of generating units and explores the solution from the population of points not from a single point. 6. Conclusion In this paper the probabilistic levelized risk method has presented in conjunction with the PSO technique to determine the risk characteristic co-efficient. Moreover, this paper uses the exploitation of PSO to explicitly create the COPT which is the fundamental prerequisite of power system reliability assessment. The proposed method is validated for RBTS and Thailand power system to create the power system generation model which is used to decide how much generation adequacy is needed to assure reliability level to meet the future energy demand. The PSO starts with the feasible solutions generated based on heuristics by avoiding the awkward computational effort required by the conventional methods with increase in variables for large scale systems. It is envisaged that the proposed algorithm is suitable for the practical power system in capacity generation planning and its potential to solve the MS problem while considering the random failures in the maintenance model for power system utilities. References: [1] X.Wang , J.R. McDonald, “ Modern Power System Planning”, McGraw-Hill International (UK) Limited; 1994. [2] Roy Billinton, Ronald N. Allan, “Reliability Evaluation of Power System”, Plenum Press , 1984. [3] Y.Wang, E. Handschin. “A new genetic algorithm for preventive unit maintenance scheduling of power systems”, Elect. Power and Energy Syst. 2000;22: p. 343–348. [4] M.Y. El-Sharkh, A.A. El-Keib, H. Chen, “ A fuzzy evolutionary programming-based solution methodology for securityconstrained generation maintenance scheduling”, Elect. Power Syst. Res. 2003;67: p. 67–72. [5] K. P. Dahal, N.Chakpitak, “Generator maintenance scheduling in power systems using meta heuristic-based hybrid Approaches”, Elect.Power Syst. Res. 2007;77: p. 771–779. [6] Ahmed S.Al-Abdulwahab, “Probabilistic Electrical Power Generation Modeling Using Genetic Algorithm”, International Journal of Computer Applications, 2010; 5(5): p. 1–6. [7] Conde-Lopez. L, Guillermo Gutierrez-Alcaraz. G, “ Reliability Analysis of Generating Capacity of Mexico‟s National Interconnected Power System”, Proceedings of the 10th International Conf. on Probabilistic Methods Applied to Power Syst. 2008; Rincon: p. 1–6. [8] J.Kennedy, R.Eberhart. Particle swarm optimization. Proc. of IEEE Int.Conf. on Neural Networks. Perth : 1995;4: p. 1942–1948. [9] Roy Billinton, Ran Mo, “Composite System Maintenance Coordination in a Deregulated Environment”, IEEE Trans. on Power Syst. 2005; 20(1): p. 485–492 . [10] N.Kumarappan, K.Suresh, “ Particle Swarm Optimization based Generation Maintenance Scheduling using Levelized Risk Method”, IEEE Power system technology and Power India Conf. New Delhi: 2008;1: p. 1–6. 1192
1154 1193
K. Suresh N. Kumarappan / Procedia Engineering 30 (2012) 1146 – 1154 K.Suresh andand N.Kumarappan/ Procedia Engineering 00 (2011) 000–000
[11] Titiporn Sangpetch, “Optimal Reserve Margin Planning for Thailand Power Network Using Probabilistic Genetic algorithm”, International Conf. on challenges and opportunities to the electric power industry in an uncertain era. Taipei: 2010: p.1–8.
1193