Behav Genet DOI 10.1007/s10519-017-9880-0
ORIGINAL REASEARCH
Partitioning Phenotypic Variance Due to Parent-of-Origin Effects Using Genomic Relatedness Matrices Charles Laurin1 · Gabriel Cuellar‑Partida2 · Gibran Hemani1 · George Davey Smith2 · Jian Yang3 · David M. Evans1,2
Received: 1 June 2017 / Accepted: 21 October 2017 © The Author(s) 2017. This article is an open access publication
Abstract We propose a new method, G-REMLadp, to estimate the phenotypic variance explained by parent-oforigin effects (POEs) across the genome. Our method uses restricted maximum likelihood analysis of genome-wide genetic relatedness matrices based on individuals’ phased genotypes. Genome-wide SNP data from parent child duos or trios is required to obtain relatedness matrices indexing the parental origin of offspring alleles, as well as offspring phenotype data to partition the trait variation into variance components. To calibrate the power of G-REMLadp to detect non-null POEs when they are present, we provide an analytic approximation derived from Haseman-Elston regression. We also used simulated data to quantify the power and Type I Error rates of G-REMLadp, as well as the sensitivity of its variance component estimates to violations of underlying assumptions. We subsequently applied G-REMLadp to 36 phenotypes in a sample of individuals from the Avon Longitudinal Study of Parents and Children (ALSPAC). We found that the method does not seem to be inherently Edited by Stacey Cherny. Electronic supplementary material The online version of this article (doi:10.1007/s10519-017-9880-0) contains supplementary material, which is available to authorized users. * David M. Evans
[email protected] 1
MRC Integrative Epidemiology Unit, University of Bristol, Bristol, UK
2
Faculty of Medicine, Translational Research Institute, The University of Queensland Diamantina Institute, Brisbane, QLD, Australia
3
Institute for Molecular Bioscience and Queensland Brain Institute, The University of Queensland, Brisbane, QLD, Australia
biased in estimating variance due to POEs, and that substantial correlation between parental genotypes is necessary to generate biased estimates. Our empirical results, power calculations and simulations indicate that sample sizes over 10000 unrelated parent-offspring duos will be necessary to detect POEs explaining 15%) for the 36 traits that we have examined. Keywords Imprinting · Parent-of-origin effects · ALSPAC · G-REML · GCTA
Introduction Parent-of-origin effects (POEs) describe the phenomenon in which the effects of alleles depend upon their parental origin. POEs imply that heterozygote individuals have phenotypes which are distributed differently depending upon which of their alleles were maternally and paternally transmitted (Guilmatre and Sharp 2012; Lawson et al. 2013). The extreme case of POEs is polar overdominance, where the two heterozygotes’ phenotypes differ in distribution but the two homozygotes share the same distribution (Hoggart et al. 2014). Imprinting, a phenomenon in which one parent’s allele is not expressed, is probably the most widely studied example of POE (Peters 2014). POEs have traditionally been examined in the context of development, where, in mouse models, they have been associated with body size and social behavior (Peters 2014). One evolutionary explanation of POEs concerns genomic conflict between maternal and paternal genes in offspring, with paternal genes encouraging growth and solicitation of
13
Vol.:(0123456789)
Behav Genet
maternal care, even at the expense of the mother’s health, while maternal alleles are orientated toward success of all offspring, which do not necessarily share paternity (Patten et al. 2014). Other evolutionary explanations for POEs include: different territorial patterns in males and females and coadaptation of maternal and offspring genomes to maximize the efficiency of nurturing behaviors like suckling and grooming (Peters 2014). Whilst there is considerable support for the importance of POEs in animals (Neugebauer et al. 2010; Lawson et al. 2013), evidence for the existence of POEs in the etiology of complex human traits and diseases is mixed, in part due to the relative paucity of genomic data from families (Kong et al. 2009; Guilmatre and Sharp 2012). Before the genomics era, the children-of-twins design (Nance and Corey 1976), pedigree analyses (Hall 1990), and parent-offspring regressions (Clemons 2000) provided some limited evidence for the existence of POEs in human populations. These approaches were not often able to distinguish parental effects (indirect effects of the parental genotype on offspring phenotype) from POEs (interaction between the sex of the transmitting parent and the direct allelic effect in offspring) (Hager et al. 2008). More recently, genome-wide association studies incorporating parent-of-origin information have been used to identify POEs at individual loci for age at menarche (Perry et al. 2014), Type I diabetes (Wallace et al. 2010), Type II diabetes, basal cell carcinoma, and breast cancer [all identified in (Kong et al. 2009)]. We propose a method, G-REMLadp, to estimate the phenotypic variance due to POEs across the genome by applying restricted maximum likelihood (REML) to offspring genomewide genetic relatedness matrices and phenotype data. Our method involves the construction of a genetic relationship matrix indexing the parental origin of offspring alleles using genome-wide SNP data from parent–child duos or trios. The proposed method is an early adaptation to human genetics of procedures developed for animal breeding (Schaeffer et al. 1989; Spencer 2002; Nishio and Satoh 2015). The genotypic Table 1 Recoding a phased genotype using three orthogonal terms
coding for POEs, which we adopt here, is based on the model outlined by Spencer (2002, 2009) and implemented by Nishio and Satoh (2015) in the context of genomic prediction. The genotype coding we used for dominance effects is due to Zhu et al. (2015), who designed it to be orthogonal to the allele count at a locus; it is also orthogonal to the POE coding, which distinguishes our approach from that used by Spencer, Nishio and Satoh, and others. Using these codings, the phased genotype at a locus is coded using three orthogonal components: an additive-coded genotype, a dominancecoded genotype, and a POE-coded genotype. To estimate the power of G-REMLadp to estimate non-null POEs, we provide an approximation using Haseman–Elston regression (Elston et al. 2000; Chen 2014). We also used simulated data to estimate the power and Type I Error rates of G-REMLadp, as well as the sensitivity of its variance component estimates to violations of assumptions. We then applied G-REMLadp to 36 phenotypes related to body size and obesity, metabolic traits, and IQ in a sample of up to 4753 individuals from a UK-based longitudinal study of childhood health and development.
Methods G-REMLadp uses REML to fit a linear mixed model incorporating random additive effects, dominance effects, and POEs to human genomic data, with the goal of partitioning phenotypic variance into components reflecting these sources of variation tagged by genome-wide SNP chips. In this (model, at each locus, the phased ) genotype of each individual X ∈ aa, amo Afa , Amo afa , AA is expressed as 3 orthogonal components, which are then standardized. The codings for each of the 3 components are listed in Table 1. The standardized additive-coded genotype is the standardized minor allele (A) count at the locus. The derivation of the standardized dominance-coded genotype is given in Zhu et al. (2015); and a flexible equivalent coding is given in Álvarez-Castro
Phased genotype
Freq
Add Code
Std add
Dom code
Std dom
POE code
Std POE
amo afa
q2
0
0
−p∕q
0
0
amo Afa
pq
1
2p
1
− 1
Amo afa
pq
1
2p
1
1
√ − 1∕ 2pq √ 1∕ 2pq
Amo Afa
p2
2
√ − 2p∕q √ (q − p)∕ 2pq √ (q − p)∕ 2pq √ 2q∕p
4p − 2
−q∕p
0
0
The minor allele is A, with frequency p, major allele a with frequency q = 1 − p. Amo: maternally inherited A allele; Afa: paternally inherited A allele. “Freq” expected frequency of the genotype under Hardy–Weinberg equilibrium. “Add Code” additive coding of the phased genotype. “Std Add” standardized additive coding based on mean 2p and variance 2pq. “Dom Code” dominance coding of the phased genotype. “Std Dom” standardized dominance coding based on mean 2p2 and variance 4p2 q2. “POE Code” parent-oforigin effect coding of the phased genotype. “Std POE” standardized parent-of-origin effect coding based on mean 0 and variance 2pq
13
Behav Genet
(2014). The (unstandardized) POE-coded genotype is -1 for the paternal-minor heterozygote (amo Afa), where amo indicates that the major allele was inherited from the mother and Afa that the minor allele was inherited from the father, and 1 for the maternal-minor heterozygote ( Amo afa), and 0 for both homozygotes. The mixed model utilizing these codings is given in Eq. 1, where 𝐲 is a vector of phenotypes; 𝛍yis a column vector of means; the vector 𝐓𝐛 includes any fixed effects of covariates 𝐓; the 𝐙s are n × m matrices containing the standardised coded genotypes (indexing additive, dominance and POEs), represented as one individual per row (sample size n) and one SNP per column (m markers affect the phenotype; in empirical data, this will be replaced by mo, the number of observed markers, while in power analyses, this will be replaced by me, the number of effective markers); the 𝛃 are m × 1 column vectors of additive effects (βα), dominance effects (βδ) and POEs (βγ), which are assumed to be independently normally distributed with mean 0 and variances that are inversely proportional number of markers affecting the pheno( to ) the −1 Var 𝛽 = m 𝜎𝛼2 𝐈(n (𝐈) is the n × n identity matrix), type: 𝛼 ( ) −1 2 −1 2 , Var 𝛽 Var 𝛽𝛿 = m 𝜎𝛿 𝐈n 𝛾 = m 𝜎𝛾 𝐈n, respectively, and 𝛆 is a normal error variable with mean 0 and variance 𝜎𝜀2 𝐈n that is independent of the other variables on the right hand side of the equation. Figure 1 illustrates how the phased genotype is represented as the three orthogonal standardized coded genotypes, while Eq. 1 gives the phenotypic means at each phased genotype.
𝐲 = 𝛍𝐲 + 𝐓𝐛 + 𝐙𝛂 𝛃𝛂 + 𝐙𝛅 𝛃𝚫 + 𝐙𝛄 𝛃𝛄 + 𝛆
(1)
Fig. 1 Phased genotype represented by 3 standardised codings: This figure shows the values of each of three effect-based codings for a given phased genotype, where a represents the major allele and A the minor (effect allele). The subscript mo indicates that the allele was transmitted maternally, while the subscript fa indicates paternal transmission. For a single locus with minor allele fre-
The primary concern of this paper is with the partitioning of phenotypic variance components according to Equations 2 and 3, which present the problem in vector and individual-based forms, respectively. (( )( )� ) Var(𝐲) = E 𝐲 − 𝛍𝐲 − 𝐓𝐛 𝐲 − 𝛍𝐲 − 𝐓𝐛 = m−1 𝜎𝛼2 𝐙𝛂 𝐙𝛂 � + m−1 𝜎𝛿2 𝐙𝛅 𝐙𝛅 � + m−1 𝜎𝛾2 𝐙𝛄 𝐙𝛄 � + 𝜎𝜀2 𝐈n (2) ′ where the matrices 𝐙𝐙 are n × n matrices giving the crossproducts, across all loci, of individuals’ coded genotypes. The elements of Var(𝐲) are given by � {Var(𝐲)}ii = m−1 = {Var(𝐲)}ij = Var(𝐲)
= =
m ∑
� 𝜎𝛼2 z2𝛼, ik + 𝜎𝛿2 z2𝛿, ik + 𝜎𝛾2 z2𝛾, ik
+ 𝜎𝜀2
k=1 𝜎𝛼2 + 𝜎𝛿2 + 𝜎𝛾2 + 𝜎𝜀2 � m m ∑ ∑ m−1 𝜎𝛼2 z𝛼, ik z𝛼, jk + 𝜎𝛿2 z𝛿, ik z𝛿, jk k=1 k=1 2 2 2 𝜎𝛼 𝐀ij + 𝜎𝛿 𝚫ij + 𝜎𝛾 𝚪ij 𝜎𝛼2 𝐀 + 𝜎𝛿2 𝚫 + 𝜎𝛾2 𝚪 + 𝜎𝜀2 𝐈n
+ 𝜎𝛾2
m ∑
� z𝛾, ik z𝛾, jk
k=1
(3)
The second equality in Eq. 3 is because the mean squares of each individual’s standardized genotype codings are expected to be 1 in the absence of inbreeding. The bold-faced Greek characters on the final line of Eq. 3 are used to denote the genetic relationship matrices (GRMs) for the three coded genotypes; the additive GRM is 𝐀, the dominance GRM 𝚫, and the POE-coded GRM is 𝚪. These are averages over all effective markers of the sums
quency p, the standardised √ additive coding (0, 1, 2 standardised to √ √ − 2p∕q, (q − p)∕ 2pq, 2q∕p) of the phased genotype is given by the medium-weight line. The standardised dominance coding is the dashed line (0, 2p, 4p − 2 standardised to−p∕q, 1, −q∕p). The parent-of-origin effect √ √ coding is the thick line (0,− 1,1,0 standardised to 0, −1∕ 2pq, 1∕ 2pq, 0)
13
Behav Genet
of squares and cross-products of individuals’ standardized coded genotypes. It is important to note that we have assumed, but not demonstrated an equivalence between the component of variance due to parent-of-origin effects and that due to imprinting defined by classical quantitative genetics (Santure and Spencer 2006; Campos et al. 2015). Under real-world conditions, a large POE variance component might best be interpreted as identifying a genome-wide pattern of excessive variance among heterozygotes for the phenotype in question which may or may not be due to genomic imprinting. Statistical methods Assumptions Using REML to estimate the variance components model given in Eq. 2 requires that several assumptions (both statistical and genetic) be met in order for inference about the model to be legitimate. In addition to the normality assumptions given above, G-REMLadp fitting of the model in Eq. 3 assumes Hardy–Weinberg Equilibrium (HWE) and accuracy of phasing. Departures from HWE [such as non-random mating and differential allele frequencies in male and female parents (Falconer and Mackay 1996)] break the orthogonality of the POE-coded genotype with the additive-coded genotype and the dominance-coded genotype. Non-random mating could decrease the frequency of heterozygotes, while sex-specific allele frequencies cause the frequencies of the amo Afa and Amo afa heterozygotes to differ. Accurate phasing is required so that the different heterozygotes are correctly called; if they are not, Z𝛾 is measured with error, diluting estimates of the Z𝛾 , y association, hence downward-biasing estimates of 𝜎𝛾2. Power analysis via Haseman–Elston regression approximation The power of G-REML analysis can be approximated in a Haseman–Elston (HE) regression framework where each
distinct pair of individuals in the sample is used as the unit of analysis (Elston et al. 2000; Chen 2014; Visscher et al. 2014). In this framework, the outcome variable is the centered cross-product of phenotypes for each pair of unrelated individuals in the analysis (denoted Yij for individuals i and j) and the predictor variables are the GRM entries under additive-coding ( Aij), dominance-coding (Δij), and POEcoding (Γij) of the pair. The coefficients of the predictors in the associated ordinary least squares regression are estimates of the phenotypic variance due to each type of effect. This is similar to unweighted least squares estimation in covariance structure modelling (Browne 1982). Wald tests of significance for the variance components can be made using the assumption that the residuals in the regression are approximately normally distributed (Chen 2014). We focus on univariate HE regression. The justification for this is that the standardized coded genotypes are orthogonal at each locus and the population values of all cross-locus, cross-coding correlations are 0 (assuming random mating under a polygenic model where causal loci are randomly distributed along the genome, see the Appendix in the Supplementary Materials for derivations). This means that the products of the GRMs 𝐀, 𝚫, and 𝚪 are expected to be 0 and that sample cross-locus, crosscoding correlations will tend to decrease with increasing sample size and number of effective loci. Thus, the genetic relationship between two individuals should be entirely captured by their entries in the three GRMs. For example, the correlation between individual i’s additive coded genotypes (the 1 × m row vector 𝐳′𝛂,i) and individual v’s dominance coded genotypes (the m × 1 column vector 𝐳𝛅, v) is expected to be 0 and to be bound more closely to 0 with increasing sample size n, per Eq. 4. The correlation between codings will have mean 0 and variance n−1 over repeated sampling, which we denote using the Op notation to imply that its value is bounded in probability by Chebychev’s inequality as n increases (Bishop et al. 1975, chap. 14); the equality is approximate because the sample correlation is not strictly uncorrelated with i and v’s coded genotypes.
{ �} 𝐀𝚫 iv = m−2 𝐳�𝛂,i 𝐙𝛂 � 𝐙𝛅 𝐳𝛅, v ∑ { { } } = m−2 z𝛼, ik 𝐙𝛂 � 𝐙𝛅 kl z𝛿, vl , where 𝐙𝛂 � 𝐙𝛅 kl is the sample all loci k, l
correlation of additive coding at locus k, dominance coding at locus l ∑ ( ) =m z𝛼, ik Op n−1 z𝛿, vl −2
all loci k, l −2
( ) ≈ m Op m2 n−1 ≈ Op (n−1 )
13
(4)
Behav Genet
This prediction was supported by the empirical analysis, in which the off-diagonal elements of the GRMs were uncorrelated (r𝛼, 𝛾 = 5 × 10⁻⁵,r𝛼, 𝛿 = −2 × 10⁻⁴, r𝛾, 𝛿 = 6 × 10⁻⁴). Supplementary Figure S1 illustrates this lack of correlation; while Supplementary Table SI shows that the diagonal elements of the empirical GRMs were close to 1. Orthogonality between codings means that simple HE regressions of Y on each coded genotype’s GRM will yield the same estimates (and associated Wald test statistics) as a multiple regression, and we can analyze the power of simple regressions but fit multiple components in practice. The Wald test statistic of a variance component, POE ( )for example, is given by ( ) 𝜒 2 ≈ F = 𝛽̂𝛾2 ∕Var 𝛽̂𝛾 = 𝜎̂ 𝛾4 ∕Var 𝜎̂ 𝛾2 . By assuming that a
recalling that the coded genotypes are orthogonal within a locus and using the expectation of vanishing cross-locus, cross-coding correlations given in the Supplementary Material. This derivation shows that the HE regression coefficient in the population is 𝜎𝛾2, hence the numerator of the Wald test statistic is 𝜎𝛾4. The denominator of the Wald F test statistic is the error variance per degree of freedom, divided ( (by the variance )) of the predictor variable, i.e. Var(𝜖)∕ Var Γij × df . Here we use the approximation that Var(𝜖) ≈ Var(Y) = 1. HE regression uses the distinct pairs of observations as the units of analysis, so the denominator degrees of freedom are 12 n(n − 1) when estimating the variance component and an intercept term. The variance of the POE GRM calculated at any single locus can be shown by direct calculation to be 1, which is also true for the additive component and(domi) nance component GRMs (given assumptions). Var Γij is interpretable as the variance of the average of these component GRMs over me loci, hence is m−1 e in this simple model. A more accurate approach (for additive variance components) is given in Appendix 1 of Goddard (Goddard 2009), in which the variance in relatedness is averaged over the number of effective loci given variation in pedigree as well as linkage disequilibrium. Visscher et al. give an empirical estimate of the number of effective loci for GRMs calculated using genome-wide common( SNPs ) in the HapMap3 panel, hence they suggest using Var Aij = 2 × 10⁻⁵ (Visscher et al. 2014). In (our model, the denominator of the Wald test sta) 2 ≈ 2m tistic is 1∕ m−1 − 1) − 2) (0.5n(n e ∕n . This means the e mean Wald test statistic is approximately n2 𝜎𝛾4 ∕2me, which is referred to a 𝜒12 distribution because the denominator degrees of freedom in the F -test are very large. This derivation is nearly identical to that used in (Visscher et al. 2014), so it is possible to use their online tool (http://cnsgenomics.
given variance component (i.e. the HE slope) is nonzero, the power of this Wald test depends on the noncentrality parameter of the associated statistic. The derivation of the noncentrality parameter is parallel for each type of coded genotype, so we focus on HE regression of POEs, following the example given for additive variance components by Visscher et al. (2014). Starting with standardized outcomes and predictor [where vech is the operator which transforms a symmetric matrix to a column vector of its lower-diagonal elements (Henderson and Searle 1979)]. Simplifying assumptions are required: (1) Y is approximately normal (very unlikely for a crossproduct phenotype) so that the Wald test statistic has an F distribution with 1 degree of freedom in the numerator and 1 n(n − 1) − 2 degrees of freedom in the denominator; and 2 (2) the amount of variance in Y explained by W is so small and the sample size so large that the Wald F test statistic is well approximated by a 𝜒12 random variable. We derive results for a set of m independent loci. The numerator of the Wald test statistic is the ( square)2of the( estimated )2 2 ̂ regression coefficient 𝛽𝛾 = Cov Yij , Γij ∕Var Γij . For individuals i and j, the expected covariance between Y and Γ is
( ) ( ) Cov Yij Γij = EGenotype E𝜀 E𝛽𝛼 ,𝛽𝛾 ,𝛽𝛿 Γij yi yj { ( ∑ ∑ = EGenotype Γij
𝛽𝜃� z𝜃, i 𝛽𝜗� z𝜗, j + E𝜀 C1 𝜀i + C2 𝜀j + C3 𝜀i 𝜀j (
)} )
𝜃∈(𝛼, Δ, 𝛾) 𝜗∈(𝛼, Δ, 𝛾)
{ =EGenotype
(
)} ∑
Γij
∑
𝛽𝜃� z𝜃, i 𝛽𝜗� z𝜗, j + E𝜀 C1 𝜀i + C2 𝜀j + C3 𝜀i 𝜀j (
)
𝜃∈(𝛼, Δ, 𝛾) 𝜗∈(𝛼, Δ, 𝛾)
{ =EGenotype
( ∑
Γij
∑
m m ∑ ∑
𝜃∈(𝛼, Δ, 𝛾) 𝜗∈(𝛼, Δ, 𝛾) k
{ =EGenotype
Γij
(
𝛽𝜃, l 𝛽𝜗, k z𝜃, il z𝜗, jk
l
)}
m
∑∑ 𝜗
k
(5)
)}
𝛽𝜗,2 k z𝜃, ik z𝜗, jk
+
∑∑
𝛽𝜃, l 𝛽𝜗, k z𝜃, il z𝜗, jk
𝜃≠𝜗 k≠l
{ ( ( ))} =EGenotype Γij 𝜎𝛼2 Aij + 𝜎Δ2 Δij + 𝜎𝛾2 Γij + Op n−1 ( ) ( ) =𝜎𝛾2 E Γ2ij = 𝜎𝛾2 Var Γij
13
Behav Genet
com/shiny/gctaPower/) to determine the power to detect a variance component of a particular size. For me loci and sample size n, the noncentrality parameters of the 𝜒12 test statistic are:
𝜆𝛼 = 0.5m−1 n(n − 1)𝜎𝛼4 e −1 𝜆𝛿 = 0.5me n(n − 1)𝜎𝛿4 𝜆𝛾 = 0.5m−1 n(n − 1)𝜎𝛾4 e
(6)
In our simulations, we used the true m, as loci were simulated without LD; in practice, we recommend the approxi−5 mation m−1 (Visscher et al. 2014), although its e ≈ 2 × 10 application to dominance variance components and POEbased variance components is based only on analogy with additive variance components and the number of effective loci will differ depending on which SNP panel is used. Implementation G-REMLadp requires a set of phased genotypes, each with parent-of-origin assignments. Mitochondrial DNA and X chromosome SNPs are excluded from analysis. In the empirical analysis, we used a Perl script to assign parent-of-origin to genotypes which had already been phased, as described below. Given a set of phased, parental-origin-assigned SNPs, we first recoded each genotype to the three-term orthogonal coding given in Table 1, stored this data in the software package MACH’s (Li et al. 2010) “dosage” format, and then called GCTA to generate GRMs for the three variance components. GCTA’s—make-grm and—make-grmd (Zhu et al. 2015) make the appropriate GRMs for the additive and dominance components directly from the MACH-formatted phased genotype. However, for POEs, we recoded each locus (in R) by subtracting the paternal minor allele indicator from the maternal indicator and wrote this to an appropriately formatted .mldose.gz file, then generated an .mlinfo.gz file from the relevant sources for the SNP data set. We input the .mldose.gz and .mlinfo.gz files to GCTA’s MACH dosage function (--dosage-mach-gz) to generate the POE GRM. We then input the additive, dominance, and POE GRMs to GCTA, with the phenotype and covariate files, to fit the mixed model and estimate variance components. We chose to estimate the variance components without constraining them to be positive so that the null distribution of test statistics would not be a mixture (Visscher 2006). We also used the AI-REML algorithm instead of the Newton–Raphson or EM algorithms to fit the model quickly. Scripts to run these analyses (as well as to perform the simulations described below) are available at the GitHub repository (https://github. com/amatrhr/g-remladp); power calculations can be performed using the GCTA-GREML power calculator at (http:// cnsgenomics.com/shiny/gctaPower/).
13
Simulations We simulated data according to the G-REMLadp model to: (1) evaluate the predicted statistical power using the Haseman–Elston regression approximation; (2) test the bias and variance of the method in response to violation of its assumptions; and (3) assess computational requirements. In simulation studies, data were simulated according to Eq. 1, and variance components were estimated using both HE regression and GCTA software. The goals were to estimate the bias and variance of the variance component estimators, the agreement between HE and GCTA estimates, and the empirical power and Type I error rates of the HE test. The design factors were: sample size n = 1000, 2000, 4000, 5000, 7500 , m = 500, 1000, 3000, 5000 S N P s ; 𝜎𝛼2 ∕Var(y) = 0, 0.017, 0.033, 0.1; 𝜎𝛿2 ∕Var(y) = 0, 0.017, 0.033, 0.1; 𝜎𝛾2 ∕Var(y) = 0, 0.017, 0.033, 0.1; a violation of HWE— simulating maternal and paternal genotypes with different minor allele frequencies (either no difference, or mothers’ allele frequency greater than fathers’ by 0.05, meaning that the HWE test statistic will have a noncentrality parameter of > 100 and power over 90% for mothers’ MAF > 0.10 and n > 1000) so that the POE-coded genotype is no longer orthogonal to the other two codings (which remain mutually orthogonal); and a second violation of HWE-simulating parental genotypes to be correlated at r = 0 or r = 0.25, on average across all simulated loci, so that the diagonal entries of the GRMs are on average less than 1 and results might be less stable numerically. The sample size and number of effective loci used were constrained to be small due to computational requirements; computing GRMs at genome scale (n > 5000, me > 106) and fitting models to them required 100% use of at least 16 processors for approximately an hour, which is feasible for single empirical analyses but not in factorial simulations with thousands of replications. The SNPs were simulated to be independent with minor allele frequencies uniformly distributed between 0.01 and 0.5. Because there were relatively few of them, the simulated SNPs had much larger individual effects than would be expected in empirical data. We chose to simulate violations of HWE to test the robustness of G-REMLadp to violations of its assumptions, and as a way of widening the breadth of the simulations. Realistically, most samples in which G-REMLadp could be applied will have filtered SNPs for violations of HWE as part of routine QC (Laurie et al. 2010). A total of 7500 replications were simulated, but in the simulation results presented here, these factors were not completely crossed. Three measures were used to evaluate the method: (1) empirical absolute bias, the average difference between the simulated variance component and the value estimated in a replication; (2) empirical sampling variance, the variance of estimated variance components over replications; and (3) power/Type I error rate,
Behav Genet
the proportion of replications in which the Wald test of a null variance component exceeded the 95% critical value under a simulated non-null/null variance component. In the simulations, we expected power to increase with increasing sample size and variance component size and decreasing number of effective loci (noting that this means a larger effect at each locus for a given variance component size in our design), and expected variance to decrease according to the same pattern. We expected that violation of assumptions would lead to detectable bias. Empirical analysis We applied G-REMLadp to a sample of up to 4753 individuals gathered as part of the Avon Longitudinal Study of Parents and Children (ALSPAC), a prospective study of health and development beginning at pregnancy. We considered 36 different phenotypes which had been previously associated with POEs or which were related to body size, development, or social functioning.See the Supplementary Material for further description of the sample, including the phenotyping and quality control procedures that we applied to it. The sample, the longitudinal study and its context, as well as its genotyping, are described in detail in two papers (Boyd et al. 2012; Fraser et al. 2013). The 36 phenotypes are listed, with summary statistics, in Supplementary Table SII. G-REMLadp estimates of additive variance components, dominance variance components, and POE variance, are listed in Supplementary Table SIII. Highly skewed phenotypes (listed in Supplementary Methods) were inverse-normal transformed prior to estimating variance components (Peng et al. 2007); fixed effects of sex and the first four ancestry-informative principal components were modelled. Parental effects and POEs have been previously studied in trios in this sample (Davey Smith et al. 2007), but not genome-wide for the 36 phenotypes. We also used the ALSPAC data to test our predictions that variance components estimated simultaneously using G-REMLadp would agree with: variance components estimated in a univariate fashion using G-REMLadp, and also with HE regression estimates. The agreement among these methods was substantial (r > 0.98 in all cases); univariate G-REMLadp results are givien in Supplementary Table SIV; univariate HE regression estimates are given in Supplementary Table SV.
Results Simulation results Power and sample size Sample size curves at a Type I error rate of 5%, based on the HE approximation, are given in Supplementary
Figure S2, for POEs responsible for 1%, 3%, 10%, and 15% of the total phenotypic variance explained, tagged by 10,000 loci. Supplementary figure S2 shows that a sample size of over 10,000 genotyped duos or trios, with probands having phased genotypes, is likely necessary to detect the largest conceivable parent-of-origin effect variances and that a sample of 50,000 individuals will be needed to detect POEs accounting for ≈ 1 − 3% of phenotypic variance, which was the size observed by Lopes et al. (2015). Figure 2 gives the empirical power, which was high because such large variance components were simulated and because me was low, with a median value of 2000 effective loci. The test involving HE regression is based on further simplifying and adding assumptions to the G-REMLadp procedure, hence discrepancies between the two approaches were expected, with the concern that large discrepancies would render the approximate power calculations unhelpful. Table SVI, in the Supplementary Material, shows that the simulated HE-based test statistics lay relatively close to their expected values. Supplementary Figures S3–S5 illustrate this graphically. Type I error rates There was no evidence that the tests of the POEs had inflated Type I error rates when assumptions were met;
Fig. 2 Empirical power curves in simulated data: Curves generated using proportions of significant Wald tests in simulated data with all assumptions specified in the text satisfied. %PoE: proportion of phenotypic variance attributable to parent-of-origin effects in the model used to generate simulated data; Sample size: number of simulated individuals with parent-of-origin determined at all loci; Power: proportion of replicates with Wald tests having p-values < 0.05. Note that the number of effective loci in this figure is an order of magnitude lower than in Supplementary Figure S2
13
Behav Genet
under these conditions, the simulated type I error rate was 0.0510. The HE-based test of the POE variance component had slightly elevated Type I error rates (0.0625) under violation of HWE due to dependence of parental genotypes. Bias and variance due to violating assumptions We observed that violating HWE increased the discrepancy between predicted and observed test statistics. However, these results do not indicate whether this was due to increased bias or variance of the estimates, or both. Additionally, because the predicted test statistics were based on many simplifying assumptions, it is possible that the increased discrepancy would not have led to incorrect inference, and it is worth exploring whether violating HWE causes the estimated variance components to be misleading in predictable ways. Results for simulations with truly null variance components are not shown. The absolute bias was under 3 × 10⁻³ for each type of variance component under all simulation conditions. Variances were similar to those for non-null estimates. Table 2 shows the GCTA results under HWE. The bias was small, less than 5% of the true parameter value for each type of variance component. There may be a tendency to increased bias and variance at larger effect sizes. Results were similar for HE model fitting. Table 3 shows the GCTA results when the HWE assumptions were violated. Additive variance components estimates did not seem to be biased or to have increased variance under violation of HWE. When parental gametes were correlated, parent-of-origin effect variance estimates were downward biased, sometimes as much as 10 or 20% of the parameter value. Biases due to correlated gametes in estimating dominance variance components were smaller but were uniformly positive. Variance of estimates did not seem to be affected by violation of HWE. Results were similar for HE model fitting. Table 2 Absolute bias and variance for G-REMLadp variance components when HWE was met, for non-null simulated effects
The GCTA and HE estimates tended to differ in the presence of correlation between parental genotypes; in this situation, HE regression estimates of POEs had higher variance (and hence higher mean-squared error) than did GCTA estimates, which is expected to be the case even in additive-only models (Yang et al. 2017). As a result, the correspondence between the two methods decreased from a HE-GCTA correlation of 0.9911(0.9908, 0.9915) with independent parental genotypes to 0.9624(0.9597, 0.9649) with correlated parents. This was not observed for estimates of the two other types of variance components. Empirical analysis Estimates and standard errors of 𝜎𝛼2, 𝜎𝛿2, and 𝜎𝛾2, calculated using GCTA to fit a multiple-component G-REMLadp are given in Supplementary Table III for the 36 phenotypes. Results for a set of five variables with large parent of origin variance component estimates are given in Table 4. The sample size of n ≈ 5000 was sufficient to detect established additive variance components for anthropometric variables such as height and fat mass. The mean estimate for additive variance components was 0.310(0.14). There is evidence for dominance variance on verbal IQ and fat mass in the sample. The mean estimate for dominance variance components was 0.026(0.15). The largest (and most reliably estimated) POE variance components were estimated for age at menarche, FVC, age at first tooth, and blood pressure. The mean estimate for POE variance was 0.018(0.08). Interestingly, height had a large, negative estimate of the POE variance component. Figure 3 presents histograms of the variance component estimates, using different colors to represent additive vs dominance vs POE variance component estimates in the 36 ALSPAC traits. Figure 3 is broadly similar to Fig. 2 of (Zhu et al. 2015), which contains histograms of variance component
N
𝜎𝛼2
𝜎𝛿2
𝜎𝛾2
#Reps 𝜎̂ 𝛼2 Bias
𝜎̂ 𝛼2 Var
𝜎̂ 𝛿2 Bias
𝜎̂ 𝛿2 Var
𝜎̂ 𝛾2 Bias
𝜎̂ 𝛾2 Var
1000 1000 1000 2000 2000 2000 4000 4000 4000
0.017 0.033 0.100 0.017 0.033 0.100 0.017 0.033 0.100
0.017 0.033 0.100 0.017 0.033 0.100 0.017 0.033 0.100
0.017 0.033 0.100 0.017 0.033 0.100 0.017 0.033 0.100
280 290 290 300 300 300 300 300 300
1.1e−03 1.9e−03 7.1e−03 2.9e−04 5.7e−04 1.6e−03 6.5e−05 1.7e−04 4.8e−04
1.5e−03 − 1.7e−03 9.0e−04 − 6.5e−05 − 1.9e−03 1.6e−03 1.2e−05 −6.2e−04 − 1.8e−03
8.9e−04 1.8e−03 5.7e−03 2.6e−04 4.9e−04 1.7e−03 6.8e−05 1.5e−04 4.4e−04
1.2e−03 − 2.0e−03 2.6e−03 4.2e−04 1.2e−03 −1.1e− 03 −8.0e−04 − 8.0e−04 1.5e−03
1.1e−03 1.8e−03 6.3e−03 2.6e−04 6.3e−04 1.6e−03 7.5e−05 1.4e−04 4.5e−04
1.0e−03 − 1.1e−04 3.0e−03 − 2.2e−03 − 2.7e−04 3.7e−03 5.0e−04 2.9e−05 − 2.6e−03
Proportion of phenotypic variance explained: by additive effects given in the 𝜎𝛼2 column, by dominance effects given in the 𝜎𝛿2 column, and by parent-of-origin effects given in the 𝜎𝛾2 column. N: number of simulated phased genotypes, #Reps: number of simulated replications, “Bias” is the absolute bias of estimates across simulated replications, “Var” is variance of estimates across simulated replications
13
Behav Genet Table 3 Absolute bias and variance for G-REMLadp variance components when HWE was violated, for non-null simulated effects Parent Corr
MAF Diff
N
𝜎𝛼2
𝜎𝛿2
𝜎𝛾2
#Reps
𝜎̂ 𝛼2 Bias
𝜎̂ 𝛼2 Var
𝜎̂ 𝛿2 Bias
𝜎̂ 𝛿2 Var
𝜎̂ 𝛾2 Bias
𝜎̂ 𝛾2 Var
0.00 0.00 0.00 0.00 0.00 0.00 0.00 0.00 0.00 0.25 0.25 0.25 0.25 0.25 0.25 0.25 0.25 0.25 0.25 0.25 0.25 0.25 0.25 0.25 0.25
0.05 0.05 0.05 0.05 0.05 0.05 0.05 0.05 0.05 0.00 0.00 0.00 0.00 0.00 0.00 0.00 0.00 0.05 0.05 0.05 0.05 0.05 0.05 0.05 0.05
1000 1000 1000 2000 2000 2000 4000 4000 4000 1000 1000 1000 2000 2000 2000 4000 4000 1000 1000 1000 2000 2000 2000 4000 4000
0.017 0.033 0.100 0.017 0.033 0.100 0.017 0.033 0.100 0.017 0.033 0.100 0.017 0.033 0.100 0.033 0.100 0.017 0.033 0.100 0.017 0.033 0.100 0.033 0.100
0.017 0.033 0.100 0.017 0.033 0.100 0.017 0.033 0.100 0.017 0.033 0.100 0.017 0.033 0.100 0.033 0.100 0.017 0.033 0.100 0.017 0.033 0.100 0.033 0.100
0.017 0.033 0.100 0.017 0.033 0.100 0.017 0.033 0.100 0.017 0.033 0.100 0.017 0.033 0.100 0.033 0.100 0.017 0.033 0.100 0.017 0.033 0.100 0.033 0.100
300 300 300 300 300 300 300 300 290 300 290 290 300 300 300 300 300 130 160 220 280 300 300 300 300
1.7e−03 1.1e−03 − 1.0e−03 − 1.4e−03 9.4e−04 2.2e−03 1.9e−04 − 6.3e−04 − 2.1e−03 6.1e−04 1.9e−03 1.7e−03 − 1.3e−04 2.0e−03 3.6e−03 2.3e−04 1.3e−03 − 4.1e−03 − 1.2e−03 − 9.1e−04 − 9.5e−04 8.4e−05 5.2e−03 − 2.9e−04 2.2e−03
1.0e−03 2.4e−03 6.6e−03 2.5e−04 5.4e−04 1.6e−03 7.2e−05 1.5e−04 4.9e−04 8.2e−04 1.6e−03 5.6e−03 2.0e−04 3.9e−04 1.5e−03 1.2e−04 3.6e−04 8.4e−04 1.7e−03 5.2e−03 1.9e−04 3.8e−04 1.4e−03 1.3e−04 3.1e−04
− 4.8e−04 1.1e−03 2.9e−04 3.5e−04 1.6e−03 − 5.2e−04 − 6.7e−04 8.3e−04 1.7e−03 1.5e−03 1.9e−03 2.1e−03 − 3.5e−04 − 9.0e−05 4.5e−03 4.0e−04 1.7e−03 3.5e−03 2.1e−04 7.1e−03 4.4e−05 2.0e−03 1.2e−03 1.5e−03 3.5e−03
9.7e−04 2.4e−03 6.4e−03 3.1e−04 5.2e−04 1.6e−03 6.9e−05 1.8e−04 5.6e−04 1.6e−04 2.5e−04 9.8e−04 5.6e−05 1.0e−04 3.8e−04 4.6e−05 1.4e−04 3.6e−04 5.6e−04 2.6e−03 1.1e−04 2.8e−04 7.4e−04 7.8e−05 2.5e−04
2.9e−03 6.6e−04 3.1e−04 − 1.8e−05 3.0e−04 6.9e−04 − 9.4e−04 − 8.2e−04 − 2.0e−04 − 1.4e−03 − 6.8e−03 − 2.5e−02 − 5.4e−03 − 6.9e−03 − 2.5e−02 − 7.1e−03 − 2.3e−02 − 3.4e−03 − 1.5e−02 − 3.1e−02 − 4.7e−03 − 8.6e−03 − 2.1e−02 − 7.8e−03 − 2.3e−02
1.0e−03 2.0e−03 5.7e−03 2.8e−04 4.8e−04 1.6e−03 8.1e−05 1.5e−04 4.3e−04 1.1e−03 2.0e−03 8.3e−03 2.8e−04 6.5e−04 2.2e−03 1.3e−04 4.7e−04 1.3e−03 2.5e−03 8.2e−03 3.2e−04 5.4e−04 1.8e−03 1.6e−04 4.8e−04
Parent Corr average correlation of parental genotypes, MAF Diff average difference in parental MAFs. Proportion of phenotypic variance explained by additive effects is given in the 𝜎𝛼2 column, by dominance effects in the 𝜎𝛿2 column, and by parent-of-origin effects in the 𝜎𝛾2 column. N number of simulated phased genotypes, #Reps number of simulated replications, “Bias” is absolute bias of estimates across simulated replications, “Var” is variance of estimates across simulated replications
Table 4 Large G-REMLadp parent of origin variance component estimates for five ALSPAC phenotypes
Phenotype
VarA
SEvarA
VarD
SEvarD
VarP
SEvarP
Age at first tooth Age at Menarche DBP FVC SBP
0.425 0.337 0.193 0.370 0.313
0.083 0.162 0.088 0.097 0.088
0.114 0.195 − 0.076 0.017 − 0.147
0.121 0.246 0.132 0.136 0.130
0.156 0.179 0.114 0.159 0.145
0.082 0.162 0.088 0.097 0.088
Variance component estimates of five standardized phenotypes in ALSPAC, estimates and standard errors generated with multiple components GCTA-GREML. VarA proportion of phenotypic variance attributable to additive genetic effects, SEvarA standard error of proportion of phenotypic variance attributable to additive genetic effects. VarD proportion of phenotypic variance attributable to dominance effects, SEvarD standard error of proportion of phenotypic variance attributable to dominance effects. VarP proportion of phenotypic variance attributable to parent-of-origin effects, SEvarP standard error of proportion of phenotypic variance attributable to parent-of-origin effects. DBP diastolic blood pressure. FVC forced vital capacity. SBP systolic blood pressure. See Supplementary Tables SIII for results on all phenotypes and SVII for unstandardized variance components
estimates for additive and dominance variance component estimates in 79 traits from the Atherosclerosis Risk in Communities cohort.
Across the 36 phenotypes surveyed, in the aggregate, additive variance components were frequently estimated reliably, positively, and away from 0. In general, if a variance
13
Behav Genet
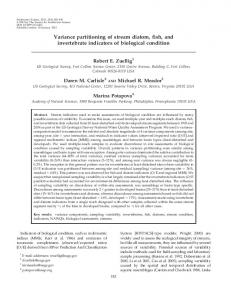
Fig. 3 Histograms of the estimates of additive, dominance, and parent-of-origin variance components for 36 ALSPAC traits. Add Estimated proportions of phenotypic variance attributable to additive effects, Dom Estimated proportions of phenotypic variance attributable to dominance effects, PoE Estimated proportions of phenotypic variance attributable to parent-of-origin effects. The bin width is 0.025. To avoid biased variance estimates, they were not constrained to be positive; hence, for POEs, which the study was underpowered to detect, there are many negative estimates. The figure is intended to illustrate patterns in the variance component estimates for the phenotypes which happened to be included in this study; it would be inappropriate to consider these histograms as representative of the densities of different variance components for complex traits in general
component was detectable, it represented additive variance. POEs had standard errors approximately equal to those of additive variance components, while estimates of dominance variance showed slightly larger standard errors. Further, half of the dominance variance components were negative and half positive. Although the sample size is too small to perform significance tests of differences in heritability estimates across traits, lipid traits tended to have negative dominance components and IQ traits positive ones.
Discussion The most important findings from our simulations are that: (1) G-REMLadp does not seem to be inherently biased in estimating variance due to additive effects, dominance effects, and POEs, and (2) that substantial correlation between parental genotypes is necessary to bias G-REMLadp estimates. We did not investigate the effect that linkage disequilibrium might have on our results, but present the correlations between codings in the Supplementary Material. If local levels of linkage disequilibrium are associated with POE size, an implementation of G-REMLadp using GCTA-LDMS would likely be able to estimate variance components without LD bias, while an LDAK implementation would have estimates at greater risk of bias (Speed et al. 2012; Yang et al. 2017). The empirical results and power calculations suggest that a sample size under 10,000
13
is insufficient to generate precise G-REMLadp estimates. Hence, POEs of the size observed by Lopes et al. (Lopes et al. 2015) (≈ 2% of variance explained) are likely to require sample sizes close to 50,000 to resolve properly (their samples were about 4500 purebred pigs, hence me far below that for humans on the HapMap 3 panel, accordingly their pattern of results is closer to our simulated findings than to our empirical ones). It is unlikely that power could be improved substantially via improved phasing using trio samples due to the already high accuracy of phasing using parent–child duos in the case of dense genome-wide SNP data (Marchini et al. 2006; Browning and Browning 2011). Despite the limited power of our analysis, it may be interesting to follow up some of the phenotypes that had high estimates of parent of origin effects in the ALSPAC cohort, like age at menarche [a phenotype known to be influenced by imprinted loci (Perry et al. 2014)] in a larger study. Replicating the dominance results for fat mass would also be of interest, as Zhu et al. (2015) found no significant dominance for skinfold thickness; similarly, replicating a dominance heritability component of verbal IQ would substantiate venerable claims for non-additive effects on cognitive performance (Devlin et al. 1997; Plomin and Deary 2015). However, the highest-profile claim (Devlin et al. 1997) for non-additive effects on IQ involves maternal effects. The evidence for this claim comes from findings of increased similarity in IQ in the children of female twins relative to the children of male twins (Nance and Corey 1976). Maternal
Behav Genet
(or paternal) effects are defined as indirect effects of the parent’s genotype on offspring phenotype, usually via parental influence on offspring’s environment (Wolf and Wade 2009). These are distinct from the POEs discussed here, because POEs are direct effects of the offspring’s genotype on its phenotype. In the presence of maternal (paternal) effects, the mother’s (father’s) genotype explains some of the residual phenotypic variation remaining after regressing the offspring’s phenotype on its genotype. However, methods designed to detect POEs by modelling different distributions of the two heterozygotes’ phenotypes (including G-REMLadp) cannot distinguish POEs from certain patterns of maternal/paternal effects (Hager et al. 2008). It is also possible that there are maternal effects that cause imprinting (epigenetic changes due to intrauterine environment or family environment created by parental behavior). To distinguish POEs from maternal effects, it might be possible to fit a model with both maternal and POEs. For example, G-REMLadp could be implemented in OpenMx and combined with the M-GCTA model (Eaves et al. 2014; Kirkpatrick and Neale 2015; Neale et al. 2015). However, POEs and maternal/paternal effects represent departure from Mendelian inheritance; a reliable nonzero 𝜎𝛾2 value detected by G-REMLadp is worthy of follow-up even if it represents a mixed bag of POEs and indirect effects. Other than the insufficient sample size in the ALSPAC analyses, an additional limitation of this project was that the simulations and empirical data were not closely matched; less idealized, more informative simulations could have been performed. For example, simulated phenotypes could have been based on the empirical distributions of the ALSPAC phenotypes, and these, coupled with real GRMs (with imperfect HWE because of sampling error, if not actual violations), could’ve resulted in more thorough evaluation of G-REMLadp. Pairwise relatedness values could also have been simulated from the empirical distributions of ( Aij, Δij, and Γij) or smooth approximations to them (Lee and Chow 2014). This approach is more feasible computationally under the HE regression framework than under maximum likelihood. The extreme-seeming violations of HWE which we used (parents’ gametes highly correlated or MAF differences between parents) are observable in certain human populations. Several localities where consanguineous marriages are common are identified in Erzurumluoglu et al. (2016). Examples include the city of Riyadh, in which first-cousin marriages (corresponding to correlation between parental gametes of 0.125) are 30–40% of all marriages; this paper also lists localities where uncle-niece marriages (gametic correlation of 0.25, as we have simulated) represent several percent of all marriages. Erzurumluoglu et al. also describe Riyadh as composed of recently immigrated subpopulations, which makes allele frequency differences possible in the remainder of marriages there.
A further drawback is that the power calculations which we present are based on the assumption that causal loci are randomly distributed throughout the genome. It is unclear the degree to which parent of origin effects are randomly distributed across the genome in humans vs being clustered at distinct loci. Dissecting the genetic basis of parent of origin effects in humans has been hampered by two factors: (1) GWAS aimed at detecting parent of origin effects have been small meaning that only a small number of common SNPs having relatively large effect have so far been identified; and (2) Many studies have restricted association analyses to regions of the genome known to be imprinted. There are anywhere from 40 to 100 regions known to be imprinted in humans (Baran et al. 2015), although recent evidence suggests that this figure may be higher (Cuellar Partida et al. 2017). Additionally, whilst imprinting is one mechanism through which parent of origin effects may manifest, there are other processes (e.g. maternal effects) that may also leave wide-spread signatures across the genome that are largely consistent with the results from parent of origin analyses. Since G-REMLadp is not necessarily limited to genomewide analyses; future work could specifically examine relatedness at known imprinted loci in the construction of GRMs, although this would require revised power calculations to estimate sufficiently large samples to account for the lower degree of tagging of phenotypic variation. A 2015 paper by Baran et al. in Genome Research, supplies an atlas of imprinted regions in the genome (Baran et al. 2015). A related future direction (as suggested by Lopes et al.) would be to emphasize the connection between imprinting and attempts to detect POEs, for example by applying the method in the EWAS, rather than GWAS, context, i.e. identifying genome-wide eQTL effects on age at menarche and first tooth, and 2d4d ratio (Zhu et al. 2016). In summary, G-REMLadp offers the ability to easily partition phenotypic variance according to three types of inherited effects. Given large studies of parent–child trios/duos (for example, MoBa), it is possible to fit G-REMLadp models and detect variance components without bias. The close agreement between GREML and HE regression approaches to estimate variance components suggests that G-REMLadp models can be fit to a good approximation even in very large studies or with limited computational resources, where HE can be up to 50 times faster than GREML (Yang et al. 2017). Finally, failure to model POEs has been suggested as one possible source of missing heritability (Kong et al. 2009; Eichler et al. 2010). For any phenotypes with missing heritability that is uncovered by modelling POEs, the epigenetic and evolutionary implications of POEs lead to hypotheses of distinctive etiologies and genomic architectures. Acknowledgements This work was supported by NHMRC Project Grant (APP1085130 to D.M.E) and a Medical Research
13
Council program grant (MC_UU_12013/4 to D.M.E). The UK Medical Research Council and the Wellcome Trust (Grant refs: 092731 and 102215/2/13/2) and the University of Bristol provide core support for ALSPAC. D.M.E is supported by an Australian Research Council Future Fellowship (FT130101709). J.Y. is supported by the Sylvia & Charles Viertel Charitable Foundation Senior Medical Research Fellowship. GWAS data was generated by Sample Logistics and Genotyping Facilities at the Wellcome Trust Sanger Institute and LabCorp (Laboratory Corporation of America) using support from 23andMe. We are extremely grateful to all the families who took part in this study, the midwives for their help in recruiting them, and the whole ALSPAC team, which includes interviewers, computer and laboratory technicians, clerical workers, research scientists, volunteers, managers, receptionists and nurses. This publication is the work of the authors and D.M.E will serve as guarantor for the contents of this paper. Compliance with ethical standards Conflict of interest The authors declare that they have no conflict of interest. Ethical approval All procedures performed in studies involving human participants were in accordance with the ethical standards of the ALSPAC Ethics and Law Committee and the Local Research Ethics Committees and with the 1964 Helsinki declaration and its later amendments or comparable ethical standards. For this type of study (retrospective, non-experimental) formal consent is not required. Informed consent Informed consent was obtained from all individual participants included in the study. Research involving human and animal participants This article does not contain any studies with animals performed by any of the authors. Open Access This article is distributed under the terms of the Creative Commons Attribution 4.0 International License (http://creativecommons.org/licenses/by/4.0/), which permits unrestricted use, distribution, and reproduction in any medium, provided you give appropriate credit to the original author(s) and the source, provide a link to the Creative Commons license, and indicate if changes were made.
References Álvarez-Castro JM (2014) Dissecting genetic effects with imprinting. Front Ecol Evol 2:51–59 Baran Y, Subramaniam M, Biton A, Tukiainen T, Tsang EK, Rivas MA, Pirinen M, Gutierrez-Arcelus M, Smith KS, Kukurba KR, Zhang R (2015) The landscape of genomic imprinting across diverse adult human tissues. Genome Res 25:927–936 Bishop Y, Feinberg S, Holland P (1975) Discrete multivariate analysis: theory and practice. MIT Press, Cambridge Boyd A, Golding J, Macleod J, Lawlor DA, Fraser A, Henderson J, Molloy L, Ness A, Ring S, Davey Smith G (2012) Cohort profile: the’children of the 90s’-the index offspring of the Avon longitudinal study of parents and children. Int J Epidemiol 42:111–127 Browne MW (1982) Covariance structures. Topics in applied multivariate analysis. Cambridge University Press, Cambridge, pp 72–141 Browning SR, Browning BL (2011) Haplotype phasing: existing methods and new developments. Nat Rev Genet 12:703–714
13
Behav Genet Campos DAG, Sorensen D, Gianola D (2015) Genomic heritability: what is it? PLOS Genet 11:1–21 Chen G-B (2014) Estimating heritability of complex traits from genome-wide association studies using IBS-based Haseman– Elston regression. Front Genet 5:107–120 Clemons T (2000) A look at the inheritance of height using regression toward the mean. Hum Biol 72:447–454 Cuellar Partida G, Laurin C, Ring SM, Gaunt TR, Relton CL, Davey Smith G, Evans DM (2017). Imprinted loci may be more widespread in humans than previously appreciated and enable limited assignment of parental allelic transmissions in unrelated individuals. bioRxiv. doi:10.1101/161471 Davey Smith G, Steer C, Leary S, Ness A (2007) Is there an intrauterine influence on obesity? Evidence from parent child associations in the Avon Longitudinal Study of Parents and Children. Arch Dis Child 92:876–880 Devlin B, Daniels M, Roeder K (1997) The heritability of IQ. Nature 388:468–471 Eaves LJ, Pourcain BS, Smith GD, York TP, Evans DM (2014) Resolving the effects of maternal and offspring genotype on dyadic outcomes in genome wide complex trait analysis (M-GCTA). Behav Genet 44:445–455 Eichler EE, Flint J, Gibson G, Kong A, Leal SM, Moore JH, Nadeau JH (2010) Missing heritability and strategies for finding the underlying causes of complex disease. Nat Rev Genet 11:446–450 Elston RC, Buxbaum S, Jacobs KB, Olson JM (2000) Haseman and Elston revisited. Genet Epidemiol 19:1–17 Erzurumluoglu AM, Shihab HA, Rodriguez S, Gaunt TR, Day IN (2016) Importance of genetic studies in consanguineous populations for the characterization of novel human gene functions. Ann Hum Genet 80:187–196 Falconer DS, Mackay TF (1996) Introduction to quantitative genetics, 4th edn. Pearson Education, Harlow Fraser A, Macdonald-Wallis C, Tilling K, Boyd A, Golding J, Davey Smith G, Henderson J, Macleod J, Molloy L, Ness A, Ring S (2013) Cohort profile: the Avon Longitudinal Study of Parents and Children: ALSPAC mothers cohort. Int J Epidemiol 42:97–110 Goddard M (2009) Genomic selection: prediction of accuracy and maximisation of long term response. Genetica 136:245–257 Guilmatre A, Sharp A (2012) Parent of origin effects. Clin Genet 81:201–209 Hager R, Cheverud JM, Wolf JB (2008) Maternal effects as the cause of parent-of-origin effects that mimic genomic imprinting. Genetics 178:1755–1762 Hall JG (1990) Genomic imprinting: review and relevance to human diseases. Am J Hum Genet 46:857–873 Henderson HV, Searle SR (1979) Vec and vech operators for matrices, with some uses in jacobians and multivariate statistics. Canad J Statist 7:65–81 Hoggart CJ, Venturini G, Mangino M, Gomez F, Ascari G, Zhao JH, Teumer A, Winkler TW, Tsernikova N, Luan J, Mihailov E (2014) Novel approach identifies SNPs in slc2a10 and kcnk9 with evidence for parent-of-origin effect on body mass index. PLoS Genet 10:e1004508 Kirkpatrick R, Neale M (2015) Combining genomic-relatedness-matrix restricted maximum likelihood (greml) with structural equation modeling in OpenMx. Behav Genet 45:665–665 Kong A, Steinthorsdottir V, Masson G, Thorleifsson G, Sulem P, Besenbacher S, Jonasdottir A, Sigurdsson A, Kristinsson KT, Jonasdottir A, Frigge ML (2009) Parental origin of sequence variants associated with complex diseases. Nature 462:868–874 Laurie CC, Doheny KF, Mirel DB, Pugh EW, Bierut LJ, Bhangale T, Boehm F, Caporaso NE, Cornelis MC, Edenberg HJ, Gabriel SB (2010) Quality control and quality assurance in genotypic data for genome-wide association studies. Genet Epidemiol 34:591–602
Behav Genet Lawson HA, Cheverud JM, Wolf JB (2013) Genomic imprinting and parent-of-origin effects on complex traits. Nat Rev Genet 14:609–617 Lee JJ, Chow CC (2014) Conditions for the validity of snp-based heritability estimation. Hum Genet 133:1011–1022 Li Y, Willer CJ, Ding J, Scheet P, Abecasis GR (2010) Mach: using sequence and genotype data to estimate haplotypes and unobserved genotypes. Genet Epidemiol 34:816–834 Lopes MS, Bastiaansen JW, Janss L, Knol EF, Bovenhuis H (2015) Estimation of additive, dominance, and imprinting genetic variance using genomic data. G3 5:2629–2637 Marchini J, Cutler D, Patterson N, Stephens M, Eskin E, Halperin E, Lin S, Qin ZS, Munro HM, Abecasis GR, Donnelly P (2006) A comparison of phasing algorithms for trios and unrelated individuals. Am J Hum Genet 78:437–450 Nance WE, Corey LA (1976) Genetic models for the analysis of data from the families of identical twins. Genetics 83:811–826 Neale MC, Hunter MD, Pritikin JN, Zahery M, Brick TR, Kirkpatrick RM, Estabrook R, Bates TC, Maes HH, Boker SM (2015) OpenMx 2.0: extended structural equation and statistical modeling. Psychometrika 81:1–15 Neugebauer N, Räder I, Schild H, Zimmer D, Reinsch N (2010) Evidence for parent-of-origin effects on genetic variability of beef traits. J Anim Sci 88:523–532 Nishio M, Satoh M (2015) Genomic best linear unbiased prediction method including imprinting effects for genomic evaluation. Genet Sel Evol 47:32–41 Patten M, Ross L, Curley J, Queller DC, Bonduriansky R, Wolf JB (2014) The evolution of genomic imprinting: theories, predictions and empirical tests. Heredity 113:119–128 Peng B, Yu RK, DeHoff KL, Amos CI (2007) Normalizing a large number of quantitative traits using empirical normal quantile transformation. BMC Proc 1(Suppl 1):S156 Perry JR, Day F, Elks CE, Sulem P, Thompson DJ, Ferreira T, He C, Chasman DI, Esko T, Thorleifsson G, Albrecht E (2014) Parentof-origin-specific allelic associations among 106 genomic loci for age at menarche. Nature 514:92–97 Peters J (2014) The role of genomic imprinting in biology and disease: an expanding view. Nat Rev Genet 15:517–530 Plomin R, Deary IJ (2015) Genetics and intelligence differences: five special findings. Mol Psychiatry 20:98–108
Santure AW, Spencer HG (2006) Influence of mom and dad: quantitative genetic models for maternal effects and genomic imprinting. Genetics 173:2297–2316 Schaeffer L, Kennedy B, Gibson J (1989) The inverse of the gametic relationship matrix. J Dairy Sci 72:1266–1272 Smith GD, Steer C, Leary S, Ness A (2007) Is there an intrauterine influence on obesity? Evidence from parent–child associations in the Avon longitudinal study of parents and children (ALSPAC). Arch Dis Child 92:876–880 Speed D, Hemani G, Johnson MR, Balding DJ (2012) Improved heritability estimation from genome-wide SNPs. Am J Hum Genet 91:1011–1021 Spencer HG (2002) The correlation between relatives on the supposition of genomic imprinting. Genetics 161:411–417 Spencer HG (2009) Effects of genomic imprinting on quantitative traits. Genetica 136:285–293 Visscher PM (2006) A note on the asymptotic distribution of likelihood ratio tests to test variance components. Twin Res Hum Genet 9:490–495 Visscher PM, Hemani G, Vinkhuyzen AA et al (2014) Statistical power to detect genetic (co) variance of complex traits using SNP data in unrelated samples. PLoS Genet 10:e1004269 Wallace C, Smyth DJ, Maisuria-Armer M, Walker NM, Todd JA, Clayton DG (2010) The imprinted dlk1-meg3 gene region on chromosome 14q32. 2 alters susceptibility to type 1 diabetes. Nat Genet 42:68–71 Wolf JB, Wade MJ (2009) What are maternal effects (and what are they not)? Philos Trans R Soc Lond B Biol Sci 364:1107–1115 Yang J, Zeng J, Goddard ME, Wray NR, Visscher PM (2017) Concepts, estimation and interpretation of SNP-based heritability. Nat Genet 49:1304–1310 Zhu Z, Bakshi A, Vinkhuyzen AA, Hemani G, Lee SH, Nolte IM, van Vliet-Ostaptchouk JV, Snieder H, Line Lines Cohort Study, Eski T, Milani L (2015) Dominance genetic variation contributes little to the missing heritability for human complex traits. Am J Hum Genet 96:377–385 Zhu Z, Zhang F, Hu H, Bakshi A, Robinson MR, Powell JE, Montgomery GW, Goddard ME, Wray NR, Visscher PM, Yang J (2016) Integration of summary data from GWAS and eQTL studies predicts complex trait gene targets. Nat Genet 48:481–487
13