Passive seismic methods using the microtremor wave field for engineering and earthquake site zonation Michael W. Asten Centre for Environmental and Geotechnical Applications of Surface Waves (CEGAS) School of Geosciences, Monash University, Melbourne, Vic. Australia
[email protected]
SUMMARY The microtremor wave-field consists predominantly of fundamental-mode surface waves which can provide seismic sounding information. The most common sources of microtremor seismic energy are road traffic, industrial machinery, and meteorological sources such as wave action. Velocity studies with the microtremor wave-field enable passive seismic investigations which are interpreted to yield a shear-wave velocity-depth profile; the technique is an analog of the better-known electrically passive magneto-telluric exploration technique. The microtremor array method works well in areas where conventional seismic methods are difficult to justify for reasons of cultural noise, environmental restraints and safety. Recent studies demonstrate the usefulness of the microtremor array method over a range of tasks including: estimation of thickness and shear-velocity of sands overlying lower-velocity clays in 50 to 100 m of Quaternary cover in the Perth basin, the study of a 15 m thickness of high-velocity basalt overlying river sediments in the Melbourne area, and the assessment of thickness and shear-velocity of sediments to 1000 m depth in the Santa Clara valley, California. Future possible exploration applications include seismic soundings for reconnaissance mapping of the thickness of regolith over prospective basement rocks, and independent estimation of sediment thickness for complementing EM sounding data in salinity studies. Key words: microtremor, passive seismic, surface wave, geotechnical engineering, salinity, SCPT, regolith.
INTRODUCTION The background to the microtremor method (MTM) used for estimating shear-wave velocities (SWVs) has been reviewed by many authors (eg. Tokimatsu ,1997; Okada, 2003; Asten, 2003). Microtremors are the background movement of the earth attributable to non-seismic sources. In the frequency band of interest in this study (1 to 40 Hz), sources are principally cultural noise such as vehicle traffic and industrial machinery, and the mode of propagation of the seismic energy is principally surface waves. For studies in metropolitan areas, the MTM is especially useful as the seismic noise which degrades active seismic methods (such as seismic reflection and refraction surveys) provides a plentiful source of energy for passive seismic methods. SEG 74th Annual Meeting Denver 2004
The microtremor method (also called the microseismic method) has a fascinating history. Aki (1957, 1965) laid the foundation of the array processing technique now known as spatial autocorrelation or spatially averaged coherency (SPAC) which provides the key to extraction of phase velocity dispersion information from seismic arrays when the energy sources are multi- or omni-directional. Aki’s work preceded the era of digital recording and processing of seismic data, and the method was later put on a sound theoretical and empirical base by Japanese seismologists in the 1980s and 1990s (Okada, 2003) who applied the method primarily for site zonation studies in earthquake hazard assessment. A parallel branch of microtremor studies also originated in Japan in the same period, using single-station threecomponent measurements of microtremor spectra as a tool for mapping shear-wave site amplification effects, again driven by the need for earthquake hazard assessment. Plots of horizontal/vertical particle motion spectral ratio (HVSR) typically provide spectral peaks near shear-wave resonances of unconsolidated sediments overlying hard basement, a fact first reported by Nakamura (1989) and now in regular use around the world as a useful semi-quantitative tool for rapid site assessment; refer to Tokimatsu (1997) or Asten and Dhu (2004) for further discussion of HVSR methods. In microtremor studies to date in Australia we have endeavoured to combine both the SPAC method for velocities and the HVSR method (Asten et al 2003; Asten and Dhu, 2004 and references therein), but in this paper we review only the former. As noted above, microtremor seismic energy propagates primarily as surface waves. While it is possible to separate and measure both Rayleigh and Love wave propagation using an array of three-component geophones (Chouet et al, 1998; Okada, 2003) it remains logistically simpler to record only vertical components, which restricts velocity analysis to Rayleigh waves only. Furthermore, the fundamental mode dominates over other modes of propagation, so basic interpretation can be performed using the simplifying assumption of fundamental mode propagation only. See Asten and Dhu (2004) for a discussion on the existence, identification and uses of higher-mode energy in the microtremor method. Surface-wave energy propagates laterally at the surface of the earth, with a particle motion amplitude which decays with depth; the decay with depth occurs over approximately a wavelength, so short wavelengths sample the acoustic parameters of near surface layers (eg soils and regolith) while long wavelengths sample the acoustic parameters of basement rocks. Interpretation of the data uses the principle that the Rayleigh-wave dispersion curve of measured phase velocity vs frequency can be matched with a theoretical dispersion curve for a suitably chosen layered earth. The interpretation Extended Abstracts
Asten
for a single array can be considered to be a passive-field “seismic sounding” quite analogous in concept and resolution to its electrical counterpart; the magneto-telluric method. The principal acoustic parameters which affect Rayleigh wave propagation are layer shear wave velocity (SWV) and thickness, hence it is the SWV profile which we seek in interpretation of MTM data.
ARRAY PROCESSING The first step in processing data from the seismic array is computation of the matrix of inter-station coherency spectra cij (f), where i,j are subscripts for all pairs of the n stations in the array. Two array processing algorithms are commonly used to determine propagation velocity of the microtremor energy. The most successful results from array studies of highfrequency microtremors (> 1Hz) have been achieved using the SPAC method. The strength of SPAC techniques is that they are effective in yielding wave scalar velocity when the wave field is multi-directional or omni-directional, since they do not seek to determine wave direction, only the scalar velocity. Beam-forming methods as used by eg. Capon (1969), Liu et al (2000), and Satoh et al (2001) have been successful, but they lose resolution and suffer from bias when multiple sources are present (Asten, 1976), and have a considerably shorter longwavelength limitation relative to array aperture than the SPAC technique (Okada, 2003). The basic property of the SPAC method is that for uni-modal wave propagation and noise-free data, coherencies when averaged over a set of azimuths around a circle or half-circle of pairs of stations having the same separation distance r, take the form given by Aki (1957) ave c(f) = J0 (kr) = J0 (2 π f r / V(f) ), -----(1) where ave c(f) is azimuthally-averaged coherency, f = frequency, J0 is the Bessel function of zero order, k is the scalar wavenumber, and V(f) is the required phase velocity dispersion curve. This relationship is strictly valid for a single plane wave detected by an infinite number of geophones on the circular array, and is valid for a finite array when the distribution of sources in azimuth is equal to the angular station separation (Asten, 2003; Asten and Dhu, 2004).
ARRAY TYPES The most common arrays for SPAC measurements are triangular or consist of multiple triangles. The radial separation of stations is chosen depending on the desired depth of investigation and the range of Rayleigh-wave wavelengths which need to be detected. Okada (2003) gives a range of examples with triangles ranging from 5 m to 868 m side length. Flores (personal communication, and Asten, 2004) designed an array of nested triangles with side lengths up to 300 m where the target was thickness of HolocenePleistocene sediments to order 1 km depth in the Santa Clara Valley, California. The four-station triangular array has the advantage of allowing estimation of SPAC over two radial distances simultaneously, as noted by Okada (2003) and Apostolides et al (2004). The hexagonal array used in most observations in Australia to date (Roberts and Asten, 2004,
SEG
Passive seismic methods
this Volume) has the further advantage of yielding independent estimation of SPAC over four radial distances simultaneously. The advantage of multiple radial distances is two-fold, (a) it facilitates identification of the presence of higher-mode energy, and (b) it provides redundancy allowing improved accuracy of interpretation in the presence of noise.
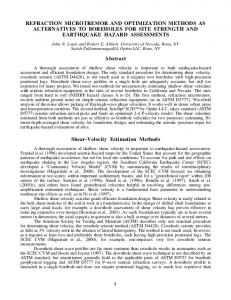
A FIELD EXAMPLE Asten et al (2003) report on microtremor observations acquired from five sites along a 20 km east-west transect of Perth’s northern suburbs where Quaternary sands and silts overlie Permian sandstones of the Perth Basin. The sites were each within 1 km of a drill-hole, and three sites were adjacent to seismic cone penetrometer tests (SCPT), which allows for some independent comparison of the SWV profiles derived from the SCPT and MTM measurements. The sites were selected from sports fields and green-belt areas in suburban Perth, where conventional seismic methods would be difficult to apply for safety and environmental reasons. The classical method of analysis of MTM data is to fit coherencies at each frequency to a Bessel function curve, and thus obtain a value for phase velocity V(f) (Okada, 2003; Ohori, 2002). The phase velocity data is then fitted to modelled phase-velocity dispersion curves either by iterative forward modelling, or by inversion algorithms. In this work we use an alternative procedure following Asten et al. (2002) whereby we compute modelled phase velocity dispersion curves, compute modelled coherency vs frequency spectra via eqn (1), and then fit observed and model coherencies by iterative modelling. The modelled dispersion curves are obtained for layered earths by using routines published by Herrmann (2001). This approach is similar to that used by Chouet et al (1998), and proves to be more robust than the classical SPAC methodology. Figure 1 presents observed and modelled coherencies for an array at Site 4 (Warwick, W.A.). This site has an SCPT measurement within 50 m of the array, and a drill-hole 1 km south of the site. Figure 1f shows a shear-wave velocity model constructed from the SCPT and drill-hole data, together with a modified result obtained by iterative fitting to gain the best-fit coherency match shown in Figure 1(a-d). The two SWV profiles are a close match except for layer 3 where the microtremor data resolves a shear velocity which is 20% lower than that derived from the SCPT data. Study of Figure 1 shows that meaningful fitting of observed and model SPAC spectra is possible from a maximum high frequency of 40 Hz (with the 25 m radius array) to a lowfrequency limit of 2 Hz. Using sensitivity guidelines from Asten (1976) the maximum sensitivity of Rayleigh-wave velocity to the SWV profile is at depths of about 30% of the wavelength, ie 0.3 V/f. We may deduce that useful data on acoustic parameters for Site 2 in Figure 1f is obtained over the depth range 2.4 to 150 m as shown in Table 1. In the Perth data, the maximum depth of investigation is determined partly by the depth to competent rock (50 to 100 m), partly by the maximum array size used (radius 50 m), and partly by the geophones (resonant frequency 1 Hz). The use of the MTM with larger arrays with radial spacings of 300 m, together with low-frequency seismometers (natural period 30sec) allows estimation of the SWV profile to depths of
Asten
order 1000 m in current studies of Holocene-Pleistocene sediments in the Santa Clara Valley, California (Asten, 2004a).
ALTERNATIVE APPLICATIONS OF MTM Experience from the set of five sites in Perth shows that the MTM is capable of yielding a SWP with resolution of +- 10%, over a depth range of 2 to 100 m. The MTM has the further advantage that it is non-intrusive and is not blocked by gravels or coarse sands, hence it may have general applications either complementing or replacing SCPT investigations. Asten et al (2003) and Roberts and Asten (2004, this Volume) show examples where the MTM at the geotechnical engineering scale is able to estimate depth to top and base of a low velocity layer beneath a higher-velocity overlying layer. The ability to resolve such layering gives the MTM an advantage over refraction seismic methods, although the resolution of MTM will in general be inferior since it does not and cannot map an interface using individual ray-paths. However in orientation-level geotechnical engineering site studies requiring information such as estimates of thickness of overlying basalt, depth of paleo-channels, and soil strength (eg. rippability), results to date suggest the MTM can provide useful information without use of active seismic investigations. Salinity studies are an area of obvious new application, complementing EM methods. EM methods are well known for the difficulty of resolving separately the thickness and conductivity of units containing saline ground waters. It is a useful proposition that MTM should be capable of providing an independent estimate of sediment thickness (unaffected by the level of salinity) thus allowing improved estimates of conductivity and pore-fluid salinity of sediments from combined EM and MTM data. The measurement of regolith thickness over prospective basement rocks is another feasible area of application of the MTM. Active seismic methods for regional studies are expensive, whereas MTM can be applied as a set of “spot soundings” at any desired density, supplementing or in filling between available borehole data.
CONCLUSIONS The passive seismic or MTM has been demonstrated to provide useful SWV profiles over depth ranges from 2 to 1000 m. The method is non-invasive and can be applied as a set of spot soundings making it a viable reconnaissance tool for assessment of earthquake site response and geotechnical engineering site studies. Results suggest that applications also exist in general regolith studies and in salinity studies as a tool complementary to EM sounding.
ACKNOWLEDGMENTS Field data was acquired as part of collaborative research between Monash University and Geoscience Australia, funded jointly by Geoscience Australia, Monash University, and Flagstaff GeoConsultants. Processing and modelling methodology is funded in part by Grant #4HQGR0030 of the USGS NEHRP External Grants Program.
REFERENCES Aki, K. ,1957, Space and time spectra of stationary stochastic waves, with special reference to microtremors. Bull, Earthq. Res. Inst, Vol 35, pp 415-456.
SEG
Passive seismic methods
Aki, K.,1965, A note on the use of microseisms in determining the shallow structures of the earth's crust: Geophysics, 30, 665-666. Apostolidis,P, Raptakis, D., Roumelioti, Z., Pitilakis, K., 2004, Determination of S-wave velocity structure using microtremors and SPAC method applied in Thessaloniki (Greece): Soil dynamics and earthquake engineering, 24, 49-67. Asten M.W., 1976, The use of microseisms in geophysical exploration: PhD Thesis, Macquarie University. Asten, M.W., Dhu, T., Jones, A., and Jones, T., 2003, Comparison of shear-velocities measured from microtremor array studies and SCPT data acquired for earthquake site hazard classification in the northern suburbs of Perth W.A., in “Earthquake Risk Mitigation”, (Eds) J.L. Wilson, N.K. Lam, G. Gibson, B. Butler, Proceedings of a Conference of the Australian Earthquake Engineering Soc., Melbourne, Paper 12. Asten, M.W., 2003, Lessons from alternative array design used for high-frequency microtremor array studies, in “Earthquake Risk Mitigation”, (Eds) J.L. Wilson, N.K. Lam, G. Gibson, B. Butler, Proceedings of a Conference of the Australian Earthquake Engineering Soc., Melbourne, Paper 14. Asten, M.W., 2003, Historical note and preface to SEG translation of “The Microseismic Method”, in H. Okada, “Microseismic Survey Method”: Society of Exploration Geophysicists of Japan. Translated by Koya Suto, Geophysical Monographs, Vol 12. Tulsa: Society of Exploration Geophysicists, 2003. Asten, M.W., 2004, Method for site hazard zonation, Santa Clara valley: Thickness and shear-velocity mapping of HolocenePleistocene sediments by array studies of microtremors. Presented at First Annual Northern California Earthquake Hazards Workshop, January 13-14, 2004, USGS, Menlo Park. Asten,M.W., Dhu, T., and Lam,N., 2004, Optimised array design for microtremor array studies applied to site classification; observations, results and future use: Proceedings of the 13th World Conference of Earthquake Engineering, Vancouver. In press for Aug 2004. Capon, J., 1969, High-resolution frequency-wavenumber spectrum analysis. Proc. IEEE, Vol 57, pp 1408-1418. Chouet, B., De Luca, G., Milana, G., Dawson, P., Martini, M., and Scarpa, R., 1998, Shallow velocity structure of Stromboli Volcano, Italy, derived from small aperture array measurements of Strombolian tremor. Bull. Seism.Soc. Am. Vol 88 pp. 653666. Herrmann, R.B., 2001, Computer programs in seismology - an overview of synthetic seismogram computation Version 3.1, Department of Earth and Planetary Sciences, St Louis Univ. Liu H, Boore DM, Joyner WB, Oppenheimer DH, Warrick RE, Zhang W, Hamilton JC & Brown LT., 2000, Comparison of phase velocities from array measurements of Rayleigh waves associated with microtremor and results calculated from borehole shear-wave velocity profiles. Bull. Seism. Soc. Am. Vol 90, pp 666-678. Nakamura, Y., 1989, A method for dynamic characteristics estimation of subsurface using microtremors on the ground surface, Quarterly reports of the Railway Technical Research Institute Tokyo, Vol 30, pp 25-33. Ohori, M., Nobata, A., and Wakamatsu, K., 2002, A comparison of ESAC and FK methods of estimating phase velocity using arbitrarily shaped microtremor arrays. Bull. Seism. Soc. Am. Vol. 92, pp. 2323-2332. Okada, H., 2003, The Microseismic Survey Method: Society of Exploration Geophysicists of Japan. Translated by Koya Suto, Geophysical Monograph Series No. 12, Society of Exploration Geophysicists, Tulsa. Roberts, J., and Asten, M.W., 2004, Resolving a velocity inversion at the geotechnical scale using the microtremor (passive seismic) survey method. Exploration Geophysics, v.36 (1), 00-00, in press. Satoh, T., Kawase, H.,Iwata, T., Higashi, S., Sato, T., Irikura, K., and Huang, H., 2001, S-wave velocity structure of the Taichung basin, Taiwan, estimated from array and single-station records of microtremors. Bull. Seism. Soc. Am. Vol. 91, pp. 1267-1282. Tokimatsu, K., 1997, Geotechnical site characterization using surface waves, in Earthquake Geotechnical Engineering, editted by Ishihara. Balkema, Rotterdam.
Asten
Passive seismic methods
SITE 4 - WARWICK OPEN SPACE
(a)
(f)
WARWICK OPEN SPACE SHEAR VELOCITY MODELS SCPT initial model Best fit after iteration 0
SHEAR VELOCITY (m/s) 200 400 600
800
0
(b) DEPTH (m)
-40
(c)
(d)
-80
-120
Figure 1. Site 4, Warwick W.A.: (a) Observed coherencies for station separation 25 m, using 25 m array. (b-d): Observed coherencies for station separations 48, 83, 96 m, using 48 m radius array. Plots show observed coherency (black) and the best-fit modelled coherencies for the fundamental Rayleigh mode (red). Modelled coherencies for the first and second higher modes (yellow, green) are shown for reference, but are not used in the fitting. (e): Modelled dispersion curve of Rayleigh wave fundamental and first higher modes (black) with observed velocities computed from the observed coherencies plotted in (b-d). (f): Shear-wave velocity profile of initial model constructed from borehole thickness and SCPT data (red) plus the best-fit SWV profile (black) derived from fitting coherency data in plots (a-d).
TABLE 1
(e)
SEG
RANGE OF WAVELENGTH (8 ) & DEPTH SENSITIVITY(D) FOR RAYLEIGH WAVES AT WARWICK SITE f(Hz)
8(m)
D(m)
40
8
2.4
2
500
150