Telecommunication Systems
Path Diversification for Future Internet End-to-End Resilience and Survivability Justin P. Rohrer · Abdul Jabbar · James P. G. Sterbenz
Abstract Path Diversification is a new mechanism that can be used to select multiple paths between a given ingress and egress node pair using a quantified diversity measure to achieve maximum flow reliability. The path diversification mechanism is targeted at the end-to-end layer, but can be applied at any level for which a path discovery service is available. Path diversification also takes into account service requirements for low-latency or maximal reliability in selecting appropriate paths. Using this mechanism will allow future internetworking architectures to exploit naturally rich physical topologies to a far greater extent than is possible with shortest-path routing or equal-cost load balancing. We describe the path diversity metric and its application at various aggregation levels, and apply the path diversification process to 13 real-world network graphs as well as 4 synthetic topologies to asses the gain in flow reliability. Based on the analysis of flow reliability across a range of networks, we then extend our path diversity metric to create a composJ. P. Rohrer* E-mail:
[email protected] Tel.: +1 831 656 3196 Computer Science Department, Naval Postgraduate School Monterey, California, USA A. Jabbar* E-mail:
[email protected] Advanced Communication Systems Lab, GE Global Research Niskayuna, New York, USA J. P. G. Sterbenz E-mail: jpgs@{ittc.ku.edu|comp.lancs.ac.uk} Tel.: +1 785 864 7890 Information and Telecommunication Technology Center, The University of Kansas Lawrence, Kansas, USA and Lancaster University, Lancaster, UK * Work performed while at The University of Kansas
ite compensated total graph diversity metric that is representative of a particular topology’s survivability with respect to distributed simultaneous link and node failures. We tune the accuracy of this metric having simulated the performance of each topology under a range of failure severities, and present the results. The topologies used are from nationalscale backbone networks with a variety of characteristics, which we characterize using standard graph-theoretic metrics. The end result is a compensated total graph diversity metric that accurately predicts the survivability of a given network topology. Keywords path diversification · geographic diversity · multi-path routing · multi-path transport protocols · network resilience · survivability · disruption tolerance · dependability · reliability · availability · performability · topology · measurement
1 Introduction and Motivation Many of today’s networked devices have access to multiple partial or complete physical layer paths between endpoints, but are unable to benefit from them due to design decisions in the current Internet protocol stack that assume unipath routing. Depending on the application, the benefits of using multiple paths can be in the form of improved performance, increased dependability, or both. With global dependence on networks in general, and the Internet in particular, increasing on a daily basis, designing resilience into future networks and improving the resilience of existing networks is more important than ever. Resilience is the ability of the network to provide and maintain an acceptable level of service in the face of various faults and challenges to normal operation [43, 44, 16], and is a superset of many other disciplines including survivability, fault tolerance, disruption tolerance, dependability, and performability. In this paper we focus on the dependability aspects, recognizing that
2
Justin P. Rohrer et al.
additional mechanisms are needed to optimize performance gains across multiple paths in real time (e.g. [11]). The Internet architecture had survivability in the face of failures as a design goal [12]. It has also proven its resilience on a large scale, in large part due to the distributed nature of its components and operational protocols [26]. In spite of this, it quickly becomes apparent that there is a fragility to the performance of any given network application. Unseen perturbations in the network’s operational state may result in an end-user experience that is far from optimal. Many applications attempt to disguise these lower-level failures, and some are quite successful, however this is only possible with significant programming overhead on a per-application basis and is not optimal from a network perspective. The goal of path diversification is to provide a unified interface to a service that is as reliable as the underlying physical graph, instead of being limited by the reliability of a particular path as in the current model. This could alleviate much of the programming overhead that currently exists at the application level, providing a level of service not possible with the limited information currently provided to the end systems. At the same time, doing so requires that the end-to-end service be informed of application requirements in terms of throughput and upper delay bounds, given that there is an inherent tradeoff between maximizing path diversity and minimizing path stretch [33]. The contributions of this work are as follows: – formal definitions of the path diversity family of metrics – Path Diversification selection algorithm for choosing a set of diverse paths (including fully and partially disjoint paths) while meeting performance constraints – analysis of path diversity metrics showing them to be complementary to existing graph theoretic properties, and highly correlated to network survivability The Path Diversity metric and its aggregate properties are applied to node pairs and complete network graphs. Based on this notion of diversity we then present Path Diversification, which is a heuristic algorithm designed to select the most advantageous subset of available diverse paths between two nodes in a network under particular application constraints. It yields several derived metrics reflecting some of the characteristics of the selected paths, as well as the network as a whole. We then explore how path diversification improves reliability by comparing it both to the conventional unipath approach and the real connectivity of the underlying topology, which forms the upper performance bound in our case. We do not evaluate different path discovery mechanisms, but assume the availability of a path database that corresponds to the physical topology as has been proposed in the context of the PostModern Internetwork Architecture [7]. We then quantify the survivability of network topologies so that new or modified topologies may easily be compared quantitatively.
1.1 Terminology While we try to maintain consistency with all widely accepted definitions, there are a few key terms defined here: – Robustness: The ability of a system to maintain specified features when subject to assemblages of perturbations either internal or external. [25] – Reliability: The ability to perform a required function under stated conditions for a specified period of time. [50] – Resilience: The ability of the network to provide and maintain an acceptable level of service in the face of various faults and challenges to normal operation. [43, 44, 16] Resilience is a superset of many other disciplines. – Node pair: Any two nodes at the same hierarchical level of a particular network topology, e.g. two core nodes or two subscriber nodes. – Path: Any complete set of nodes and links that form a loop-free connection between a node-pair. – Path stretch: The ratio of the number of hops on a given path, divided by the number of hops on the shortest path. – Flow: A data association between a node-pair which may be distributed over one or more paths. – Application: The higher-level entity that specifies the service requirements of a particular flow. This may refer to a traditional software application, or an alternative motivating factor, such as an SLA (service level agreement) in the context of an ISP network. – Node degree: “The number of non-loop edges containing [the node], plus twice the number of loops containing [the node].” [54] – Clustering coefficient: “A measure of how many nodes form triangular subgraphs with their adjacent nodes.” [27] or “The fraction of paths of length two in the network that are closed” [34], which may be interpreted as “A measure of degree to which nodes in a graph tend to cluster together.” [3] – Diameter: The maximum shortest-path between any nodepair. – Radius: The minimum of the maximum shortest-path for all nodes. – Hop-count: The average shortest-path between all nodeparis. – Closeness: “The mean distance from a vertex to other vertices.” [35] Closeness is a measure of centrality and is related to node degree. – Betweenness: “Betweenness is the number of shortest paths passing through a node or link and provides a centrality or importantness measure.” [29, 19] 1.2 Design Goals In order to achieve resilience, an end-to-end flow should be able to exploit diversity to the degree that it is present in the
Path Diversification for Future Internet End-to-End Resilience and Survivability
physical network graph. Current unipath mechanisms that rely on shortest-hop single-path routing cannot accomplish this. A resilient multipath mechanism should have the following design goals in providing service to higher layers: – High flow reliability: Once established, a flow should remain stable as long as the underlying physical network is not partitioned. – End-system control: The end systems or application should have some control over the paths selected. – Optimal paths: The paths chosen should be the best available given the application’s service requirements. – Minimal impact: There should not be a negative impact on the network as a whole. (i.e. due to required control messages or duplication of data for redundancy) Section 3.4 formally describes the algorithm used in path diversification to meet these goals. The remaining sections of the paper are organized as follows: In Section 2 we present background and related research. Section 3 presents the path diversification mechanism itself. Section 4 explains our evaluation methodology and presents our findings. Section 5 compares the survivability of our 17 topologies. Section 6 ranks these topologies and presents a new composite metric for predicting network survivability, and Section 7 concludes this paper.
2 Background and Related Work While the current Internet architecture limits the use of multipath technologies, a significant amount of research has been done in this area. This section presents some characteristic examples of existing research and its relation to path diversification.
2.1 Network Survivability The study of network survivability is an extension of the study of fault-tolerance, which is the ability of a system to tolerate faults such that service failures do not result. Fault tolerance generally covers random single or at most a few failures, and is thus a subset of survivability [43, 44, 42]. The current level of reliance on the Internet in modern nations has led to the understanding that fault-tolerant designs were not sufficient and that diversity in multiple forms is needed to prevent multiple parts of the infrastructure from sharing fate and thereby protect against correlated failures [44, 9]. Survivability is the capability of a system to fulfill its mission, in a timely manner, in the presence of threats such as attacks or large-scale disasters. This definition captures the aspect of correlated failures due to an attack by an intelligent adversary [15, 45], as well as failures of large parts of the network infrastructure [30, 4, 44, 9].
3
Based on this definition, survivability may encompass a broad spectrum of failure scenarios, however the aspect about which we are concerned in this paper is the ability of a topology to remain connected (the acceptable service) [41, 42] while undergoing multiple simultaneous node and link failures (due to external challenges) [10, 9].
2.2 Graph Theoretic Approach The problem of finding paths through a network has been well studied in the context of graph theory [49] as well as routing and fiber network planning. The existing algorithms are based on different characteristics such as shortest paths, diverse, and disjoint paths [21], and optical restorability [22]. Several algorithms exist to find the shortest path or k-shortest paths that include the earliest shortest path algorithms by Ford [18], Moore [32], Dijkstra [14], and Floyd [17], along with several modifications that address negative cycles and improve on, or in some cases, trade time and space complexities [6]. Following the shortest path between a pair of nodes, several algorithms were proposed to find the k-shortest paths, which involve simple techniques such as manipulation of edge weights to highly optimized algorithms [28]. Furthermore, the concept of diverse paths has been investigated to find a pair of diverse paths, k-diverse paths, and k-shortest diverse paths. The existing literature covers techniques based on shortest path algorithms with the incremental removal of used edges to graph transformations [47, 48]. Bhandari presents efficient algorithms to compute edgedisjoint and vertex-disjoint paths [6], however, these algorithms are based on finding completely disjoint paths. Bhandari also discusses an algorithm that finds the maximally diverse paths between a pair of nodes using a modified Dijkstra’s algorithm. In this paper we use a method that draws heavily on Bhandari’s maximally-diverse paths, however we consider the contribution of partially disjoint paths to diversity. We further expand the diversity measure by applying it to a set of nodes and to a full graph. We apply our algorithm to a network scenario in which the objective is to find a set of paths such that the diversity of individual node pairs as well as the overall diversity of the network exceeds a minimum threshold. Work has been done to characterize ISP networks in terms of the redundancy present in their physical layer graphs [51]. Our work is consistent with these efforts when applied in the same context.
2.3 Multipath Routing Multipath at the network layer does not have the same endto-end semantics as it does at the transport layer, however
4
there have been a number of proposed multipath routing approaches that may have counterpart mechanisms at the transport layer. Path Splicing [33] uses multiple destination-rooted routing trees to provide multiple alternative paths that may be switched between at any intermediate node. In this approach, the source node is given control over selecting a path index at each intermediate hop, however no information about the paths is passed to the source so there is no basis on which to chose a particular set of paths. The benefit is that if the source detects packet losses and suspects a bad link, it can randomly choose a different set of path indices much faster than routing can reconverge, however it has no assurance that the new path chosen will map to a different set of physical links. A similar approach is Routing Deflections in that the source node is given some control without detailed information [55]. An alternative, which is sometimes not even thought of as a multipath solution, is to have pre-computed back-up routes in case of a link failure [26, 20]. While this can be faster than a full reconvergence, it still takes time for the nodes at the location of the failure to detect failure and begin using the alternate routes. Much of the multipath routing research, such as DETOUR [40], has been focused on the ad-hoc wireless environment in which channel conditions and resource constraints are the primary concern. 2.4 Multipath Applications There are a number of proposed application scenarios (e.g. video streaming [52, 5]) that recognize the benefits of scheduling packets across multiple disjoint paths for performance gain or to mitigate the effects of bursty channel errors. Our goal with respect to these scenarios is to expose a welldefined set of control parameters (knobs) that allow the application to express its service level requirements without placing the full burden of discovering the optimal set of paths on the application itself. 3 Path Diversification Overview The primary objective of path diversification is to select multiple paths that are as diverse as possible, while limiting the path stretch if necessary. Instantiating path diversification at any level will require the following four functions: 1. Path database indexed by source-destination pairs and including the unique identifiers for each node and link traversed. This database can be an exhaustive compilation or filtered based on administrative policy. 2. Quantified path diversity using the path diversity metric explained in the following section.
Justin P. Rohrer et al.
3. Path selection based on higher-level specifications to evaluate the tradeoff between path diversity and path stretch. 4. Packet forwarding based on the source routes distilled from the selected paths. There are many possible implementations of the path discovery database and packet forwarding mechanisms, and path diversification is agnostic to this implementations, as long as the two are decoupled to allow greater flexibility in exploiting the inherent diversity of heterogeneous internetworks [7]. The following sections discuss the measurement of path diversity and the selection of diverse paths.
3.1 Path Diversity Since the primary motivation for implementing the path diversification mechanism is to increase resilience, paths should be chosen such that they will not experience correlated failures. To this end, we define a measure of diversity (originally introduced in [38] and refined in [37]) that quantifies the degree to which alternate paths share the same nodes and links. Note that in the WAN context in which we are concerned with events and connections on a large geographic scale, a node may be thought of as representing an entire PoP, and a link as the physical bundle of fibers buried in a given rightof-way. This distinction between WAN and LAN component identifiers affects only the population of the path database, not the usage of the diversity metric. Definition 1 (Path) Given a (source s, destination d) node pair, a path P between them is a vector containing all links L and all intermediate nodes N traversed by that path P = L∪N
(1)
and the length of this path |P| is the combined total number of elements in L and N. Definition 2 (Path diversity) Let the shortest path between a given (s, d) pair be P0 . Then, for any other path Pk between the same source and destination, we define the diversity function D(Pk ) with respect to P0 as: D(Pk ) = 1 −
|Pk ∩ P0 | |P0 |
(2)
The path diversity has a value of 1 if Pk and P0 are completely disjoint and a value of 0 if Pk and P0 are identical. For two arbitrary paths Pa and Pb the path diversity is given as: D(Pb , Pa ) = 1 −
|Pb ∩ Pa | |Pa |
where |Pa | ≤ |Pb |.
(3)
Path Diversification for Future Internet End-to-End Resilience and Survivability
0
1
D(P1) = 1
3
4
D(P2) = 2/3
2
5
0
1 A
D(P1) = 1
5
3
2 d
4
5
Fig. 1 Shortest path P0 and alternatives P1 and P2
Fig. 2 Geographic diversity: distance d and area A
It has been claimed [33] that measuring diversity (referred to as novelty) with respect to either nodes or links is sufficient, however we assert that this is not the case. Figure 1 shows the shortest path, P0 , along with the alternate paths P1 and P2 both of which have a (link) novelty of 1. However, given a failure on node 1, both P0 and P2 will fail. In our approach, D(P2 ) = 32 , which reflects this vulnerability. P1 on the other hand has both a novelty of 1 and a diversity of 1, and does not share any common point of failure with P0 . Similarly, the wavelengths or fibers from multiple nodes may in fact be spliced into a single physical link such as was the case in the Baltimore Tunnel Fire [8, 46], resulting in a shared-risk link group (SRLG) [36], thus illustrating the need for including both nodes and links into the diversity measure.
3.3 Geographic Path Diversity
3.2 Effective Path Diversity Definition 3 (Effective path diversity) An aggregation of path diversities for a selected set of paths between a given node-pair (s, d). To calculate EPD we use the exponential function EPD = 1 − e−λ ksd
(4)
Definition 4 (Geographic path diversity) Given previously defined definitions of Pa and Pb 2 Dg (Pb , Pa ) = αdmin +βA
where ksd is a measure of the added diversity defined as k
ksd = ∑ Dmin (Pi )
Where geolocation tags are made available through cross layering methods, we believe it is important to measure diversity in terms of physical distances, not only node and link disjointness. The previous path diversity measures consider the sharing of components, but do not capture the geographic characteristics necessary for area-based challenges such as large-scale disasters or to prevent the geographic fate sharing of distinct links in the same conduit as in the Baltimore tunnel fire. Therefore we are augmenting the diversity measures with a minimum distance between any pair of nodes along alternate paths, and as the area inside a polygon or set of polygons, the borders of which are defined by a pair of alternate paths, as shown in Figure 2. Thus, it should be possible to specify diverse paths among a set of candidates with a given degree of sharing and distance metric EPD(d) constrained by stretch, and measure the geographic area between the paths EPD(A) as well as to measure the diversity inherent in a graph across all paths TGD(d, A). To further that end we propose the following definition of geographic path diversity:
(5)
i=1
where Dmin (Pi ) is the minimum diversity of path i when evaluated against each member of the set of previously selected paths {P1 ..Pi−1 } for that pair of nodes. λ is an experimentally determined constant that scales the impact of ksd based on the utility of this added diversity. A high value of λ (> 1) indicates lower marginal utility for additional paths, while a low value of λ indicates a higher marginal utility for additional paths. Using EPD allows us both to bound the diversity measurement on the range [0,1) (an EPD of 1 would indicate an infinite diversity) and also reflect the decreasing marginal utility provided by additional paths in real networks. This property is based on the aggregate diversity of the paths connecting the two nodes.
(6)
where dmin is the minimum distance between any member of the vector Pa and any member of the vector Pb , and A is the area of a polygon whose borders are formed by paths Pa and Pb as shown in Figure 2. α and β are weighting factors in the range [0, 1].
3.4 General Path Selection Algorithm Now, we present our path selection algorithm. Given that the number of possible paths existing between a common (source, destination) pair is z: Step 1 let A be the set of available paths between a given (source, destination) pair, in decreasing order by diversity value, where |A| = z Step 2 let n be the number of diverse paths required by the transport layer
6
Justin P. Rohrer et al.
Fig. 3 Sprint physical topology [13] in KU-TopView
Fig. 4 Sprint logical topology [1] in KU-TopView
Fig. 6 Level 3 logical topology [1]
Step 7 select set F, to be the shortest length paths from E, where |F| = n − m F = {i ∈ E : |Pi | ≤ |Pj |, ∀ j ∈ E}
(11)
Fig. 5 VSNL logical topology [1]
This step allows us to choose shorter paths when path diversities are equivalent. Step 3 let B be the smallest contiguous subset chosen from the beginning of A, where |B| = k and k ≥ n such that no members of {A − B} have a diversity ≥ any member of B B = {i ∈ A : D(Pi ) > D(Pj ), ∀ j ∈ A}
Step 4 let Dmin be the minimum diversity amongst all paths in set B (8)
Step 5 select a set C out of B which contains all the paths with a diversity greater-than Dmin , where |C| = m C = {i ∈ B : D(Pi ) > Dmin }
(9)
Step 6 let E be the remaining paths in B after removing C, where |E| = k − m E = B −C
S =C∪F
(12)
(7)
If k = n, B is the set of exactly n diverse paths required by the transport layer and the algorithm is finished, otherwise we continue with steps 4 through 8.
Dmin = min[D(Pi ), ∀i ∈ B]
Step 8 the final set S of n diverse paths is
(10)
This algorithm yields the required number of paths with the constraint that they will include the shortest path and the maximally diverse paths with the least stretch.
3.5 Measuring Graph Diversity The total graph diversity (TGD) is simply the average of the EPD values of all node pairs within that graph. This allows us to quantify the diversity that can be achieved for a particular topology, not just for a particular flow. For example a star or tree topology will always have a TGD of 0, while a ring topology will have a TGD of 0.6 given a λ of 1. Here we note that for diversity to make sense in the graph context it should be computed considering only path components (nodes and links) at the level of network hierarchy for which the diversity value is desired. For example, in computing the diversity of a service provider’s backbone,
Path Diversification for Future Internet End-to-End Resilience and Survivability
7
Table 1 Network characteristics Network
Nodes
Links
Avg. Node Degree
TGD k=4
Clustering Coefficient
Diam.
Radius
Hopcount
Closeness
Node Between.
Link Between.
Full-Mesh Manhattan Grid Ring Star
20 25 25 25
190 40 25 24
19.00 3.20 2.00 1.92
0.9502 0.8964 0.6321 0.000
1 0 0 0
1 8 12 2
1 4 12 1
1 3.3333 6.5 1.92
1 0.3067 0.1538 0.5302
0 110 132 552
1 54 78 24
AboveNet AT&T AT&T Phys. EBONE Exodus ´ GEANT2 Phys. Level 3 Sprint Sprint Phys. Telstra Tiscali Verio VSNL
22 108 361 28 22 34 53 44 263 58 51 122 7
80 141 466 66 51 51 456 106 311 60 129 310 7
7.27 2.61 2.58 4.71 4.64 3.00 17.20 4.82 2.37 2.07 5.06 5.08 2.00
0.8559 0.5881 0.9014 0.8635 0.8843 0.7623 0.9154 0.8120 0.8821 0.1295 0.7785 0.8104 0.2001
0.6514 0.3274 0.0550 0.3124 0.3307 0.2898 0.7333 0.3963 0.0340 0.2411 0.5068 0.3509 0.4167
3 6 37 4 4 9 4 5 37 6 5 8 4
2 3 19 3 2 5 2 3 19 3 3 4 2
1.7229 3.3790 13.57 2.2804 2.0563 3.4652 1.7721 2.6882 14.78 3.3025 2.4298 3.1026 2.0952
0.5947 0.3030 0.0763 0.4507 0.4978 0.3007 0.5845 0.3853 0.0700 0.3095 0.4236 0.3335 0.4982
196 4160 4527 132 132 556 664 602 3609 2136 656 3736 18
21 943 1893 42 22 131 84 129 1637 806 96 480 12
only core nodes should be considered, otherwise the comparatively vast number of subscriber nodes (typically stubs) will artificially reduce the calculated diversity. We also note here that the diversity measure is designed such that it does not penalize longer paths in favor of shorter paths, meaning that graph diameter and average path lengths are independent metrics that should be considered in addition to the diversity metric. This is discussed in further detail in Section 6.2.
3.6 Terminating Conditions In this section we describe three different modes for choosing a set of diverse paths for a given node pair: number of paths, diversity threshold, and stretch limit. The objective in the first mode is to find k maximally diverse paths. We first find the shortest fully disjoint paths, and if additional paths are required we continue finding paths that add maximum diversity as calculated using equation 5. The second mode selects as many maximally diverse paths as are required to achieve the requested EPD. Finally, the third mode selects all maximally diverse paths with stretch less than the stretch limit. In all modes, the set of maximally diverse paths are found using the Floyd-Warshall algorithm with modified edge weights [17, 53,6]. In this algorithm, only those paths are used that increase the EPD for the node pair in question. Recall that only paths with one or more disjoint elements (links,nodes) will result in non-zero Dmin and consequently increase EPD.
4 Evaluation In this section we evaluate path diversification based on its ability to reflect the connectivity of the underlying graph, and the cost incurred in doing so in terms of path stretch.
To evaluate path diversification based on realistic topologies we selected 13 service provider backbone network topologies (3 physical and 10 logical), and 4 synthetic topologies. We selected a range of connectivity as shown in Figures 4, 3, 5, and 6 in order to evaluate path diversification on topologies with a broad set of property values.1 Comparing Figures 4 and 3 we can see visually how different the diversity can be between the physical and routing layers of the same network, as is shown numerically in the following tables. Table 1 shows these properties for each network, as well as a number of standard graph metrics. For interactive visualizations of these topologies we use our web-based network mapping tool KU-TopView [2]. KU-TopView is a web-based tool we developed for several reasons. It allows for visual inspection of our hand-input topology data sets, in order to more-easily detect errors. It also facilitates easy viewing of all the topologies in our library both for us and for those interested in our research. Thirdly it facilitates comparison of networks by overlaying one on another, and allowing selection of colors and other visual characteristics. Lastly it is able to combine networks and export both the original adjacency matrices and the combined matrices for use in other tools such as KUCSM (ns-3 challenge simulation module) [10]. As will be seen in more detail in the results following, the characteristics of the topology significantly affect the diversity that can be attained. As mentioned earlier we assume the presence of a path server or equivalent service to provide the set of paths from which the selection is made. To perform this function we implemented a variation of the maximally diverse edge-disjoint path algorithm [6]. We implemented a MATLAB simulation to evaluate the diversity measure and 1 Results presented in this paper are not to serve as a recommendation of one network over another for business purposes. Due to common business practices the Internet service providers listed (with the ´ exception of GEANT2) do not make their network topology data publicly available, and the data sets used are inferred by third parties.
8
Justin P. Rohrer et al. Full mesh Level 3 ATT phys Grid Exodus Sprint phys EBONE AboveNet Sprint Verio Tiscali GEANT 2 Ring ATT VSNL Telstra Star
0.9
total graph diversity
0.8 0.7 0.6 0.5 0.4 0.3 0.2 0.1 0.0 1
2
3
4
5
6
7
8
9
10
1.0
0.8 0.7 0.6 0.5 0.4 0.3 0.2 0.1 0.0 1.0 1.5 2.0 2.5 3.0 3.5 4.0 4.5 5.0
number of paths
stretch threshold
Fig. 7 Total graph diversity vs. number of paths selected 1.0
Full mesh Level 3 ATT phys Grid Exodus Sprint phys EBONE AboveNet Sprint Verio Tiscali GEANT 2 Ring ATT VSNL Telstra Star
0.9
total graph diversity
0.8 0.7 0.6 0.5 0.4 0.3 0.2 0.1
Full mesh Level 3 ATT phys Grid Exodus Sprint phys EBONE AboveNet Sprint Verio Tiscali GEANT 2 Ring ATT VSNL Telstra Star
0.9
total graph diversity
1.0
0.0 0.0 0.1 0.2 0.3 0.4 0.5 0.6 0.7 0.8 0.9 1.0
EPD threshold
Fig. 8 Total graph diversity vs. effective path diversity threshold
necessary supporting functions. Before examining the performance of path diversification with respect to flow reliability and stretch, we will look at its ability to improve the useable diversity of the graph as a whole.
4.1 Diversity By applying the diversity measure to the selected path set of an entire graph, we observe the effectiveness of the path diversification process. To do this we select a set of paths based on a given k or EPD threshold, and then calculate the TGD based on that set of paths. In Figures 7, 8, and 9 we observe that most of the 17 topologies share similar characteristics in terms of the diversity available, although the absolute value of diversity that can be attained varies significantly. Selecting k most diverse ´ paths between nodes in the AT&T and GEANT2 graphs results in a strong increase in diversity for k < 4 with limited improvement for additional paths, as we observe in Figure 7, however the full-mesh and Level 3 graphs continues to show
Fig. 9 Total graph diversity vs. path-stretch limit
substantial improvement for k < 6. This emphasizes the fact that basing a diversity metric on a particular number of diverse paths is highly topology dependent. Figure 8 gives the TGD with respect to EPD threshold, which shows similar relative diversity values for the most of the topologies, but compresses many of the curves into a smaller vertical region, due to the fact that the measure itself is adaptive to the topology. Some of the curves in this figure exhibit a stair-step shape, caused by highly-uniform topologies in which a large number of the flows must add an additional path to meet the same incremental EPD threshold increase. This is most pronounced for the full-mesh topology, which being perfectly uniformity, has the property that all flows must have exactly the same number of paths to meet a given EPD threshold requirement. From Figure 9 we observe that in most cases, virtually no additional diversity is gained beyond a stretch threshold of 3.
4.2 Dependability A flow is established between each node pair using a set of paths determined using the path diversification algorithm and the specified diversity threshold value. To simulate link failures we remove each link from the graph based on a fixed probability of failure. To simulate node failures we remove all links connected to a particular node based on a fixed probability of failure for that node. A flow is considered reliable if at least one of its paths remains unbroken by the link or node failures. We compute flow robustness to be the number of reliable flows, divided by the total number of flows in the network. For each probability of failure, we also determine the the best flow robustness possible for any path-selection mechanism given the partitioning of the underlying graph (by calculating the fraction of node-pairs still connected), and show this value in each plot with the label “Best”. Finally, we, calculate the flow robustness using only
9
1.0
1.0
0.8
0.8
flow robustness
flow robustness
Path Diversification for Future Internet End-to-End Resilience and Survivability
0.6 0.4 0.2 0.0 0.00
Best k=10 k=6 k=3 k=2 k=1 0.05
0.6 0.4 0.2 0.0
0.10
0.15
0.20
0.25
0.00
Best k=10 k=6 k=3 k=2 k=1 0.05
probability of failure
0.10
0.15
0.20
0.25
probability of failure
Fig. 10 Flow robustness vs. link failures, Sprint logical
Fig. 12 Flow robustness vs. node & link failures, Sprint logical
1.0 1.0 0.8
flow robustness
flow robustness
0.8 0.6 0.4 0.2 0.0 0.00
Best k=10 k=6 k=3 k=2 k=1 0.05
0.6 0.4 0.2 0.0
0.10
0.15
0.20
0.25
probability of failure
0.00
Best k=10 k=6 k=3 k=2 k=1 0.05
0.10
0.15
0.20
0.25
probability of failure
Fig. 11 Flow robustness vs. node failures, Sprint logical Fig. 13 Flow robustness vs. node failures, Sprint physical
the conventional shortest path for each node pair to serve as a lower performance bound, k = 1. To accomplish all this, we start with the set of paths between all node pairs in the network selected by path diversification to meet a particular path-diversity threshold. We then remove each each edge of the graph independently with probability p. After calculating the resulting flow robustness we reset the graph and repeat the process 100 times for each probability p before continuing to the next path-diversity threshold. Each point plotted is the average of these 100 trials, and the error bars represent 95% confidence intervals.2 Taking the Sprint logical topology as an example, we show the flow robustness in the face of random link failures (Figure 10), node failures (Figure 11), and combined link and node failures (Figure 12). In the link-failure case we can clearly see that the improvement from k = 1 to k = 2 is the 2 In order to keep the number of figures manageable we show plots from a few representative topologies. The plots for the entire set of topologies may be downloaded in our online appendix at http://www.ittc.ku.edu/resilinets/papers/pd_ appendix_2012.pdf.
most significant (>30% improvement with a 25% probability of failure), and that with k = 6 we are getting pretty close to the upper bound of the graph connectivity (the fraction of node pairs not partitioned from each other, represented by the ‘Best’ curve on the plots). In the node-failure case we note three points of interest. First the confidence intervals are much larger, due to the fact that on average a single node affects more flows than a single link resulting in a coarser granularity of simulation results and more variance from one run to the next with the same probability of failure. Second, the network connectivity (shown by the curve labeled ‘Best’) drops much more rapidly than it did with only link failures, with only 40% connectivity with a 25% failure rate, as opposed to the 80% connectivity with only link failures. Third, we see that there is much less room for improvement between k = 1 and the upper bound, and that k = 2 closely approaches the upper bound. When we combine node and link failures, the network connectivity is only slightly worse than with node failures alone, however the single-path case
10
Justin P. Rohrer et al. 3.0
1.0 path reliability and stretch
unacceptable
flow robustness
0.8 0.6 0.4 Best k=10 k=6 k=3 k=2 k=1
0.2 0.0 0.00
0.05
p1 p2
< 0.5 > 1.5
2.5
2.0
impaired 0.5 ≤ p1 < 0.75 1.25 < p2 ≤ 1.5
1.5
1.0
k=1 k=2 k=3 k=10
acceptable
p1 p2
≥ 0.75 ≤ 1.25
0.5
0.0
0.0
0.10
0.15
0.20
normal 0.5
n1 n2
0.25
1.0
≥ 0.92 ≥ 0.03
partially degraded 1.5
2.0
0.8 ≤ n1 < 0.92 0.027 ≤ n2 < 0.03
severely degraded 2.5
3.0
n1 < 0.8 n2 < 0.027
LC size and clustering coefficient
probability of failure
Fig. 16 Resilience of path diversity, AT&T physical topology Fig. 14 Flow robustness vs. link failures, Level 3 logical 3.0
1.0 path reliability and stretch
unacceptable
flow robustness
0.8 0.6 0.4 0.2 0.0
Best stretch=5 stretch=4 stretch=3 stretch=2 stretch=1
0.00
0.05
p1 < 0.75 p2 > 1.5
2.5
2.0
impaired 0.75 ≤ 1.1
1.5
2.5
2.0
impaired 0.5 ≤ p1 < 0.75 1.25 < p2 ≤ 1.5
1.5
1.0
k=1 k=2 k=3 k=10
acceptable
p1 p2
≥ 0.75 ≤ 1.25
0.5
0.0
0.0
normal 0.5
n1 n2
1.0
≥ 0.92 ≥ 0.03
partially degraded 1.5
0.8 ≤ n1 < 0.92 0.027 ≤ n2 < 0.03
2.0
severely degraded 2.5
3.0
n1 < 0.8 n2 < 0.027
LC size and clustering coefficient
Fig. 18 Resilience of path diversity, Sprint physical topology
the spectrum, the VSNL is very poorly connected, resulting in a rapid drop in connectivity as links and nodes fail, and a situation where there are almost no alternate paths so path diversification provides almost no improvement over singlepath routing.
Path Diversification for Future Internet End-to-End Resilience and Survivability 3.5
Table 2 Aggregate resilience of path diversity k=1 AT&T physical ´ GEANT2 physical Sprint physical
Aggregate Resilience R k=2 k=3 k = 10
0.38858 0.48909 0.40013
0.43021 0.62584 0.42458
0.45076 0.64619 0.43445
0.47638 0.65773 0.45063
Full mesh Level 3 ATT phys Grid Exodus Sprint phys EBONE AboveNet Sprint Verio Tiscali GEANT 2 Ring ATT VSNL Telstra Star
3.0
total graph stretch
Number of paths
11
2.5 2.0 1.5 1.0 0.5
4.2.1 Resilience Improvement
0.0 0.0 0.1 0.2 0.3 0.4 0.5 0.6 0.7 0.8 0.9 1.0
Plots resulting from this framework show the normal state (normal network conditions and acceptable service performance) near the origin, with network conditions degrading to the right on the x-axis and service performance degrading upwards on the y-axis. A resilient network is one that stays in the normal operating condition while undergoing challenges, and a resilient service is one that stays in the acceptable service state as the network degrades. We quantify the degree to which a service degrades as the network operating coditions degrade using the area under each curve, and quantify R as the total area minus the area under the curve in question, normalized on a scale from zero to one. ´ We use the AT&T, GEANT2, and Sprint physical-layer networks as examples, as shown in Figures 16, 17, and 18. In the axis lables for each plot, p1 represents path reliability, p2 represents stretch, n1 represents largest component size, and n2 represents clustering coefficient. For each network we plot services using 1, 2, 3, and 10 paths, and note that in each case using a greater number of diverse paths results in a service that stays closer to the x-axis as network conditions degrade. We see the most dramatic improvement in the ´ case of the GEANT network, while in the cases of AT&T and Sprint rapidly increasing stretch limits the performance improvement available through path diversity. Table 2 quantifies the improvement in R aggregated across the full range of network conditions analyzed.
EPD threshold
Fig. 19 Total graph stretch vs. effective path diversity threshold λ = .5 1.0
diversity to stretch ratio
By using the ResiliNets resilience metrics framework [31, 23,41, 42, 24], we can show that path diversification does improve the resilience (R) of the network. The resilience framework allows us to take multiple properties of the network operational conditions (shown on the x-axis), and show the corresponding states of the service being provided at a particular layer boundary, both as objective functions of multiple parameters. In this case we are interested in the condition of the network topology, captured using the largest component size (LC size) and clustering coefficient. The service being provided is end-to-end connectivity, the state of which is captured using path reliability and average stretch, reflecting the service goal of connectivity with limited stretch.
Full mesh Level 3 ATT phys Grid Exodus Sprint phys EBONE AboveNet Sprint Verio Tiscali GEANT 2 Ring ATT VSNL Telstra Star
0.8
0.6
0.4
0.2
0.0 0.0 0.1 0.2 0.3 0.4 0.5 0.6 0.7 0.8 0.9 1.0
EPD threshold
Fig. 20 Gain vs. effective path diversity threshold where λ = .5
4.3 Path Stretch By definition, if we are using paths other than the shortestpath as determined by conventional routing mechanisms, those paths will be longer, and this is measured in terms of path stretch as defined previously. Depending on the particular topology in use, and the source-destination pair being measured, some paths will be several times as long as the original, while others will be only slightly longer, and a particular flow will be composed of paths with varying stretch. To evaluate the effect of path diversification at the graph level we define average path stretch (APS) to be the average stretch over all selected paths between a give sourcedestination pair. The total graph stretch TGS is then the average of the APS values for all node pairs in the graph. We can then plot TGS with respect to EPD to determine the cost of increased diversity in terms of path stretch. As seen in Figure 19, the response of TGS to increasing EPD threshold is significantly topology dependent. The TGS of the ring is unchanged by increasing EPD, due to the existence of only 1
12
Justin P. Rohrer et al.
diversity to stretch ratio
1.0
Full mesh Level 3 ATT phys Grid Exodus Sprint phys EBONE AboveNet Sprint Verio Tiscali GEANT 2 Ring ATT VSNL Telstra Star
0.8
0.6
0.4
0.2
0.0 0.0 0.1 0.2 0.3 0.4 0.5 0.6 0.7 0.8 0.9 1.0
EPD threshold
Fig. 21 Gain vs. effective path diversity threshold where λ = 1
diversity to stretch ratio
1.0
Full mesh Level 3 ATT phys Grid Exodus Sprint phys EBONE AboveNet Sprint Verio Tiscali GEANT 2 Ring ATT VSNL Telstra Star
0.8
0.6
0.4
0.2
0.0 1
2
3
4
5
6
7
8
9
10
number of paths
Fig. 22 Gain vs. number of paths requested
alternate path, which on average is significantly longer than the primary path. The TGS of several topologies increases at a relatively linear rate, indicative of the relatively high degree of connectivity in those networks. In contrast, the Sprint physical and full mesh have distinct thresholds near EPD values of 0.4 and 0.6, due their particular characteristics. In most of the networks we observe that the stretch remains less than double even for very high EPD thresholds. While we see that stretch is likely to increase when selecting diverse paths, we want to observe the relationship between diversity and stretch. To this end we calculate a gain, which is the ratio of TGD divided by TGS for a particular requested EPD threshold. This normalizes the diversity improvement seen to the increased cost in terms of stretch. Figures 20, 21, and 22 quantify small increases in path diversity result in a large improvement in overall graph diversity, while incurring minimal stretch, however this effect is limited by the underlying topologies such that when no new diverse paths are available the ratio becomes constant. Networks with little diversity, or a large amount of stretch
appear at the bottom of this plot, namely the synthetic star and ring, as well as the poorly connected Telstra and VSNL provider networks. Comparing Figure 20 and Figure 21 we observe the effect of modifying λ . When λ is increased, the improvement in diversity does not come until higher EPD thresholds (due to the increased impact of k on EPD), however the overall gain is higher. Figure 22 shows the same gain measure when plotted against k, and again emphasizes the role played by the underlying topology. In this case the Sprint topology is still showing improved gain well after the other two have flatlined. Here we note that a multipath-aware application would likely not use all reliable paths equally, so averaging the stretch of all paths overestimates the effective stretch in that case.
5 Topology Survivability Comparison In comparing the survivability of various topologies for this paper, we are concerned not with the performance of a particular protocol or mechanism in recovering from failures, rather we are considering the survivability inherent in the structure of the topology itself. To do that, we calculate the flow robustness as the probability of link and node failures is increased. In this case we are considering a flow to be in tact as long as a path exists that connects the source and destination, i.e. the source and destination nodes are not partitioned from one another. Questions of reconvergence time and path protection accuracy are all protocol specific and outside the scope of this paper. We compare 17 topologies, 4 of which are synthetic topologies included for completeness. Ten topologies are logical router-level topologies inferred by the Rocketfuel project [1]. The remaining three are physicallayer fiber topologies [13]. Figures 3 and 4 show the physical and logical-layer topologies respectively for the Sprint network, as an example of the substantial differences between these two categories of maps. The synthetic topologies can be easily recreated based on the data in the tables below, and the data (including adjacency matrices and node geolocations) for the real topologies is available via KU-TopView, our Web-based topology map viewer [2].
5.1 Simulation Results To perform the failure simulations we again use MATLAB since we are not looking at dynamic or transient behavior and therefore do not need to simulate packet flows but can perform the calculations using graph-theoretic methods. For each of the 17 topologies we use the following process: 1. load topology adjacency matrix 2. calculate 300 failure sets based on current probability
Path Diversification for Future Internet End-to-End Resilience and Survivability 1.2
1.0
Full mesh Grid Star Ring
0.8 0.6 0.4
0.6
0.4
0.2
0.2
0.05
0.10
0.15
0.0 0.00
0.20
failure probability
0.15
0.20
1.2
Full mesh Grid Star Ring
0.8 0.6 0.4
1.0
flow robustness
1.0
flow robustness
0.10
Fig. 25 Node & link failure robustness (synthetic)
1.2
Level 3 AboveNet Exodus EBONE Tiscali Sprint Verio VSNL ATT Telstra
0.8 0.6 0.4 0.2
0.2
0.05
0.10
0.15
0.20
failure probability
Fig. 24 Node failure robustness (synthetic)
3. 4. 5. 6.
0.05
failure probability
Fig. 23 Link failure robustness (synthetic)
0.0 0.00
Full mesh Grid Star Ring
0.8
flow robustness
flow robustness
1.0
0.0 0.00
13
(a) 100 sets with link-failures only (b) 100 sets with node-failures only (c) 100 sets with link & node failures calculate fraction of node-pairs connected in each set average across each 100 sets plot 3 data points increment failure-probability until all values range are complete
For this paper we use 51 failure probabilities evenly distributed over the range 0–0.5 inclusive, resulting in 15,300 simulation runs for each topology, or 260,100 runs total, which took several days to complete using a computing cluster consisting of approximately 1000 Intel Xeon CPU cores. The results of this process are summarized in Figures 23–31. These plots are a collection of the best-possible or reference curves that would appear on a plot comparing routing or path protection schemes. The curve for each plot is distinct due to its topology, and thus from these plots we can quickly see which topologies are more survivable than others. We have separated the plots into three categories: logical, physical,
0.0 0.00
0.05
0.10
0.15
0.20
failure probability
Fig. 26 Link failure robustness (logical)
and synthetic, for plotting purposes simply for readability because they became difficult to distinguish with too many curves in each plot. At this point we can also take note of specific topology’s performance, for example the full-mesh does best overall, while the ring is the worst of the synthetic topologies, and the Sprint and AT&T physical topologies do the worst overall. What we take away from these plots is that the relative ordering of the curves remains largely unchanged (the few exceptions are of minimal size) and so it is reasonable to expect that a measure of survivability may be computed based on the topology alone, without being dependent on the expected probability of failure of individual links and nodes.
5.2 Topology Characteristics Survey Table 1 in Section 4 lists all of the topologies analyzed, along with a set of standard graph-metrics. For each metric, the best (w.r.t. survivability) three values are highlighted in bold. A number of these features are linked to network
14
Justin P. Rohrer et al. Level 3 AboveNet Exodus EBONE Tiscali Sprint Verio VSNL ATT Telstra
flow robustness
0.8
0.6
0.4
1.2 1.0
flow robustness
1.0
0.2
0.0 0.00
0.8 0.6 0.4 0.2
0.05
0.10
0.15
0.0 0.00
0.20
failure probability
0.10
0.15
0.20
Fig. 29 Link failure robustness (physical) Level 3 AboveNet Exodus EBONE Tiscali Sprint Verio VSNL ATT Telstra
0.8
0.6
0.4
0.2
1.0
GEANT 2 ATT phys Sprint phys
0.8
flow robustness
1.0
flow robustness
0.05
failure probability
Fig. 27 Node failure robustness (logical)
0.0 0.00
GEANT 2 ATT phys Sprint phys
0.6
0.4
0.2
0.05
0.10
0.15
0.20
failure probability
0.0 0.00
0.05
0.10
0.15
0.20
failure probability
Fig. 28 Node & link failure robustness (logical)
Fig. 30 Node failure robustness (physical)
resilience in one way or another, for example topologies with a high average node-degree generally have more protection paths available, while topologies with a high maximum node or link betweenness may have a central point-offailure which could be targeted by an attacker. Diameter, radius, and hop-count are closely related distance metrics. In our eariler work on path diversification [37] (with a much smaller sample-set of topologies available to work with) it became apparent that the TGD metric was able to differentiate similar topologies according to their survivability performance, but looking at the plots and Table 1 it is clear that this no longer holds true when the network size varies widely. None of the listed graph theory metrics (or any we are aware of) correlate closely to network survivability as simulated in Section 5.1. We address this void in Section 6.
We also present a new metric (cTGD introduced in [39]) to quantify this relationship.
6 Analysis In this section we further explore the relationships between the metrics listed in Section 5.2 and topology survivability.
6.1 Topology Ranking Based on the flow robustness results (Section 5.1) we can rank the topologies based on their survivability in the presence of multiple failures as shown in Table 3. This ranking can easily be done qualitatively by visual inspection of the plots above, with higher curves outranking lower curves. To perform the ranking a bit more rigorously we chose a fixed point on the x-axis (0.2 in this case) and ranked each topology according to its value at that point on the link and node failure plot. Since the curves have minimal crossover, this produces the same ranking as the visual inspection approach. The metrics values from Table 1 are also shown here as rankings in order to emphasize the correlation (or lack thereof) between each particular metric and the survivability rank. Some metrics are not included in this table, for example the number of nodes and links that are a direct measure
Path Diversification for Future Internet End-to-End Resilience and Survivability
15
Table 3 Network rank Network
Survivability Rank
Node Deg. Rank
TGD Rank
Clustering Rank
Diam. Rank
Hopcount Rank
Closeness Rank
Node Bet. Rank
Link Bet. Rank
Full-Mesh Level 3 AboveNet Exodus EBONE Tiscali Sprint Verio Manhattan Grid VSNL ´ GEANT2 Phys. Star AT&T Telstra Ring AT&T Phys. Sprint Phys.
1 2 3 4 5 6 7 8 9 10 11 12 13 14 15 16 17
1 2 3 5 5 4 5 4 6 7 6 8 7 7 7 7 7
1 2 8 5 7 11 9 10 4 15 12 17 14 16 13 3 6
1 2 3 8 10 4 6 7 15 5 11 15 9 12 15 13 14
1 4 3 4 4 5 5 7 7 4 8 2 6 6 9 10 10
1 2 3 5 7 8 9 10 12 6 14 4 13 11 15 16 17
1 3 2 6 7 8 9 10 12 5 14 4 13 11 15 16 17
1 10 5 4 4 9 8 13 3 2 7 6 14 11 4 15 12
1 9 3 4 6 10 11 13 7 2 12 5 15 14 8 17 16
1.0
GEANT 2 ATT phys Sprint phys
flow robustness
0.8
0.6
0.4
0.2
0.0 0.00
0.05
0.10
0.15
0.20
failure probability
Fig. 31 Node & link failure robustness (physical)
of the graph size, and are not a unique property of the topology design, and the radius, which is so closely related to the diameter and the hop-count as to be redundant. In contrast, the average node degree relates the number of nodes to the number of links. From Table 3 we see that most of the metrics correctly rank the top 2 or 3 networks according to their survivability, but beyond that the rank no longer corresponds. Based on previous experience with the path diversity metrics, and the intuition that diversity should be closely correlated with survivability, we investigated further and developed the Compensated Total Graph Diversity metric.
6.2 Compensated Total Graph Diversity In Section 3.5 we noted that the diversity metric is independent of path length, meaning that there is no natural penalty assigned to longer paths as opposed to short ones. On the other hand, there is a significant statistical penalty to long
paths when simulating probabilistic failures. Intuitively this penalty results from greater exposure in real networks to component failure due to natural faults or intentional attack. Returning to Table 1 we see that specific topologies receive a much higher TGD-rank than survivability-rank (e.g. AT&T Physical, Sprint Physical) also have much higher diameters than other networks with similar TGDs. Conversely, the star topology, which is given the lowest TGD rank but performs better than 5 other networks, has a much smaller diameter than the networks it outperforms. Further investigation shows that the average hop-count is a more precise indicator of this penalty than the diameter or radius. Based on this we propose a new composite metric that takes into account both TGD and average hop-count. We call the new metric Compensated Total Graph Diversity (cTGD) and define it as follows: cTGD = eTGD−1 × h−α
(13)
where h is the average hop-count and α is a parameter tuned experimentally. We find that α = 1.25 gives the best correlation to our simulation results. The benefit of taking the exponential of the original TGD is that the range is still bounded between 0 and 1, but is no longer inclusive of 0, which allows for the cTGD of a topology with 0 diversity to be positive, as in the case of the Star network. From the hop-count component we desire an inverse relationship (higher hopcounts result in lower cTGDs), and we use the α parameter to tune the aggressiveness of this relationship. To put equation 13 in the context of providing an end-to-end service, it requires greater diversity to provide a given level of flow reliability over a long path than is required to achieve the same level of flow reliability over a short path. In the graph context, a large-diameter graph must provide a higher TGD to achieve the same level of flow-robustness as a smallerdiameter graph with a lower TGD.
16
Justin P. Rohrer et al.
Table 4 Compensated TGD Network
Survivability Rank
cTGD
cTGD Rank
Full-Mesh Level 3 AboveNet Exodus EBONE Tiscali Sprint Verio Manhattan Grid VSNL ´ GEANT2 Phys. Star AT&T Telstra Ring AT&T Phys. Sprint Phys.
1 2 3 4 5 6 7 8 9 10 11 12 13 14 15 16 17
0.9514 0.4494 0.4386 0.3617 0.3113 0.2641 0.2407 0.2009 0.2002 0.1783 0.1668 0.1628 0.1446 0.0941 0.0667 0.0348 0.0307
1 2 3 4 5 6 7 8 9 10 11 12 13 14 15 16 17
Table 4 again shows the topologies ranked according to their simulated survivability results, alongside their cTGD metric value and cTGD rank. We see that both measures provide an identical ranking for all the topologies suggesting that the cTGD metric is an excellent predictor of topology survivability. We note here that we are not claiming that this exact correlation would hold true for every possible set of topologies, only that we expect a close correlation. The reason for this is that the TGD is a heuristic measure, and the survivability rank is based on a Monte Carlo simulation set, both of with introduce a margin of error. We have sought to reduce this error as much as possible through our methodology. That being said, what we are seeing is a strong correlation so that any reordering should only occur when two topologies have very similar cTGD and survivability metric values to begin with.
7 Conclusions and Future Work This paper described path diversification, presenting its design and evaluation. We also discussed several metrics for evaluating path, node-pair, and graph diversity. We applied the path diversification mechanism to a number of real networks and evaluated its ability to improve flow robustness in the presence of link and node failures. Path diversification provides a substantial performance improvement over conventional single-path mechanisms by using cross-layer information to make intelligent path selections based on the diversity. We then extended the applicability of the total graph diversity metric by compensating for topologies that have higher average hopcounts, thus creating the cTGD metric. Our analysis of the properties of 17 real and synthetic topologies shows that cTGD is an excellent predictor of the survivability of these topologies when simultaneous distributed node and link failures occur.
We select a static set of paths in order to limit complexity and bound the problem, however this is not strictly necessary. As paths fail additional paths could be requested from path server (assuming resilient access to the path server). This sort of on-demand path selection could limit the initial computational complexity and is something that merits further investigation. Future work includes evaluating cTGD on a large set of generated topologies engineered with specific properties (node degree, rank, etc.) to characterize the effect of those characteristics on survivability, as well as expanding the scope of our survivability simulations to include various types of intelligently targeted challenges. Acknowledgements This is an extended version and substantial revision of papers that appeared in IEEE RNDM 2009 [38], IEEE DRCN 2009 [37], and IEEE/IFIP RNDM 2011 [39]. The authors would like to thank the members of the ResiliNets group for discussions which led to this work. This research was supported in part by NSF FIND (Future Internet Design) Program under grant CNS-0626918 (Postmodern Internet Architecture), by NSF grant CNS-1050226 (Multilayer Network Resilience Analysis and Experimentation on GENI), and by the EU FP7 FIRE programme ResumeNet project (grant agreement no. 224619).
References 1. Rocketfuel: An ISP topology mapping engine (2008) 2. Resilinets topology map viewer. http://www.ittc.ku.edu/ resilinets/maps/ (2011) 3. Wikipedia: Clustering coefficient. http://en.wikipedia. org/wiki/Clustering_coefficient (2011) 4. Bassiri, B., Heydari, S.S.: Network survivability in large-scale regional failure scenarios. In: Proceedings of the 2nd Canadian Conference on Computer Science and Software Engineering (C3S2E), pp. 83–87. ACM, New York, NY, USA (2009). DOI http://doi.acm.org/10.1145/1557626.1557639 5. Begen, A., Altunbasak, Y., Ergun, O.: Multi-path selection for multiple description encoded video streaming. In: Proceedings of the IEEE International Conference on Communications (ICC ’03), vol. 3, pp. 1583–1589 (2003) 6. Bhandari, R.: Survivable Networks: Algorithms for Diverse Routing. Kluwer Academic Publishers, Norwell, MA, USA (1998) 7. Bhattacharjee, B., Calvert, K., Griffioen, J., Spring, N., Sterbenz, J.P.G.: Postmodern internetwork architecture. Technical Report ITTC-FY2006-TR-45030-01, Information and Telecommunication Center, 2335 Irving Hill Road, Lawrence, KS 66045-7612 (2006) 8. Carter, M.R., Howard, M.P., Owens, N., Register, D., Kennedy, J., Pecheux, K., Newton, A.: Effects of catastrophic events on transportation system management and operations, Howard Street tunnel fire, Baltimore City, Maryland – July 18, 2001. Tech. rep., U.S. Department of Transportation, ITS Joint Program Office, Washington DC (2002) 9. C ¸ etinkaya, E.K., Broyles, D., Dandekar, A., Srinivasan, S., Sterbenz, J.P.: Modelling communication network challenges for future internet resilience, survivability, and disruption tolerance: A simulation-based approach. Springer Telecommunication Systems (2011). (online Dec. 2011) 10. C ¸ etinkaya, E.K., Broyles, D., Dandekar, A., Srinivasan, S., Sterbenz, J.P.G.: A comprehensive framework to simulate network attacks and challenges. In: Proceedings of the 2nd IEEE/IFIP Inter-
Path Diversification for Future Internet End-to-End Resilience and Survivability
11. 12.
13. 14. 15.
16.
17. 18. 19. 20.
21.
22.
23.
24.
25. 26.
27. 28.
29.
30.
31.
32.
national Workshop on Reliable Networks Design and Modeling (RNDM), pp. 538–544. Moscow, Russia (2010) Cetinkaya, C., Knightly, E.: Opportunistic traffic scheduling over multiple network paths. INFOCOM 3, 1928–1937 (2004) Clark, D.D.: The design philosophy of the DARPA Internet protocols. In: Proceedings of the ACM SIGCOMM Symposium on Communications Architectures and Protocols, pp. 106–114. ACM, New York, NY, USA (1988) KMI Corporation: North american fiberoptic long-haul routes planned and in place (1999) Dijkstra, E.W.: A note on two problems in connection with graphs. Numerische Mathematik 1, 269–271 (1959) Ellison, R., Fisher, D., Linger, R., Lipson, H., Longstaff, T., Mead, N.: Survivable network systems: An emerging discipline. Tech. Rep. CMU/SEI-97-TR-013, Software Engineering Institute, Carnegie Mellon University (1997) ENISA Virtual Working Group on Network Providers Resilience Measures: Network resilience and security: Challenges and measures. Tech. Rep. WP 2009 – WPK 1.2 VWG 1, ENISA – European Network and Information Security Agency (2009) Floyd, R.W.: Algorithm 97: Shortest path. ACM Communications 5(6), 345 (1962). DOI http://doi.acm.org/10.1145/367766.368168 Ford, L.: Network flow theory (1956) Freeman, L.C.: A set of measures of centrality based upon betweenness. Sociometry 40(1), 35–41 (1977) Gomes, T., Simoes, C., Fernandes, L.: Resilient routing in optical networks using SRLG-disjoint path pairs of min-sum cost. Telecommunication Systems (2011) Grover, W.D.: Mesh-based Survivable Transport Networks: Options and Strategies for Optical, MPLS, SONET and ATM Networking. Prentice Hall PTR, Upper Saddle River, NJ, USA (2003) Grover, W.D., Stamatelakis, D.: Cycle-oriented distributed preconfiguration: Ring-like speed with mesh-like capacity for selfplanning network restoration. In: Proceeding of the IEEE International Conference on Communications (ICC’98), vol. 1, pp. 537– 543 (1998) Jabbar, A.: A framework to quantify network resilience and survivability. Ph.D. thesis, The University of Kansas, Lawrence, KS (2010) Jabbar, A., Narra, H., Sterbenz, J.P.G.: An approach to quantifying resilience in mobile ad hoc networks. In: Proceedings of the 8th IEEE International Workshop on the Design of Reliable Communication Networks (DRCN), pp. 140–147. Krakow, Poland (2011) Jen, E.: Robust Design: A Repertoire of Biological, Ecological, and Engineering Case Studies. Oxford University Press (2005) Kvalbein, A., Hansen, A.F., Cicic, T., Gjessing, S., Lysne, O.: Multiple routing configurations for fast IP network recovery. IEEE Transactions on Networking 17(2), 473–486 (2008) Lewis, T.G.: Network Science, 1st edn., chap. 2, p. 24. John Wiley & Sons, Inc. (2009) MacGregor, M., Grover, W.: Optimized k-shortest-paths algorithm for facility restoration. Software: Practice and Experience 24(9) (1994) Mahadevan, P., Krioukov, D., Fomenkov, M., Dimitropoulos, X., Claffy, K., Vahdat, A.: The Internet AS-level topology: Three data sources and one definitive metric. ACM Computer Communication Review 36(1), 17–26 (2006). DOI 10.1145/1111322.1111328 Mahmood, R.A.: Simulating challenges to communication networks for evaluation of resilience. Master’s thesis, The University of Kansas, Lawrence, KS (2009) Mohammad, A.J., Hutchison, D., Sterbenz, J.P.G.: Towards quantifying metrics for resilient and survivable networks. In: Proceedings of the 14th IEEE International Conference on Network Protocols (ICNP), pp. 17–18 (2006) Moore, E.F.: The Shortest Path Through a Maze. Bell Telephone System (1959)
17
33. Motiwala, M., Elmore, M., Feamster, N., Vempala, S.: Path splicing. In: Proceedings of the ACM SIGCOMM conference on data communication, pp. 27–38. ACM, New York, NY, USA (2008) 34. Newman, M.E.J.: Networks: An Introduction, 1st edn., chap. 7, p. 199. Oxford University Press (2010) 35. Newman, M.E.J.: Networks: An Introduction, 1st edn., chap. 7, p. 181. Oxford University Press (2010) 36. Rajagopalan, B., Saha, D.: Link bundling in optical networks. Internet draft, work in progress draft-rs-optical-bundling-00.txt, IETF (2000) 37. Rohrer, J.P., Jabbar, A., Sterbenz, J.P.G.: Path diversification: A multipath resilience mechanism. In: Proceedings of the IEEE 7th International Workshop on the Design of Reliable Communication Networks (DRCN), pp. 343–351. Washington, DC, USA (2009). 38. Rohrer, J.P., Naidu, R., Sterbenz, J.P.G.: Multipath at the transport layer: An end-to-end resilience mechanism. In: Proceedings of the IEEE/IFIP International Workshop on Reliable Networks Design and Modeling (RNDM), pp. 1–7. St. Petersburg, Russia (2009). 39. Rohrer, J.P., Sterbenz, J.P.G.: Predicting topology survivability using path diversity. In: Proceedings of the IEEE/IFIP International Workshop on Reliable Networks Design and Modeling (RNDM), pp. 95–101. Budapest, Hungary (2011). 40. Shillingford, N., Salyers, D., Poellabauer, C., Striegel, A.: DETOUR: Delay- and energy-aware multi-path routing in wireless ad hoc networks. In: Proceedings of the Fourth Annual International Conference on Mobile and Ubiquitous Systems: Networking & Services (MobiQuitous), pp. 1–8 (2007) 41. Sterbenz, J.P., C ¸ etinkaya, E.K., Hameed, M.A., Jabbar, A., Rohrer, J.P.: Modelling and analysis of network resilience (invited paper). In: Proceedings of the Third IEEE International Conference on Communication Systems and Networks (COMSNETS), pp. 1–10. Bangalore, India (2011). 42. Sterbenz, J.P., C ¸ etinkaya, E.K., Hameed, M.A., Jabbar, A., Shi, Q., Rohrer, J.P.: Evaluation of network resilience, survivability, and disruption tolerance: Analysis, topology generation, simulation, and experimentation (invited paper). Springer Telecommunication Systems (2011). (online Dec. 2011) 43. Sterbenz, J.P.G., Hutchison, D.: Resilinets: Multilevel resilient and survivable networking initiative wiki. http://wiki.ittc.ku. edu/resilinets (2006) 44. Sterbenz, J.P.G., Hutchison, D., C ¸ etinkaya, E.K., Jabbar, A., Rohrer, J.P., Sch¨oller, M., Smith, P.: Resilience and survivability in communication networks: Strategies, principles, and survey of disciplines. Computer Networks: Special Issue on Resilient and Survivable Networks (COMNET) 54(8), 1245–1265 (2010). 45. Sterbenz, J.P.G., Krishnan, R., Hain, R.R., Jackson, A.W., Levin, D., Ramanathan, R., Zao, J.: Survivable mobile wireless networks: issues, challenges, and research directions. In: WiSE ’02: Proceedings of the 3rd ACM workshop on Wireless security, pp. 31–40. ACM Press, New York, NY, USA (2002) 46. Styron, H.C.: CSX tunnel fire: Baltimore, MD. US Fire Administration Technical Report USFA-TR-140, Federal Emergency Management Administration, Emmitsburg, MD (2001) 47. Suurballe, J.W.: Disjoint paths in a network. Networks 4(2) (1974) 48. Suurballe, J.W., Tarjan, R.E.: A quick method for finding shortest pairs of disjoint paths. Networks 14(2) (1984) 49. Sydney, A., Scoglio, C., Youssef, M., Schumm, P.: Characterising the robustness of complex networks. International Journal of Internet Technology and Secured Transactions 2(3/4), 291–320 (2010) 50. T1A1.2 Working Group: ATIS telecom glossary 2000. American National Standard for Telecommunications T1.523-2001, Alliance for Telecommunications Industry Solutions (ATIS) (2001) 51. Teixeira, R., Marzullo, K., Savage, S., Voelker, G.M.: In search of path diversity in ISP networks. In: Proceedings of the 3rd ACM SIGCOMM conference on Internet measurement (IMC ’03), pp. 313–318. ACM, New York, NY, USA (2003)
18 52. Wang, Y., Panwar, S., Lin, S., Mao, S.: Wireless video transport using path diversity: Multiple description vs layered coding. In: Proceedings of the International Conference on Image Processing, vol. 1, pp. I–21–I–24 (2002) 53. Warshall, S.: A theorem on boolean matrices. Journall of the ACM (JACM) 9(1), 11–12 (1962) 54. West, D.B.: Introduction to Graph Theory, 1st edn., chap. 1, pp. 25–26. Prentice-Hall, Inc., Upper Saddle River, NY (1996) 55. Yang, X., Wetherall, D.: Source selectable path diversity via routing deflections. SIGCOMM Comput. Commun. Rev. 36(4), 159– 170 (2006)
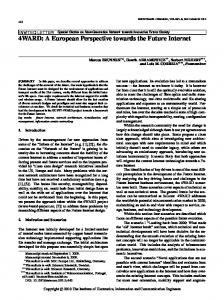
Bios Dr. Justin P. Rohrer: is currently a Research Associate of Computer Science at the Naval Postgraduate School (NPS) and an Adjunct Assistant Professor of Electrical Engineering and Computer Science at the KU Information & Telecommunication Technology Center (ITTC). He received his Ph.D in Electrical Engineering from the University of Kansas in 2011 with honors. He received his B.S. degree in Electrical Engineering from Rensselaer Polytechnic Institute, Troy, NY, in 2004. From 1999 to 2004, he was with the Adirondack Area Network, Castleton, NY as a network engineer. He was also an ITTC Graduate Fellow from 2004–2006. He received the best paper award at the International Telemetering Conference in 2008 and the best graduate student paper award at the same conference in 2011. His research focus is on resilient and survivable transport and routing protocols. Interests also include highly-dynamic mobile networks, and simulating network disruptions. Previous research has included weather disruption-tolerant mesh networks and freespace optical metropolitan networks. He is a member of the IEEE Communications and Computer Societies, ACM SIGCOMM, Eta Kappa Nu, and was an officer of the Kansas City section of the IEEE Computer Society. Dr. Abdul Jabbar: is currently a Research Engineer in the Advanced Communication Systems Lab at GE Global Research in Nikayuna, NY. He also holds the position of Adjunct Research Associate with the University of Kansas. He received his Ph.D in Electrical Engineering from The University of Kansas in 2010 with honors. He received his M.S. degree in Electrical Engineering from KU in 2004 and B.S. degree in Electrical Engineering from Osmania University, India in 2001. His interests include resilience and survivability, network algorithms, design and analysis of network architectures, topologies, and protocols, highly dynamic networks, wireless access, and future networks. Abdul is the recipient of Moore award for best M.S. thesis and is a member of IEEE Communications Society, IEEE Computer Society, and the ACM Special Interest Group on Data Communications. Dr. James P.G. Sterbenz: is an Associate Professor of Electrical Engineering & Computer Science and on staff at the Information & Telecommunication Technology Center at The
Justin P. Rohrer et al.
University of Kansas, and is a Visiting Professor of Computing in InfoLab 21 at Lancaster University in the UK. He received a doctorate in computer science from Washington University in St. Louis in 1991, with undergraduate degrees in electrical engineering, computer science, and economics. He is director of the ResiliNets research group at KU, PI for the NSF-funded FIND Postmodern Internet Architecture project, PI for the NSF Multilayer Network Resilience Analysis and Experimentation on GENI project, lead PI for the GpENI (Great Plains Environment for Network Innovation) international GENI and FIRE testbed, co-I in the EU-funded FIRE ResumeNet project, and PI for the US DoD-funded highly-mobile airborne networking project. He has previously held senior staff and research management positions at BBN Technologies, GTE Laboratories, and IBM Research, where he has lead DARPA- and internally-funded research in mobile, wireless, active, and high-speed networks. He has been program chair for IEEE GI, GBN, and HotI; IFIP IWSOS, PfHSN, and IWAN; and is on the editorial board of IEEE Network. He has been active in Science and Engineering Fair organisation and judging in Massachusetts and Kansas for middle and high-school students. He is principal author of the book High-Speed Networking: A Systematic Approach to High-Bandwidth Low-Latency Communication. He is a member of the IEEE, ACM, IET/IEE, and IEICE. His research interests include resilient, survivable, and disruption tolerant networking, future Internet architectures, active and programmable networks, and high-speed networking and systems.