Research Richard Baker, Andrew Smith, Carolyn Tarrant, Robert K McKinley and Nicholas Taub
Patient feedback in revalidation: an exploratory study using the consultation satisfaction questionnaire
Abstract Background Revalidation is the UK process for the review of doctors to ensure they are fit to practise. Revalidation will include patient feedback.
Aim To investigate the role of patient feedback on GPs’ consultations in revalidation.
Design and setting Cross-sectional survey of patients consulting 171 GPs.
Method A total of 6433 patients aged 16 years or over completed the consultation satisfaction questionnaire (CSQ). Generalisability analysis was undertaken, scale scores calculated, and outliers identified using two and three standard deviations from the mean as control limits. Comments made by patients were categorised into positive, neutral, or negative.
Results After averaging each scale for each doctor, mean scores (standard deviation), out of a possible score of 100, were: general satisfaction 78.1 (7.2); professional care 82.1 (6.1); relationship 71.2 (7.1); perceived time 65.7 (7.6). A D-study (which enables estimation of the reliability from 0–1 of the CSQ scores for different numbers of responders for each doctor), indicated that ratings by 19 patients would achieve a generalisability coefficient of 0.80 for the combined score. Fifteen GPs had one or more scale scores below two standard deviations of the mean. Comments were more often negative for GPs with scores below two standard deviations of the mean.
Conclusion Most patients of most GPs are satisfied with their experience of consultations, and ways to make patient feedback formative for these doctors is required. For a few GPs, most patients report some dissatisfaction. Patient feedback may identify doctors who need educational support and possibly remediation, but agreed questionnaire score thresholds are required, and agreement is needed on the weight to be attached to patient experience in comparison with other aspects of performance.
Keywords certification; general practice; patient satisfaction.
e638 British Journal of General Practice, October 2011
INTRODUCTION Revalidation is the process by which doctors in the UK will demonstrate to the regulatory authority, the General Medical Council (GMC), that they remain up to date and fit to practise.1 Revalidation will not begin before completion of extensive pilot tests. It is intended that it should rely in large part on systematic annual appraisal of doctors, including review of information about the doctor’s performance in relation to standards set out by the GMC, which will be assessed by methods that include feedback from colleagues and patients.2 The Royal College of General Practitioners (RCGP) has responsibility for proposing the standards and methods of revalidation for GPs, subject to approval by the GMC.3 The RCGP currently advises that once revalidation is introduced, the portfolio of evidence submitted by GPs when seeking revalidation should include the results of a patient survey.4 The use of surveys is expected to identify a small number of doctors with low ratings on patient experience of, or satisfaction with, care, and a process of investigation and, if necessary, remediation is planned for these doctors.5 Outstanding issues to consider include whether poor patient experience scores alone should be considered sufficient evidence to trigger such investigation, or whether evidence of poor performance across a range of measures should be required; the threshold scores to be adopted in deciding on the need for investigation, R Baker, MD, FRCGP, professor; C Tarrant, BSc, PhD, lecturer in health psychology; N Taub, PhD research fellow in Medical Statistics, Department of Health Sciences, University of Leicester, Leicester. A Smith, MSc, survey director, PatientDynamics, High Wycombe; R McKinley, MD, FRCP, FRCGP, professor of academic general practice, Keele University School of Medicine, Keele. Address for correspondence Richard Baker, Department of Health Sciences,
educational support, or even remediation; and the numbers of doctors likely to be found in need of investigation. Therefore, a study of the potential role of surveys of patient experience in revalidation was undertaken to stimulate debate on the use of patient experience in revalidation. METHOD This study used data already collected by GPs for use in appraisal, using the consultation satisfaction questionnaire (CSQ). The GMC has published criteria for the approval of questionnaires,4 and has devised and piloted colleague and patient questionnaires.6 The RCGP has published a report comparing instruments that might be used.7 The CSQ is an 18-item instrument designed to provide information on patient satisfaction with consultations with GPs, and is being assessed for use in revalidation, although it is not yet approved.8 It has been extensively evaluated, being shown to possess good reliability and validity,8,9 and has been used in independent research studies.10,11 The CSQ includes questions about the consultation grouped into four scales: three questions dealing with general satisfaction with the consultation, seven with experience of professional aspects of care (the examination, information about treatment, being treated as a person), five with the relationship (being able to disclose personal information, the doctor understood the patient), and three with the length of the University of Leicester, 22–28 Princess Road West, Leicester, LE1 6TP. E-mail:
[email protected] Submitted: 7 February 2011; Editor’s response: 21 March 2011; final acceptance: 10 May 2011. ©British Journal of General Practice This is the full-length article (published online 26 Sep 2011) of an abridged version published in print. Cite this article as: Br J Gen Pract 2011; DOI: 10.3399/bjgp11X601343.
How this fits in Revalidation for GPs in the UK will include feedback from patients, but there is a lack of information on how feedback should be used to identify GPs whose performance would benefit from investigation, support, or even remediation. Using the findings from patient surveys for 171 GPs, this study identified a small number of GPs with low scores on patient feedback. Systems are needed to ensure that all GPs are able to reflect on their feedback, and to differentiate between those GPs who might need formal remediation and those who might benefit from consultation skills training in the context of continuing education and appraisal.
consultation (sufficient time to deal with everything the patient wanted). The response to each question is in a five-point ‘strongly agree’ to ‘strongly disagree’ format. Following recoding of negatively worded questions, a score out of a possible total of 100 is calculated for each scale, with a higher score indicating more positive ratings. A score below 50 would indicate that the majority of the responding patients of the doctor concerned are expressing a degree of dissatisfaction. The questionnaire also includes an open question, worded ‘Do you have any other comments about the consultation?’ Since 2009, surveys using CSQ have been offered to GPs by PatientDynamics™, for use in appraisal.12 The survey includes, for each participating GP, 50 copies of the questionnaire, instructions on administration of the survey, and independent analysis with feedback. The present study used the data from surveys completed by March 2010. The data were anonymised and therefore there is no descriptive information about the participating GPs or their practices, although patients were asked to record their age and sex on the questionnaire. GPs were instructed to invite adults aged 16 years or over who consecutively consulted them to complete a survey questionnaire. Patients were asked to complete the questionnaire following the consultation, with reference to the doctor they had just consulted. Since the study involved analysis of anonymous data collected as part of service evaluation, the local NHS ethics committee judged that NHS research ethics approval was not required. The researchers therefore sought and obtained ethics approval from the University of Leicester ethics committee.
Descriptive statistical analyses were undertaken in SPSS (version 16). In preliminary analyses, the level of nonresponse and distribution of responses to individual questions was investigated, and the internal consistency of the scales was checked. A generalisability (G)-analysis and D-studies (The D analysis enables estimation of the reliability of CSQ doctors’ scores with different numbers of questionnaires responses for each doctor. G studies allow estimation of the reliability of judgements of a quality [in this case, satisfaction] made by multiple assessors [in this case, patients], of multiple subjects [in this case, doctors], across a number of encounters [in this case, consultations]).13 were undertaken using G-String.14 After checking the distribution of scores of the included doctors, upper and lower control limits of two and three standard deviations from the mean were set to highlight potential outliers.15,16 The open comments were classified by one researcher according to whether they expressed positive, neutral, or negative views about the consultation, and these comments were related to the scores of doctors within or outside the control limits. Comments made about the practice rather than the consultation were excluded, although all comments made about the GP were included. To illustrate comments made about doctors with different scores, comments were randomly selected for inclusion in a table, by allocating a number to each comment and generating random numbers, stratified by whether or not scale scores were below two or three standard deviations of the mean. RESULTS A total of 6433 questionnaires were completed, relating to a total of 171 UK GPs. There was a mean of 37.6 questionnaires per GP (range 19–50, a mean response rate of 75.2%). Of those patients who gave their sex, 2151 (35.0%) were men, and 3991 (65.0%) were women. The mean age of males was 52.9 years (standard deviation [SD] 18.7 years), females 48.7 years (SD 18.9 years). The mean rate of non-response to individual questions was 4.4%, range 1.0–7.4%. Scale scores were not calculated for responders who had not answered one or more questions in a scale. The mean scores attained on the four scales of the CSQ are given in Table 1. The means differed across the scales, with the perceived time scale attracting the lowest mean score, and the professional care scale the highest. For each scale, the range between the highest
British Journal of General Practice, October 2011 e639
Table 1. Scores for CSQ scales, showing mean, standard deviation, and minimum and maximum scores (n = 171 GPs)
Mean Standard deviation Minimum Maximum
General satisfaction 78.1 7.2 52.5 90.7
Professional care 82.1 6.1 58.5 95.4
Depth of relationship 71.2 7.1 48.3 88.3
Perceived time 65.7 7.6 40.2 82.5
Combined 75.8 6.2 53.8 88.8
70
Number of GPs
60 50 40 30 20 10
95 –1 00
90 –9 4
85 –8 9
80 –8 4
75 –7 9
70 –7 4
65 –6 9
60 –6 4
55 –5 9
50 –5 4
45 –4 9
44 –4 4
0
Score General satisfaction
Relation
Professional care
Time
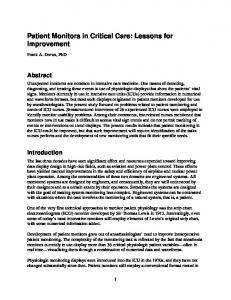
Figure 1. Distribution of CSQ scale scores for 171 GPs.
and lowest scores was around 40 scale points. The distributions of scores for all scales were close to normal, with a small tail evident for general satisfaction and professional care (Figure 1). Alpha coefficients for each scale were: general satisfaction 0.64, depth of relationship 0.76, perceived time 0.82, and professional care
0.89, very similar to the findings for the questionnaire when first reported.8 The Danalysis showed that, for the questionnaire’s combined score (the average of the four scales, weighted by the number of the original 18 questions that they each use), reliability of 0.8 was achieved with 19 patients (Table 2). The G-coefficient was 0.84 for a harmonic mean of 24.7 ratings per doctor. Table 3 gives the cut-off scores for upper and lower limits, using two and three standard deviations from the mean, and shows the numbers of GPs whose scores fell above the upper limits, and below the lower limits. For each scale, between six and eight doctors (3.5–4.7%) scored below the two standard deviation limit, and between one and four (0.6–2.3%) scored below the three standard deviation limit. Eleven (6.4%) scored between two and three standard deviations below the mean on at least one of the four scales. Of these 11, four (2.3%) scored below the two standard deviation limit on two of the scales, two (1.2%) scored below the limit on three of the scales, and one (0.6%) scored below the limit on all four scales. A total of four doctors scored below the three standard deviation limit for one or more scales, of whom one doctor scored below the limit for all four scales, and another scored below the limit for two scales. Fewer doctors scored above the upper control limits, with no doctor scoring above two standard deviations above the mean for general satisfaction, and no doctor scoring above three standard deviations for any of the scales. A total of 1117 comments were made by patients in response to the open question (17.4% of responding patients). Of these
Table 2. Generalisability (G)-study and D-study findings, showing the effect of varying numbers of responses on the reliability of scores for subscales and the combined questionnaire Generalisability coefficient Mean number of patients per General Professional Depth of Perceived doctor satisfaction care relationship time Combineda G-analysis 24.7 0.800 0.812 0.812 0.722 0.841 D-analysis 13 0.678 0.695 0.695 0.578 0.736 15 0.708 0.724 0.724 0.612 0.763 17 0.734 0.748 0.749 0.641 0.785 19 0.755 0.769 0.769 0.666 0.803 21 0.773 0.786 0.786 0.688 0.818 23 0.788 0.801 0.801 0.707 0.831 25 0.802 0.814 0.814 0.724 0.843 30 0.829 0.840 0.840 0.759 0.865 a The combined score was calculated as the mean of the four CSQ scales, weighted by the number of the original 18 questions that they each use.
e640 British Journal of General Practice, October 2011
Table 1. Numbers of doctors out of 171 above or below two standard deviations (95%) and three standard deviations (99%), for scores of CSQ scales Professional Depth of Perceived General care relationship time satisfaction Control Control Control Control Number limit Number limit Number limit Number limit of GPs score of GPs score of GPs score of GPs score Above mean +3 SDs +2 SDs Below mean –2 SDs –3 SDs
99.7 92.5
0 0
100 94.3
0 1
92.5 85.4
0 3
88.5 80.9
0 3
63.7 56.5
7 2
69.9 63.8
6 2
57.0 49.9
6 1
50.5 42.9
8 4
Table 4. Illustrative comments made by patients about consultations with doctors with no, or one or more, scale scores more than two or three standard deviations from the mean; comments selected randomly Above 2 standard deviations in all scales (n = 156) ‘One of the best doctors I have ever had.’ ‘So nice to be called in 10 minutes early.’ ‘Made us very relaxed regarding very stressful and personal issues. Thank you.’ ‘Never had any trouble with my visits.’ ‘Lovely doctor.’
Below 2 standard deviations in at least one scale (n = 11) ‘I am very happy with the service I get.’ ‘Very good.’
Below 3 standard deviations in at least one scale (n = 4) ‘The doctor was ignorant and rude.’
‘This doctor did not have time.’
‘Takes too long to sort my illness, ‘Disgusted with the way I was has been over a year, not ’ treated.’ good enough.’ ‘I was pleased with the consultation.’ ‘A doctor that is well liked and trusted by my family.’ ‘Very good at her job. Excellent‘ Yes after visiting the doctor I service.’ booked another appointment to see a doctor that actually might find out what is wrong with me.’
comments, 110 mentioned an aspect of the practice rather than the consultation and were excluded. Of the remaining 1007, most comments (975, 96.8%) were classified as positive or neutral. The 156 doctors with no scores below the two standard deviation limit received 948 comments, of which only 18 (1.9%) were negative; the 11 GPs with scores between two and three standard deviations of the mean received 34 comments, of which seven (20.6%) were negative; and the four doctors with scores below three standard deviations of the mean received 25 comments, of which seven (28.0%) were negative (difference between proportions P