WORKING PAPER 35| July 2013
Patterns of Adoption of Improved Rice Technologies in Ghana
Catherine Ragasa, Awere Dankyi, Patricia Acheampong, Alexander Nimo Wiredu, Antony Chapoto, Marian Asamoah and Robert Tripp
EXECUTIVE SUMMARY The average rice yield in Ghana is estimated to be 2.5 tons/hectare (MOFA 2009–2011), while the achievable yield based on on-farm trials is 6–8 tons/hectare. Low adoption of inputs and improved technologies is often cited as the major reason for this gap. With the aim of increasing productivity, the National Rice Development Strategy was approved in 2009, the national fertilizer subsidy program was introduced in 2008 (with rice as one of the focus crops), and a seed subsidy was announced in 2012 (with rice as one of the focus crops). Import levies and other taxes add up to almost 40 percent of the value of rice imports, suggesting heavy protection of local rice production. However, productivity remains low and the country is still dependent on imports, which account for 50–70 percent of domestic consumption. To determine current technology adoption levels and better understand the constraints to and incentives for adoption, a nationally representative survey of 576 rice farmers in 23 districts in 10 regions in Ghana was implemented from November 2012 to February 2013. This study aims to provide up-to-date analysis using rarely collected nationwide data on the patterns of adoption of improved technologies for rice in Ghana. The most recent previous nationwide adoption study on rice was carried out in 1998 and mainly based on expert opinion (see Dalton and Guei 2003). The study highlights a number of important findings, including the following: First, adoption of modern varieties, at 58 percent of rice area, is lower than the average for Africa south of the Sahara. Traditional varieties are still popular, especially in northern Ghana. Aromatic varieties have become popular; however, other traits such as drought tolerance, weed tolerance, good milling and parboiling qualities, and high yields are also preferred traits that are present in other popular traditional and modern varieties. There is scope to strengthen biotechnology capacity at the Council for Scientific and Industrial Research (CSIR) to combine these traits and develop superior varieties that satisfy consumer acceptability characteristics as well as agronomic traits desired by farmers. Second, fertilizer use in rice plots is quite high (66 percent of rice area) and the national fertilizer subsidy program has likely boosted the use of fertilizer for rice. However, the average application rate is still lower than the recommended rate, while some farmers in the Kpong irrigation side and Coastal Savannah zones have been overapplying (more than 100 kilogram/hectare of nitrogen). Most farmers did not follow the recommended timing of application, although the study did not find any difference in yield between plots following and not following the recommended timing of fertilizer application. Third, in addition to fertilizer, no-burn practices and plowing-in crop residue are popular among rice farmers. However, the adoption of other soil fertility management practices such as manure use, planting in mulch, and crop rotation with nitrogenfixing crops is limited. The fallow system is also becoming less common, even in Forest zone, with 79 percent of rice area continuously cropped for the last 11 years or more. Fourth, herbicide is cheap in Ghana (8 cedi/liter) and because of this, herbicide use has become very popular, with 84 percent of rice area treated with herbicide. Pesticide use is also common (52 percent of rice area with reported pest problems). Fifth, the sawah system (bunding, leveling, and puddling) is practiced on only 15 percent of rice area in Ghana (on 68 percent of irrigated sites and 3 percent of lowland areas). The constraint reported by farmers is lack of access to mechanization. Other agronomic practices are also less popular. Only 20 percent practice transplanting; only 13 percent of rice area is planted in rows, despite major promotion of row planting for rice; and seed priming is practiced by only 25 percent of farmers. Sixth, mean yield comparisons suggest that fertilizer, certified seed, and herbicide use are associated with higher yields. Modern varieties and certified seed did not seem to be associated with higher yields in the Northern Savannah area. Plots under irrigation and those under sawah have substantially higher yields than those not under those systems. Planting in mulch, no-burn practices, and the fallow system seem to be associated with higher yields in addition to fertilizer, certified seed, and herbicide, especially in irrigated areas. Row planting and seed priming are also associated with higher yields in all rice ecologies. There is no evidence of higher yields in plots following recommended fertilizer application timing, recommended spacing, method of planting (transplanting, broadcasting, or dibbling), plowing in crop residue, and manure use than those not following these recommendations. Rigorous modeling will be needed to determine the contribution of different inputs and practices to productivity to complement the mean yield comparison conducted in this study.
ii
Contents Executive Summary............................................................................................................................................................... ii Acknowledgment ................................................................................................................................................................... v 1. Introduction ........................................................................................................................................................................ 6 2. Rice Sector ........................................................................................................................................................................ 6 3. Data Source and Methods ............................................................................................................................................... 12 4. Improved Varieties and Certified Seed ........................................................................................................................... 13 5. Fertilizer Use ................................................................................................................................................................... 16 6. Herbicide Use .................................................................................................................................................................. 20 7. Management Practices .................................................................................................................................................... 22 8. Conclusions and Further Research ................................................................................................................................. 25 Annex 1 – List of projects and programs to support rice sector in Ghana .......................................................................... 28 Annex 2 – Certified rice seed production, 2001–2011, in tons ............................................................................................ 30 Annex 3 – Rice-producing districts included in survey sample ........................................................................................... 31 Annex 4 – Progress in development of irrigation schemes for rice ..................................................................................... 32 Annex 5 – Rice production and area comparison of two survey datasets .......................................................................... 32 Annex 6 – Area-weighted average age of improved rice varieties in selected countries ....................................................33 Annex 7 – Distribution of rice varieties planted in major season 2012, by farmers and area, in percent ...........................33 References .......................................................................................................................................................................... 35
Tables 2.1—Rice varieties released and promoted by CSIR ............................................................................................................ 9 2.2—CSIR/MOFA recommended rate and timing of fertilizer application for rice, per hectare ..........................................11 3.1—Characteristics of sample rice farmers ....................................................................................................................... 13 5.1—Distribution of rice farmers by fertilizer use and their application intensity, percent ...................................................16 5.2—Distribution of farmers and timing of first fertilizer application, major season 2012 ...................................................18 5.3—Distribution of rice area by land preparation and planting methods during major season 2012, percentage ............19 6.1—Adoption and application rate of herbicide during major season 2012....................................................................... 20 6.2—Cost difference between herbicide use and manual weeding .................................................................................... 21 7.1—Distribution of rice area by management practices during major season 2012 .........................................................23
iii
Figures 2.1—Production, acreage, and yield of paddy rice in Ghana, 1993–2011............................................................................ 7 4.1—Adoption rate of major inputs and agronomic practices of rice farmers during major season 2012, as percentage of rice area .............................................................................................................................................. 14 4.2—Average yield of plots planted with modern, traditional, certified, not certified, fresh, or recycled seed, by cropping system, in tons/hectare/season ................................................................................................................... 15 5.1—Average yield with and without fertilizer, in tons/hectare/season ............................................................................... 17 5.2—Average yield of rice plots following or not following recommended fertilizer application timing, in tons/hectare/season ................................................................................................................................................... 18 5.3—Average yield by soil fertility management practice, in tons/hectare/season ............................................................. 19 6.1—Average yield of rice plots with and without herbicide, in tons/hectare/season .........................................................21 6.2—Average yield of rice plots with and without fertilizer, certified seed, and herbicide by rice ecology, in tons/hectare/season ................................................................................................................................................... 22 6.3—Average yield of rice plots with and without fertilizer, certified seed, and herbicide by agroecological zone, 2012............................................................................................................................................................................ 22 7.1—Average yield by land preparation practices during major season 2012, in tons/hectare/season .............................24 7.2—Average yield by planting practices during major season 2012, in tons/hectare/season ...........................................25
iv
ACKNOWLEDGMENT We are very grateful for the excellent survey interviews and field visits during the survey preparation by various colleagues at the Crops Research Institute (CRI), Savannah Agricultural Research Institute (SARI) and University of Cape Coast, namely Dr. Emmanuel Asmah, Agnes Ankomah Danso, Alex Adu Appiah, Benedicta Nsiah Frimpong, Boadu Sober, Edem Lotsu, Ewool Manfred, Getty Afukaar, Harriet Dwamena, Mary Nuako Bandoh, Owusu Konadu Isaac, Silvia Kafui Artcher, Edward Martey, Adogoba Desmond, Bashiru Haruna, David Atinga, Diches Adu Boateng, Leslie Ofei, Magareth Banka, Prince Maxwell Etwire, Razak Salifu, Talan Joshua, Whilem Kutah, and the drivers. We are thankful for the time shared and information provided by the rice scientists namely: Mr. Ralph Bam, Dr. Kofi Dartey, and Dr. Wilson Dogbe. We are also grateful for the guidance and review from Dr. Derek Byerlee, Dr. Shashi Kolavalli, CRI Director Hans Adu-Dapaah, CRI Deputy Director Joseph Lamptey, and SARI Director Stephen Nutsugah. We thank all the farmers, seed producers, input dealers, extension agents and public officials we interviewed who gave up their time to share ideas and experiences with us. They helped us understand the issues and opportunities in the rice sector.
v
1. INTRODUCTION This paper aims to provide up-to-date analysis using rarely collected nationwide data on the patterns of adoption of improved technologies for rice in Ghana, with the goal of assessing the progress of the National Rice Development Strategy (NRDS) and identifying entry points for strengthening the implementation of the program. The NRDS aims to double rice production by 2018 with 10 percent annual increases. These increases will most likely come from utilizing potential irrigable lands and valley bottoms with water supply, promoting rice production, and increasing the productivity of existing growers. Average rice yield in Ghana is estimated to be 2.5 tons/hectare (MOFA 2009–2011), while the achievable yield based on on-farm trials is 6–8 tons/hectare. This significant yield potential can be tapped through improvements in agronomic practices and adoption of underutilized beneficial technologies. This paper focuses on six key recommendations by the Council for Scientific and Industrial Research (CSIR) and the 1 Ministry of Food and Agriculture (MOFA) on technological packages for rice: (1) improved varieties and seed; (2) fertilizer use (rate, method, and timing of application); (3) herbicide use as a land preparation and weed control method; (4) the sawah system as a land and water management practice; (5) row planting and optimal plant density and spacing; and (6) seed priming. The other recommended practices captured in the survey are also briefly discussed. The paper provides insights on the reasons why farmers adopt or do not adopt certain varieties or technological packages promoted by CSIR and MOFA, providing greater understanding on the constraints to and opportunities for improving adoption and at the same time shedding some light on the experiences of those using these technologies. The paper examines patterns of adoption of improved rice technologies and is the second in a series of papers and larger projects assessing the determinants of technology adoption, the impact of technologies, and the effectiveness of research and development investments in Ghana. The first paper focuses on maize (see Ragasa et al. 2013).
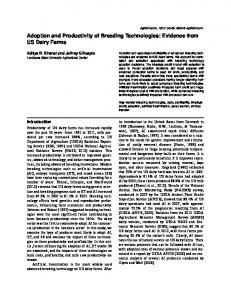
2. RICE SECTOR Rice is the second most important cereal after maize in Ghana and is fast becoming a cash crop for many farmers (MiDA 2010; Osei-Asare 2010). National and agricultural development plans and strategies, such as the Ghana Poverty Reduction Strategy (GPRS I), Growth and Poverty Reduction Strategy (GPRS II), Food and Agricultural Sector Development Policy (FASDEP) I and II, Medium Term Agriculture Sector Investment Plan (METASIP), and Accelerated Agricultural Growth and Development Strategy (AAGDS), have featured rice as one of the targeted food security crops. Annual per capita consumption of rice is growing rapidly, from 17.5 kilogram in 1999–2001 to 22.4 kilogram in 2002–2004 and 24 kilogram in 2010– 2011 (MOFA 2011a), and rice demand is projected to grow at a compound annual growth rate of 11.8 percent and maize at 2.6 percent in the medium term (MiDA 2010). Several estimates show very high levels of imports (valued at US$500 million annually [Osei-Asare 2010]), putting much pressure on foreign currency reserves and food security in Ghana. Estimates show that imported rice comprises about 70 percent of the quantity consumed in Ghana, or a 174 percent import penetration ratio (Amanor‐Boadu 2012). The majority of local rice production comes from the Northern (37 percent), Upper East (27 percent), and Volta regions (15 percent). Production in the Northern and Upper East regions decreased in 2011 due to poor weather condition, but production in Volta continued to increase and did not seem to be affected by less rain in 2011. In general, rice production and the area cropped with rice are increasing (Figure 2.1). Since 2007, production has been increasing at a faster rate than area of cultivation, proof that yield during this period has been trending upward. This growth is encouraging and may have been the result of the various initiatives to develop the rice sector in Ghana, including passage of the NRDS in 2009; various donor-funded projects, the majority of which were implemented in the period 2004–2009; and the national fertilizer subsidy program introduced in 2008, to which rice farmers have likely responded. There was a jump in production and acreage starting in 2008, which could be a compounded result of these various initiatives. However, the national average yield has remained low, at 2.5 tons/hectare/year according to MOFA (MOFA 2009–2011), or 2.2 tons/hectare/season according to the recent survey by the Crops Research Institute (CRI), Savannah Agricultural Research Institute (SARI), and International Food Policy Research Institute (IFPRI), indicating significant opportunity to reach potential achievable yields of 6–8 tons/hectare.
1
Other practices promoted are timely planting, integrated pest management system, timely harvesting, harvesting method, improved parboiling, proper drying and storage, and other practices detailed in the production manuals for inland rice production (CRI and MOFA 2005), upland rice production, and New Rice for Africa (NERICA) rice production (SARI undated).
6
Figure 2.1—Production, acreage, and yield of paddy rice in Ghana, 1993–2011
Source of raw data:
500
3.00
Area (000 hectare) Production (000 metric ton) Yield (ton/ha/year)
2.50
400
2.00
300
1.50
200
1.00
100
0.50
0
0.00
Yield (ton/ha/year)
Production (000 ton)/Area (000 ha)
600
MOFA (1993–2011).
Potential for Rice Sector Development There is potential to develop the rice sector in Ghana. Rice demand is projected to grow (MiDA 2010), and prices have been trending upward over time. The average wholesale price of local milled rice (100 kilogram bag) more than doubled, from 55 cedi in 2006 to about 120 cedi by 2011, while that of imported milled rice nearly tripled, from about 63 cedi to nearly 169 cedi (Amanor‐Boadu 2012). Considering a monthly salary for a middle-income earner in Accra of about 400 cedi (approximately $200) per month, rice purchases account for a substantial portion of household income. These statistics indicate the economic viability and attractiveness of rice production, as confirmed by a policy analysis matrix calculated by Winter-Nelson and Aggrey-Fynn (2008) and Akramov and Malek (2011), although profitability becomes negative when subsidies and trade protection are removed and when family labor is included in the calculation. 2 Imported rice is priced higher than local rice, by about 15–40 percent on average, and is mainly associated with betterquality long-grain perfumed rice of good taste and good appearance (translucent and with whole grains, although broken grains have their place in specific local dishes). Interviews among farmers in Ashanti region suggest that farmers sell a 50 kilogram bag of Jasmine 85 (perfumed and long grain) at 90 cedi, while Sikamo (unperfumed local rice) sells at 60–70 cedi per 50 kilogram bag. The rice sector in Ghana is segmented into two distinct target markets of local and imported rice. Imported rice is more popular in urban centers in general. In Accra, there is a heavy preference for imported rice; 95 percent of sample consumers were more familiar with imported varieties, and 71 percent consumed only imported rice and never tried local rice (Diako et al. 2010). However, in recent years, the adoption of fragrant local varieties by growers (e.g., Jasmine 85, Togo Marshall, and Aromatic short) nearer to Accra is giving access to consumers in the capital (Osei-Asare 2010). In Accra, Kumasi, and Tamale, 86 percent of sample consumers prefer imported rice, while a niche segment (14 percent) prefers local rice (Tomlins et al. 2005). While the appearance of raw rice is critical to consumers’ choice, taste and aroma determine consumer preference for cooked rice (Diako et al. 2010). The reasons given for not purchasing locally cultivated rice were poor postharvest handling, unavailability, and the generally perceived poor quality (Diako et al. 2010). The 29 percent who tried local rice did so because it is relatively cheaper than imported rice and is perceived to be more nutritious than imported rice (Diako et al. 2010). A study by Diako et al. (2011) confirms that local varieties have a higher mineral content than imported varieties, although imported varieties have the advantage of being easier to cook and the expansion ratio is greater, which is another feature preferred by many consumers. However, local rice is preferred in many rural areas where there is local production, especially in northern Ghana. In certain niche segments health-conscious consumers purchase local brown rice, while parboiled local rice is preferred in the Northern region of Ghana. The study by Acheampong, Marfo, and Haleegoah (2005) in Hohoe district (Volta region) and Bibiana district (Western region) suggests a strong preference for local varieties, as consumers perceive that local rice 2
Computed based on average price differences as shown in Amanor‐Boadu (2012).
7
contains more nutrients than imported rice. Moreover, sample consumers interviewed reported that local rice was consumed because it was more readily available than imported varieties (Acheampong, Marfo, and Haleegoah 2005). These findings suggest that there is existing demand for local varieties, that greater promotion of the nutritional advantages of local varieties could further boost purchases of local rice, and that improved postharvest handling and quality standards could enable several local perfumed rice varieties to directly compete with imported rice. On the supply side, vast potential irrigable lands, valley bottoms with water supply, and water bodies throughout the regions are available (Osei-Asare 2010). It is also said that because rice has been grown in Ghana for centuries, there is indigenous knowledge of rice that can be tapped in developing suitable agronomic practices (Osei-Asare 2010). In addition, the policy environment is also advantageous for rice production. The development of the rice sector seems to have received plenty of attention in Ghana over the years, as evidenced by numerous projects and programs supporting the sector. In 2009, the NRDS was developed to double local rice production by 2018 and to curb the negative impact of rice importation on Ghana’s economy. Since the early 1970s, several project interventions have sought to revive and develop the rice industry. Since 2001, there have been more than 20 rice-related development projects implemented by MOFA and donor partners, most of which ended in 2012 (see Annex 1). In 2004, the Ghana Rice Inter-professional Body (GRIB) was established as a platform for negotiation, policy dialogue, and resource mobilization to revamp the local rice industry. The sector is heavily protected, with import levies accounting for almost 40 percent of the value of rice imports, much higher than in major rice importers such as Senegal (NRI 2013). Rice is also a focus crop under the Ghana fertilizer subsidy program introduced in 2008 and a seed subsidy program introduced in 2012; both programs are ongoing in 2013. In 2013, the approved subsidized price for the most popular type of fertilizer (NPK 15-15-15) is 51 cedi per 50 kilogram bag, representing 21 percent of the current market price for fertilizer; and the approved subsidized seed price for rice is 35 cedi per 45 kilogram bag, representing 36 percent of the current rice seed price (MOFA 2012; Vibe Ghana 2013).
Rice Research Program Rice research in Ghana is performed primarily by the Crops Research Institute (CRI) and the Savannah Agricultural Research Institute (SARI) of the Council for Scientific and Industrial Research (CSIR). The University of Ghana and other universities also conduct both varietal research and testing and socioeconomic research on rice. Scientists at CRI and SARI reported that about 80–90 percent of research work is on varietal improvement and testing.
IMPROVED VARIETIES Twenty rice varieties have been officially released in Ghana since the 1970s (Table 2.1). All the varieties released are advanced varieties from AfricaRice, the International Rice Research Institute (IRRI), or other countries’ research institutes, and CSIR performed only testing, with no varietal modification. Most of the varieties released are for lowland rice ecologies, and only in 2009 were varieties released exclusively for upland rice ecologies. For upland areas, varieties available are NERICA 1 and NERICA 2 (both from AfricaRice), Emo teaa (early maturing, long grain, from AfricaRice), and Otoo mmo (resistant to weed and disease, from AfricaRice). For lowland rice ecologies, six varieties were released in 1982–1986, namely GRUG7, GR 18, GR 17, GR 19, GR 20, and GR 21. These earlier varieties seem to have concentrated on good parboiling yield. In 1997, Sikamo (TOX 3108 or GR 22) was officially released, although many farmers were already planting it before it was released, and estimates suggest that it was planted in 20 percent of irrigated area and 15 percent of lowland rainfed areas in 1997 (Dalton and Guei 2003). Sikamo has high nitrogen use efficiency, has good taste, is blast tolerant and drought tolerant, and is high yielding (that is, higher than the currently popular variety called Jasmine 85); however, it is difficult to thresh and has no aroma, which makes it less attractive to traders, and therefore farmers changed their Sikamo to Jasmine 85 and other aromatic varieties.
8
Table 2.1—Rice varieties released and promoted by CSIR Ecology
Source of germplasm of advanced variety
Year of release
Potential yield (tons/ hectare)
Days to maturity
Distinctive characteristics
FARO 15
FL
1970s
3–5
140–145
High parboiling yield that processors prefer, but with low consumer acceptability due to short, round, and sticky grain
GR 17 (IET 2885)
FL
MOFA (from regional project tested in Sierra Leone/Nigeria); GGADP IRRI
1986
4–6.5
120–130
Similar to FARO 15; high parboiling yield that processors prefer, but with low consumer acceptability due to short, round, and sticky grain
Variety
GR 18 (Afife)
L
1982
GRUG7 GR 19 (C168) GR 20 (IR 1750-F5-B5)
L HL L
1986 1986 1986
5.5
130
GR 21 (TOX 515-19-SLR)
HL
1986
4.5
120
TOX 3108 (Sikamo; GR 22)
L, U
IITA/AfricaRice
1997
4.5–8
L
IRRI
2002
4–5
U U
AfricaRice AfricaRice IRRI germplasm; developed, registered by Texas A&M IRRI IRRI
2009 2009
3–4 3–4
2009
4.5–8
2009 2009 2009 2009
6–8 6–8 4–5 4–5
DIGANG (also called Abirikukuo or Aberikukugo) NERICA 1 NERICA 2 JASMINE 85 (SAR-RICE 2; Gbewaa; Lapez)
HL, IR
NABOGO RICE KATANGA RICE OTOOMU (TOX 3377) EMO TEAA (IDSA85)
HL FL U U
Marshall (Amankwatia)
L
University of Ghana, Legon
2010
6–8
Wakatsuki (Bouake 189) Bodia (ITA-320)
L L
AfricaRice IITA/AfricaRice
2010 2010
6–8 6–8
Sakai (ITA-324)
L
IITA/AfricaRice
2010
6–8
Source:
High nitrogen use efficiency; difficult to thresh; no aroma; higher yield than 120–130 Jasmine 85; good taste; blast tolerant; drought tolerant; superior in milling recovery; superior in low percentage of broken grains Flexible across ecologies; early maturing; good for drought-prone areas; 115–120 grains break easily 95–100 95–100 110–120 Aromatic; long grain; good taste; preferred by consumers 120–130 130–140 110–115 Blast resistant; long and slender; no aroma Blast tolerant; aromatic; long grain; superior in milling recovery; superior in 115–120 low percentage of broken grains 125–130 Blast tolerant; no aroma; not very tasty; grains break easily 125–130 Blast tolerant; no aroma; grains break easily; sticky after cooking Blast tolerant; no aroma; good taste; less grain breakage; sticky after 135–140 cooking
Compiled from personal communication with Dr. Wilson Dogbe of the Savannah Agricultural Research Institute (SARI) and Dr. Ralph Bam of the Crops Research Institute (CRI); leaflets and PowerPoint presentations from CRI and SARI; and published production manuals. There were some inconsistencies in various guides, reports, leaflets, and personal communication, but this is our best effort to compile the information gathered. CSIR = Council for Scientific and Industrial Research; GGADP = Ghanaian-German Agricultural Development Project; IITA = International Institute of Tropical Agriculture; IRRI = International Rice Research Institute; MOFA = Ministry of Food and Agriculture FL = flooded lowland; HL = hydromorphic lowland; L = lowland (not specified); IR = irrigated; U = upland
9
In 2002, Digang (also called Abirikukuo or Aberikukugo) was officially released. It is early maturing, is good for droughtprone areas, and can be grown in different rice ecologies. In 2009 and 2010, seven lowland varieties were released (in addition to the four varieties for upland rice ecologies already described above), two of which are aromatic (Jasmine 85 and Marshall). Jasmine 85 was officially released in 2009, although many farmers were already planting it prior to 2009. Jasmine | APRIL 2010 85 is an advanced variety, with germplasm originating from IRRI and further developed and registeredSUMMARY by the University of Texas A&M. It is likely that the Jasmine 85 that has spread in Ghana is the version from Texas A&M, although no one seems to know how it got to CSIR or MOFA. The four varieties released in 2010 are described as blast tolerant, high yielding, and with good milling properties. Marshall (Amankwatia) is seen to have great potential, as it is both high yielding and aromatic. What is interesting about the rice seed sector are the numerous varieties of rice grown by farmers in Ghana outside the officially released ones. The 2007 CRI annual report included a list of 70 names of local and modern varieties (although several may be the same varieties but are called by different names in different locations). The report identified 29 upland varieties and 41 lowland varieties that were planted by farmers (CRI 2007). However, there is no systematic and regular cataloging of varieties and testing, and the lack of funding is often cited as the reason. Varieties that are believed to be modern or improved are also being evaluated by CSIR; these are promoted by projects and with small production of certified seed supported by MOFA. These varieties include WITA 7, Togo Marshall, Jet 3, and Aromatic short, although little is known about them within CSIR. WITA 7 is believed to be widely grown in West Africa; it was recommended by CRI earlier but not officially released (personal communication with Dr. Kofi Dartey of CRI). A production guide promoting WITA 7 describes it as a medium-maturing variety with a 4.5–6.0 tons/hectare average yield. Togo Marshall is aromatic and reported to be preferred by importers and millers in Ashanti region and by traders in Volta region (based on key informants’ interviews). Tests have only recently been conducted to determine whether Togo Marshall is the same as Marshall or Amankwatia, which is one of the released varieties. CSIR (personal communication with CSIR researchers) suggests that Amankwatia and Togo Marshall are different, although further tests are needed to ascertain this. Aromatic short, as the name implies, is aromatic and a shorter plant than Jasmine 85. It is believed to have been introduced by a private company and was initially called Jasmine 85; further testing by CSIR indicates that it is a different variety, since it is a shorter plant than Jasmine 85, although other traits are very similar to Jasmine 85. Official records of certified seed production reveal that certified seed production in the last 12 years has been dominated by three varieties: Jasmine 85, GR 18, and TOX 3107 (accounting for 91 percent of certified seed production). Half of certified seed production from 2001–2011 was Jasmine 85, 27 percent was GR 18, and 15 percent was TOX 3107 (see Annex 2). Faro 15, Sikamo, Digang, WITA 7, and Bodia accounted for 1–5 percent (80–500 tons). A few other varieties had certified seed production of 1–40 tons total for 11 years, namely Aromatic short, Jet 3, Togo Marshall, NERICA 1, NERICA 2, and IR 64. Only a few varieties have certified seed production in the most recent years (2010–2011): Jasmine 85, GR 18, TOX 3107, Aromatic short, Jet 3, and Togo Marshall.
CERTIFIED SEED In addition to using improved varieties, farmers are also encouraged to buy seed from certified or registered sources every cropping season, or if that is not possible, every two to three years. Due to poor harvesting practices, much grain falls into the soil and naturally mixes with the new seed and varieties being planted season after season. This natural mixing makes it difficult to maintain the purity and vigor of recycled seed, despite rice being self-pollinating.
FERTILIZER Research at CRI and SARI includes testing for optimal timing, method, and rate of application of fertilizer. After several onstation and on-farm trials, a split application (basal application with a compound fertilizer and top dressing with sulfate of ammonia or urea) is recommended. Recommended rates are 200–400 kilogram/hectare of compound fertilizer (NPK 15-1515) for the first application and 150 kilogram/hectare of sulfate of ammonia or 95 kilogram/hectare of urea based on cropping history (Table 2.2). The first application is recommended one week after planting for transplanting and two to three weeks after planting for direct seeding, while the second application should take place five to six weeks after planting (seven to eight weeks after planting for the northern savannah).
10
Table 2.2—CSIR/MOFA recommended rate and timing of fertilizer application for rice, per hectare Location and type of rice
1st application NPK 15-15-15 Rate Timing
2nd application SOA or urea Rate Timing
Total nutrients (kg) N
P
95
60
60
80
45
45
60–80
30–45
30–45
Lowland areas Transplanted
400 kg
1 WAP
Direct seeding
300 kg
2–3 WAP
200–300 kg
1 WAP (transplanted); 2–3 WAP (direct seeding)
Northern Savannah Sources:
150 kg SOA or 75 kg urea 150 kg SOA or 75 kg urea
5–6 WAP (or just before booting) 5–6 WAP (just before booting)
150 kg SOA or 75 kg urea
7–8 WAP
K
SUMMARY | APRIL 2010
Various production guides and personal communication with researchers at CSIR. SOA = sulfate of ammonia; WAP = week(s) after planting
LAND PREPARATION AND WEED CONTROL Plowing with follow-up harrowing is recommended as a land preparation method. Zero tillage with herbicide is also recommended for conserving soil moisture and improving soil fertility while at the same time suppressing weeds. Herbicide use for weeding after planting is also recommended. Pre-emergence herbicide is applied 2–3 days after sowing, while postemergence herbicide is applied 21–25 days after sowing.
SEED PRIMING Generally, seed priming involves soaking the seed in clean water for 12–24 hours and air drying it for 24–48 hours before planting. On-station and on-farm trials conducted in Ejisu-Juabeng, Dromankuma, and Fumesua in 2000 suggest that primed seed provides a 25 to 40 percent higher yield than nonprimed seed. Seed priming has been actively promoted by CRI rice breeders in Ashanti, Volta, and some parts of the Western region (personal communication with Dr. Ralph Bam of CRI). A study by Bam et al. (2006) shows that soaking or priming rice seed with water containing a small quantity of fertilizer (specifically, potassium and phosphorus) reduces germination time, increases the daily rate of seedling emergence, and results in faster growth of seedlings than seed primed with just water. Treating seed with chemicals during storage and before planting is also recommended to protect against insects and diseases (CRI and MOFA 2005; SARI undated).
ROW PLANTING AND PLANTING DENSITY It is recommended that rice plots be planted in rows or lines. For transplanting, the recommended planting density is 35–45 kilogram/hectare, at a spacing of 20 cm x 20 cm at two plants per hill (20 x 25 cm based on SARI report), with transplanting taking place 21–28 days after seeding. For direct seeding, the recommended planting density is 45 kilogram/hectare for dibbling or drilling and 100 kilogram/hectare for broadcasting. Transplanting is recommended for more reliable plant stand, but moisture conditions must allow for transplanting. In the north, dibbling or drilling in lines or rows is recommended over broadcasting (SARI undated).
SAWAH SYSTEM The sawah system is a technology package used in lowland areas involving bunding, puddling, and leveling to achieve better water control and nutrient management. Several published studies have been conducted to determine the yield advantage of the sawah system. Data from on-station trials conducted between 2006 and 2009 in southern Ghana concluded that the sawah system has the potential to double yield regardless of the variety (Bam et al. 2010). Faltermeier and Abdulai (2009) show that bunding induces input demand increases, although they did not find significant impact on rice output and net returns. A recent paper (Buri et al. 2012) suggests that rice cultivation under the sawah system in inland valleys in Ghana has led to significant improvement in soil and water management. There has been a gradual and significant increase in rice grain yield as farmers shifted from practicing only bunding, to bunding and puddling, to bunding, puddling, and leveling (sawah), across locations and varieties (Buri et al. 2012).
11
3. DATA SOURCE AND METHODS This paper draws on data from a survey of 576 rice farmers in 23 districts in 10 regions in Ghana implemented from November 2012 to February 2013 by the Crops Research Institute (CRI), Savannah Agricultural Research Institute (SARI), and International Food Policy Research Institute (IFPRI). SUMMARY | APRIL 2010 The survey used three-stage, clustered, and randomized sampling procedure. First, a proportional probability sampling of districts was done, giving more weight to those with higher rice production, and the final list of sample districts was done in a randomized procedure. That was followed by a random selection of enumeration areas (EAs) in each of the sample districts using the same classifications and boundaries as the census and the Ghana Living Standards Survey. And finally, a random selection of farmers was made in each of the sample EAs. Twenty-three districts were selected from a list of rice-producing districts (districts with more than 1,000 ha of rice production; see Annex 3). The sampling frame represents 98 percent of total hectares planted with rice in Ghana during 2009– 2011. A proportional probability sampling was used to select the sample districts (that is, districts with a larger production area of rice were given a higher probability of being selected). The selected districts represent 65 percent of total rice production area (and 69 percent of total rice production in tons) in Ghana during 2009–2011. The method of sample within each rice-producing district was not straightforward given that rice production is still not common in most villages, even in rice-producing districts, and there is no census or national dataset that provides information on where the rice-producing communities and rice farmers are in the country. In each sample district, communities and farmers were selected based on three rice ecologies: irrigated, lowland rainfed, and upland rainfed systems. Within irrigated areas, six major irrigation schemes were selected, representing 92 percent of the total hectares of developed area for irrigated crop cultivation (mainly rice) (see Annex 4). For each of the six irrigation schemes, 21 farmers were selected at random. Given that there were no available data on lowland and upland rice production per district, three EAs were randomly selected in each sample district, from which the sample lowland and upland rice farmers were selected. An additional three EAs were selected to serve as replacement EAs in case the first three turned out to be non-rice-producing EAs. In each selected EA, seven farmers were randomly selected from a compiled list of all rice farmers in the sample EAs. To be included in the list, a farmer had to manage and make decisions regarding a rice plot with a minimum size of 0.5 acre (0.2 hectare) during the major season of 2012. The list was arranged by upland and lowland systems and by gender (that is, upland and lowland rainfed systems and gender were used for implied stratification in the sampling process). The total sample was 576 rice farmers, with 80 percent male and 20 percent female. A quarter of the sample rice farmers reported cultivating and managing two rice plots; therefore, the dataset includes 601 rice plots that were used for analysis. About 6 percent of the sample farmers were in upland rice ecologies, 67 percent in lowland rainfed rice ecologies, and 27 percent in irrigated rice ecologies. In the CRI/SARI/IFPRI survey, irrigated area represents 19 percent of rice area, compared to only 8 percent in the estimates by MOFA and JICA (2008) (see Annex 5). The proportion of rice area for lowland rainfed systems is similar in the national estimates by MOFA and JICA and the CRI/SARI/IFPRI survey. Among upland and lowland rainfed systems (excluding irrigated area), the CRI/SARI/IFPRI survey captured a lower proportion of upland rainfed system (only 8 percent of area and 7 percent of production) compared with the estimates by MOFA and JICA (17 percent of area and 8 percent of production), despite a randomized sampling adopted with implied stratification by upland and lowland ecologies. Given that no agricultural census has been performed, it is difficult to ascertain the national proportion of upland, lowland, and irrigated rice production and acreage. The CRI/SARI/IFPRI survey suggests that the proportion of upland rice acreage and production may be smaller than was reported in the past. However, given the small sample, this paper contains limited discussion and no disaggregated analysis of the upland rice ecology. For lowland rainfed areas, we included disaggregated analyses by four major agroecological zones: forest, transitional (immediately north of forest), northern savannah (which combines Northern Savannah and Sudan Savannah, which we believe do not differ much in terms of rice management practices), and coastal savannah. The average rice plot size in the sample is 1.04 ha (Table 3.1). There is no statistical difference in the rice plot size between northern and southern Ghana, but female-managed rice plots are statistically smaller than male-managed plots in both northern and southern Ghana. There is a slightly higher plot size in Forest and Northern Savannah zones than in Transitional and Coastal Savannah zones. Rice is a highly commercial crop, with 70 percent of harvest being sold, on average. The Northern Savannah zone has the lowest proportion of rice harvest sold (59 percent) and a greater proportion of own home consumption, on average.
12
Table 3.1—Characteristics of sample rice farmers Agroecological zone Forest Transitional Northern savannah Coastal savannah All zones Source of raw data:
Number sample farmers
Plot size (ha)*
% of rice sold*
Female (%)
Married (%)
Native (%)
Age, avg.
63 80
1.4 0.8
85 76
15 37
90 90
37 47
41 44
6 8
336
1.1
59
13
88
98
40
97
0.9
90
34
86
83
1.0
70
20
88
82
576
Years Houseeducation, hold size, avg. avg.
Crop income (% total income)
Total farmland (ha), avg.
9 7
88 85
5.1 2.0
3
16
85
4.0
45
7
8
76
1.4
42
5
13
84
3.5
SUMMARY | APRIL 2010
CRI/SARI/IFPRI survey (November 2012–February 2013). * Averages; other columns (except column 1) are the proportion of total farmers in each zone.
The average household size is 13 members. Income from crop production represents about 84 percent of total income, indicating that these farmers rely heavily on their farms for income and household food security. Most rice farmers in the forest zone have tree crop production in addition to rice and other field crop production. Total hectares under cultivation was highest for the sample farmers in the forest zone, largely due to tree crop plantations (5.1 ha per farmer on average), followed by the Northern Savannah zone, which is known to have more abundant agricultural lands and less densely populated areas (4 ha per farmer on average). Total farm size per farmer in the transitional zone is about 2 ha on average, and 1.4 ha on average in the Coastal Savannah zone. About 20 percent of the rice farmers in the sample were female, and, except in the Forest and Transitional zones, the majority of the sample rice farmers were natives in the community (not settlers from other locations). The average age was 40 years and the average number of years of education was 5. Most of the rice farmers in the sample had primary education, and the next largest groups were those with no formal education and with secondary education. The number of crop plantings in a year is dictated by irrigation or rainfall availability in the agroecological area. The majority of farmers in rainfed areas (upland and lowland) plant during the major season only, with the exception of a few farmers growing for two seasons in the Forest area, with or without pump irrigation. Most farmers plant at least two seasons of rice in irrigated areas. There were a few plots under block farming, government input provision via credit scheme, or other special project by nongovernmental organizations (NGOs) or donors in 2012 (irrigation projects are not included). Only 6 percent of rice area was under block farming in the 2012 major season. For irrigated rice ecology, 22 percent of rice area was under block farming. In lowland rainfed systems, only 2 percent of rice hectares were under block farming, inland rice development projects, or other projects. For upland, 4 percent of total hectares were under a special project (block farming).
4. IMPROVED VARIETIES AND CERTIFIED SEED Figure 4.1 presents the rate of input use and adoption of the main recommended agronomic practices among rice farmers during the major season of 2012. Fifty-eight percent of rice area was planted with modern varieties during the major season 3 of 2012 (99 percent in irrigated areas; 48 percent in lowland rainfed areas; and 61 percent in upland areas). Only 34 percent of rice area was planted with modern varieties from certified sources (registered seed dealers, certified seed growers, MOFA projects, or researchers/breeders), while 24 percent was planted with seed sourced from other farmers or from the grain market. Moreover, only 16 percent of rice area was planted with freshly acquired certified seed in 2012. Farmers recycle their modern varieties for four to five years on average. The most commonly planted variety was Jasmine 85, which was grown in 27 percent of rice area during the 2012 major season. The second most commonly planted variety was Mandii, which was originally from Sierra Leone and was introduced by MOFA in the 1970s; it is suitable for low-input systems, can withstand long flood periods, and can compete very well with weeds (19 percent of rice area overall and 25 percent of rice area in lowland rainfed, mostly in the north) (see Annex 6 for 3
This CRI/SARI/IFPRI survey and the official certified seed production data from MOFA (Annex 2) seem consistent overall, although there seems to be greater adoption of GR 18 (Afife) and TOX 3107 (Bumbaz) based on the 11-year production of certified seed, while in this 2012 survey we saw very little adoption of these two varieties and more adoption of Aromatic short, Jet 3, and Togo Marshall. This may be because production of the former two varieties stopped in 2010 while production of the latter three varieties started in 2011, and these seem to be the ones planted in rice plots in 2012.
13
the full list of varieties planted). The third most common variety was Togo Marshall, an aromatic variety from Togo (11 percent of rice area), followed by Jet 3 (4 percent of rice area). In general, there seems to be fast varietal turnover in the rice sector in Ghana. The rate of varietal turnover, or 4 weighted-average varietal age, of modern rice varieties that are officially released in Ghana is six years, which is similar to SUMMARY | APRIL 2010 estimates compiled by Smale (1998) and by the DIVA project (Diagne et al. 2013) (see Annex 7). If varieties take too long to be replaced, there is danger that a given variety’s superiority and performance will collapse before it is replaced, given its average longevity and environmental conditions (Alene and Mwalughali 2012), which translates into low productivity and economic loss to the farmers. In Ghana, rice varieties are replaced regularly by the research system and by the farmers at a rate comparable to other countries where data are available, and at a rate much faster than maize varieties (23 years of varietal turnover for maize in Ghana [see Ragasa et al. 2013]). Figure 4.1—Adoption rate of major inputs and agronomic practices of rice farmers during major season 2012, as percentage of rice area All 100
Irrigated
Lowland rainfed
99
% of total rice area
90
60 50 40 30 20 10 0
Source:
76
80 70
58
Upland
99
66
61
58
53
48
37 27
20 11
34
32
29 16
9 0
57
33
84
99 94 93 95
88 89 82
89 69
64
52 40
31
29
25 16 10
13 3
4
8
28 20 14
3
1
CRI/SARI/IFPRI survey (November 2012–February 2013). Note: *Inputs referred to are fertilizer, certified seed, and herbicide.
There are some differences in the varieties planted in various rice ecologies. Jasmine 85 was the most common in irrigated areas (53 percent) and upland areas (37 percent), but only second to Mandii in lowland rainfed areas. The second most commonly planted variety in irrigated areas was Togo Marshall (20 percent), followed by Jet 3 (10 percent) and Aromatic short (6 percent). Togo Marshall was the third most common variety in lowland rainfed areas (9 percent), after Mandii and Jasmine 85. The second most common variety in upland areas was Digang (13 percent). The next most common varieties in the upland area were Mr. Harry (12 percent) and Mr. Moore (10 percent)—both are believed to be traditional varieties from the south of the country that were also introduced to the north of the country and were named after the persons who introduced these varieties to the communities—and Mandii (10 percent). There is also some difference across agroecological zones. Almost all rice farmers in the Forest and Coastal Savannah zones adopted modern varieties. There is still wide adoption of traditional varieties (especially Mandii) in the Northern Savannah zone. Jasmine 85 was the most popular in the Forest zone. Togo Marshall and Jet 3 were the most popular varieties in the Transitional zone. Togo Marshall was the most common variety planted in the Coastal Savannah zone. 4
The rate at which new varieties come into the system and replace older varieties depends on the varietal traits, seed availability, and farmer preferences and is computed as the average age of the modern varieties weighted by the area planted (see Brennan and Byerlee 1991). In Ghana, several varieties, such as the Jasmine 85, have already been planted by farmers even before their official release. For the calculation of varietal turnover, we used the official release year, regardless of whether the variety has been planted before that or not. Using the year when Jasmine 85 was first tried by farmers could increase the weighted-average varietal age for a few years but it is difficult to ascertain the exact base year.
14
Dalton and Guei (2003) show an aggregate adoption rate of modern varieties of 80 percent in 1997 in lowland areas (GR 18, Sikamo, GRUG7, and other varieties each at 15 percent and GR 17, 19, 20, and 21 each at 5 percent) and 65 percent in irrigated areas (Sikamo, 20 percent; GRUG7, 25 percent; and other varieties, 20 percent), which is slightly different than results from our survey. In 2012, the adoption of modern varieties was 58 percent, which is much lower than SUMMARY 2010 the estimate in 1997, and the varieties planted were completely different. It appears that either the expert opinion| APRIL employed in Dalton and Guei (2003) may have been overly optimistic by a large order of magnitude, or disadoption occurred on a widespread scale within the past 15 years. For irrigated areas, the adoption of modern varieties has increased to almost 100 percent, from only 65 percent estimated in 1997. Varieties have changed over the years, with current preference for varieties that are aromatic and slender, traits preferred by many urban consumers. Average yield is highest in the irrigated areas. Plots with modern varieties have higher yields than plots with traditional varieties in lowland rainfed areas, while yields are the same in upland areas (there were no plots with traditional varieties in irrigated areas) (Figure 4.2). In all systems, plots with certified seed have significantly higher yields than plots with uncertified seed. In all systems, plots with freshly acquired certified seed have substantially higher yields than plots with recycled certified seed. Plots planted with freshly acquired certified seed in irrigated areas have the highest yields, on average. Plots with seed from uncertified sources have similar yields to plots with recycled certified seed in irrigated areas. This may suggest the importance of acquiring new seed every cropping season. All these results are based on fertilized plots; while there are no plots in the dataset to compare yields between plots with certified seed or not and between those with fresh and recycled seeds without using fertilizer across rice ecologies. Among lowland rainfed areas, there was significant difference between plots with certified seed and plots without certified seed in all agroecological zones, except the Northern Savannah zone. The traditional varieties popular in the Northern Savannah seem to offer yields similar to those of the modern varieties. This could be one of the reasons why modern varieties are not yet that popular in the north. Figure 4.2—Average yield of plots planted with modern, traditional, certified, not certified, fresh, or recycled seed, by cropping system, in tons/hectare/season 6.0
5.7
5.0 4.3 3.9
4.0
Modern variety 3.0
3.0 2.4
2.3 2.0
3.1
1.9 1.5 1.4
1.3
Traditional variety Certified seed Not certified seed
1.9 1.4
2.8
Fresh certified seed
1.4
Recycled certified seed
1.0 0.0
Source:
Upland
Lowland rainfed
Irrigated
CRI/SARI/IFPRI survey (November 2012–February 2013).
For farmers who did not purchase certified seed, the most commonly cited reasons for not purchasing commercial seed were lack of information about which new seed or variety was good (reported by 35 percent of farmers) and unavailability of or lack of access to certified seed farmers would like to try (reported by 31 percent of farmers). About 19 percent of farmers also reported the cost of seed or lack of funds as the reason for not purchasing certified seed. Other reasons given by the rest of the nonusers include “I do not trust input dealers,” “I prefer my own seed,” “I have my own seeds and I don’t need new ones,” and “I source my seed from other farmers,” indicating a lack dissemination of information about new varieties and the importance of certified seed, or general distrust of other sources, perhaps due to the farmers’ own previous experience or the experience of other farmers they know.
15
5. FERTILIZER USE Inorganic fertilizer was applied to 66 percent of the rice area surveyed (Figure 4.1). Almost all irrigated rice areas were treated with inorganic fertilizer, while there was a much lower adoption rate in lowland and upland rainfed areas (57 percent and 76 percent of rice area, respectively). For rice plots with fertilizer, the amount of nitrogen applied was 64 kiloSUMMARY | APRIL 2010 gram/hectare on average, and about 30 kilogram/hectare each of phosphorus and potassium (Table 5.1). The application rates recommended by CSIR and MOFA are 65 kilogram/hectare of nitrogen for rice plots in the forest zone with less than five years of fallow period and 100 kilogram/hectare of nitrogen for rice plots that are continuously cropped (most of the plots in our sample), and, therefore, the average rate of application falls short of the recommendation. The fertilizer subsidy program may have been instrumental in encouraging greater use of fertilizer, but 34 percent of rice area was still not treated with fertilizer, and for those receiving fertilizer the application rates were lower than the recommended rate. Application rates on plots in rainfed lowland and upland areas were much lower than the recommended rates and much lower than the rates applied to irrigated plots. The most commonly used type of fertilizer was NPK 15-15-15 (applied to 90 percent of plots with fertilizer). Sulfate of ammonia was more commonly used for the second application (77 percent) compared with urea (12 percent). These three fertilizer types are covered in the subsidy program. Table 5.1—Distribution of rice farmers by fertilizer use and their application intensity, percent Variables Inorganic fertilizer (% of farmers) For plots with fertilizer (kg/ha) Nitrogen Potassium Phosphorus For plots with fertilizer (% of farmers) NPK 15-15-15 (N 15%, P 15%, K 15%) Sulfate of ammonia (N 21%, S 24%) Urea (N 46%) Sulfan (N 24%, NH 4%, NO3 12%, S 6%) Actyva (N 23%, P 10%, K 5%, S 3%, Mg 2%, Zn 0.3%) Foliar (N 5%, P 7.5%, K 5%, Mg 5%, S 5%, B 5%, Zn 5%, among others)
All
Irrigated
Lowland rainfed
Upland rainfed
77
98
68
82
64 30 31
84 43 43
54 25 25
43 19 19
90 77 12 1 3
99 84 17 1 1
87 75 10 0 3
71 61 4 7 14
0.2
0.0
0.4
0.0
Source:
CRI/SARI/IFPRI survey (November 2012–February 2013).
Note:
kg/ha = kilogram per hectare; N = nitrogen; P = phosphorus; K = potassium; S = sulfur; Mg = magnesium; Zn = zinc; B = boron; NH4= ammonium; NO3 = nitrate.
Across irrigation areas, fertilizer was applied to almost all plots (except two or three plots in Bontanga and Vea that did not received fertilizer), but the rates of application were quite different. Plots in Kpong irrigation sites had the highest application rate (126 kilogram/hectare of nitrogen on average), higher than recommended. The application rate in the north was lowest: 71 kilogram/hectare of nitrogen in Tono, 54 kilogram/hectare in Vea, and 56 kilogram/hectare in the Bontanga irrigation site. Across the lowland rainfed areas, there were much higher adoption and application rates in the Coastal Savannah zone (all plots had fertilizer), followed by the Transitional zone (79 percent of rice area), and the Northern Savannah zone (65 percent of rice area), while the lowest adoption and application rate was found in the Forest zone (53 percent of rice area). Plots with fertilizer have higher yields than those without in all rice ecologies (Figure 5.1). Even with uncertified seed, plots with fertilizer have higher yields than those without fertilizer. The highest yield was observed in irrigated areas with both fertilizer and certified seed. Plots in lowland rainfed areas in Transition and Forest zones have higher yield than those without fertilizer, and plots in Northern Savannah with fertilizer have higher yields than those without across all three rice ecologies (there are not enough observations to make other comparisons across agroecological zones).
16
Figure 5.1—Average yield with and without fertilizer, in tons/hectare/season 4.5
4.3
3.9
4.0
3.2
3.5 3.0 2.5 2.0
1.6
1.8
2.3
1.8
1.4
1.3
1.5 1.0
2.0
2.5 1.6 1.2
1.2
0.7
0.7
SUMMARY | APRIL 2010 Fertilizer No fertilizer
0.5 0.0
Upland Lowland Irrigated Upland Lowland Irrigated Upland Lowland Irrigated rainfed rainfed rainfed All plots
Source:
Plots with certified seed
Plots without certified seed
CRI/SARI/IFPRI survey (November 2012–February 2013).
Despite higher yields associated with fertilizer use and the presence of subsidized fertilizer prices, many famers in rainfed areas are still not using fertilizer, and those who are using it have low application rates. Forty-one percent of the nonusers (mainly in the Northern Savannah) reported that that they did not purchase fertilizer because they did not have funds at that time, and an additional 26 percent of nonusers (mainly in the Western and Upper West regions and to some extent in the Upper East and Northern regions) said that fertilizer was still too expensive. Part of this high cost was due to untimely delivery or unavailability of subsidized fertilizer, especially in rural areas outside the district capitals. Survey data suggest that average subsidized fertilizer prices reported by village leaders during the major season of 2012 were higher than approved prices, while some villages did not get the subsidized prices, suggesting challenges in implementation. Interestingly, 26 percent of non–fertilizer users reported that they did not use fertilizer because they perceived their plots to be fertile (mostly Forest zones in the Ashanti, Eastern, and Volta regions). Only 3 percent did not know about fertilizer and its benefits and profitability.
Timing of Application In addition to the intensity of application, the timing of fertilizer application is an important component of the recommendations by CSIR and MOFA. A split application (a first application or basal application and a second application or top dressing) is recommended. For the first application, it is recommended that farmers apply fertilizer a week after transplanting or two to three weeks after direct seeding. NPK 15-15-15 is recommended for the first application. For the second application (top dressing), recommended timing is five to six weeks after planting or seeding, or just before booting in the south, and seven to eight weeks after planting in the north. Sulfate of ammonia or urea (with a greater concentration of nitrogen for plant growth) is recommended for the second application. The survey suggests that actual practices are very different from these recommendations (Table 5.2). Only 15 percent of transplanted rice plots had fertilizer applied during the first week, while the large majority of rice plots (81 percent) were treated with fertilizer two to four weeks after planting. A greater proportion of directly seeded rice plots received fertilizer applications at the recommended timing (two to three weeks after planting) (58 percent), while 25 percent received fertilizer four weeks after planting and the rest were treated much later. Subsequently, in terms of the second application, only 43 percent of transplanted rice plots and 45 percent of directly seeded plots followed the recommended schedule of application five to six weeks after planting. More than a third of plots were treated seven to eight weeks after planting, as recommended in the north. About 10–16 percent of plots were fertilized earlier, while the rest were fertilized at a much later date.
17
Table 4.2—Distribution of farmers and timing of first fertilizer application, major season 2012 Transplanting
Direct seeding
Weeks after planting
NPK 15-15-15
SOA (N21, S24)
Urea (N46)
All
%
1 2 3 4 5 6 7 8 11 12 Total
20 46 42 20 0 1 0 0 0 0 129
1 1 0 2 0 2 0 1 0 0 7
0 0 0 0 0 1 0 0 0 0 1
21 47 42 22 0 4 0 1 0 0 137
15 34 31 16 0 3 0 1 0 0 100
Source:
CRI/SARI/IFPRI survey (November 2012–February 2013).
Note:
Shaded lines are the recommended timing of application.
NPK SOA (N21, Urea 15-15-15 S24) (N46) 17 69 111 68 3 5 0 5 0 0 278
0 1 0 4 3 4 1 5 1 1 20
0 2 1 2 0 2 1 0 0 0 8
Others 1 4 3 6 2 1 1 1 0 0 19
All
%
| APRIL 2010 18 SUMMARY 6 76 23 115 35 80 25 8 2 12 4 3 1 11 3 1 0 1 0 325 100
Yield differences between plots with fertilizer applied at the recommended timing and those with fertilizer applied at different timing were not significant (Figure 5.2). In upland areas, plots fertilized at the recommended timing had slightly higher yields (but not a statistically significant difference) than those with different application timing. In the irrigated areas, plots treated with fertilizer at different times had slightly higher yields (but not a statistically significant difference) than those following the recommended timing. The timing of fertilizer application did not seem to matter in explaining differences in yields across plots. There is no clear indication whether different application timings were due to lack of information on proper timing, untimely fertilizer supply, lack of funds to purchase fertilizer on time, lack of available labor when it was needed, or timing of rain or irrigation, or whether there is simply no observed difference in yield whether recommendations were followed or not. This question can be further investigated. Figure 2.2—Average yield of rice plots following or not following recommended fertilizer application timing, in tons/hectare/season 5.0
4.7
4.5
4.2
4.2
4.0
3.8
3.8
3.7
3.5 3.0 2.5 2.0 1.5
1.9 1.8
1.8 1.4
2.0
1.8 1.8
1.9 1.4
1.4
1.8 1.9
Followed recommendation Did not follow recommendation
1.0 0.5 0.0
Upland Lowland Irrigated Upland Lowland Irrigated Upland Lowland Irrigated rainfed rainfed rainfed First application
Source:
Second application
Both applications
CRI/SARI/IFPRI survey (November 2012–February 2013).
Other Soil Fertility Management Practices Several other soil fertility management practices are also being promoted by CSIR and MOFA: application of animal manure, not burning and instead plowing crop residue and planting into mulch, and crop rotation or relay cropping with nitrogen-fixing crops. The survey showed limited adoption of other soil fertility management practices (Table 5.3). Plowing in crop residue was common, especially in irrigated areas (62 percent of rice area); however, planting into mulch was less practiced (only 5
18
percent of rice area). Only a small proportion of rice area (4 percent) received animal manure during the 2012 major season. No farmers practiced relay cropping or crop rotation with nitrogen-fixing crops. Most plots were also cultivated with rice last year (2011). The large majority of plots (79 percent) had been continuously cropped for the last 11 years. The majority of plots that were fallowed at least once in the last 11 years were in the forest SUMMARY | APRIL 2010 zone. However, even in the forest zone the fallow system is slowly disappearing, as reported by several key informants, and our data show that more than 50 percent of rice plots in the forest zone have never been fallow in the last 11 years. Almost all sample rice farmers planted rice last year (2011), and will plant rice again next year. Table 5.3—Distribution of rice area by land preparation and planting methods during major season 2012, percentage Management practice Did not practice burning Plowed in crop residue Planted in mulch Applied animal manure Practiced crop rotation or relay cropping with nitrogen-fixing crops Source:
All
Irrigated
Lowland rainfed
Upland rainfed
83 45 5 4 0
96 62 8 8 0
79 39 3 3 0
79 41 6 1 0
CRI/SARI/IFPRI survey (November 2012–February 2013).
Vondolia, Eggert, and Stage (2012), using econometric techniques, show that fertilizer subsidies and the subsequent greater use of fertilizer did not encourage adoption of integrated soil fertility management practices in the Afife irrigation site (Volta region). Based on our survey results, the adoption of other soil fertility management practices remains limited despite great use of fertilizer, which seems to support the findings of Vondolia, Eggert, and Stage, not only for Afife but also in other regions of the country. Continuous cultivation coupled with limited adoption of soil fertility management practices puts a great deal of strain on the soil. Many rice farmers (17 percent of plots in the forest zone, 12 percent in the transitional zone, and 21 percent in the northern savannah) have continuously cropped at the same time and have not applied organic or inorganic fertilizer to the plot or adopted any other soil fertility management practices. Plots with manure have lower yields than those without manure in lowland areas (Figure 5.3), and plots with manure and inorganic fertilizer have lower yields than plots with only inorganic fertilizer. This may indicate the limited association of manure with higher yields in rice plots in lowland areas. Plots prepared by burning have lower yields than those prepared by not burning in upland and irrigated areas, but similar yields in lowland rainfed areas. Plowing in crop residue did not seem to be associated with higher yields, but planting in mulch did seem to be correlated with yield differences in lowland areas. Figure 5.3—Average yield by soil fertility management practice, in tons/hectare/season
Slash-and-burn
7.0
Plow in crop residue
Plant in mulch
Continuous cropping
Lowland rainfed
Irrigated
Lowland rainfed
3.5 1.8 1.8 2.0 1.1
1.6 1.8 1.5 1.0
Irrigated
Upland
1.2
3.4
Irrigated
3.6 2.4 1.6
Lowland rainfed
1.8
Irrigated
1.5
Lowland rainfed
1.5
6.4
6.4
Upland
3.9 3.9
1.3
Irrigated
Lowland rainfed
Upland
Irrigated
Lowland rainfed
3.9 3.1 1.6 1.8 1.6 0.9
1.4 1.3 1.7
Manure
Source:
4.0
Upland
3.2
Did not adopt
Upland
Adopted
Upland
8.0 7.0 6.0 5.0 4.0 3.0 2.0 1.0 0.0
Continuous cropping, with fertilizer
CRI/SARI/IFPRI survey (November 2012–February 2013).
Plots in irrigated areas with fertilizer and planted in mulch had significantly higher yields (3.4 tons/hectare higher on average) than those not planted in mulch. Among irrigated plots with fertilizer, certified seed, and herbicide, those planted in mulch had significantly higher (5.1 tons/hectare higher on average) yields than those not planted in mulch. Those planted
19
continuously (with or without fertilizer) had lower yields than those fallowed for at least a year in the last 11 years or more in irrigated areas, and similar in lowland rainfed areas, but the opposite was the case in upland areas.
6. HERBICIDE USE
SUMMARY | APRIL 2010 There was strikingly high use of herbicide in rice plots, with 84 percent of rice area treated with herbicide across all rice ecologies (Figure 4.1). Fifty-eight percent of rice area was treated with herbicide before planting, and 69 percent of the area was treated with herbicide after planting. For plots with herbicide, the rate of application before planting was 5.52 liters/hectare on average (Table 6.1). The rate of herbicide application after planting was 3.86 liters/hectare on average. The total rate of application before and after planting was 8.1 liters/hectare on average. The recommended rate depends on the location and extent of weed emergence in the plot. For example, the recommended rate in the Kpong irrigation scheme is 10 liters/hectare, and extension agents we interviewed in Ashanti region reported 6 liters/hectare that they usually recommend to rice farms, and it is therefore hard to tell whether farmers follow recommended rates or not. Table 6.1—Adoption and application rate of herbicide during major season 2012 Herbicide use and intensity Herbicide use either before or after planting Herbicide use only before planting Herbicide use only after planting Herbicide use both before and after planting Source:
Lowland Upland rainfed rainfed % of li% of li% of li% of liarea ter/ha area ter/ha area ter/ha area ter/ha Total
84 58 69 43
5.5 3.9 8.1
Irrigated
88 70 73 55
4.0 4.0 7.4
82 55 66 39
6.2 3.8 8.5
89 55 79 45
6.6 5.4 6.6
CRI/SARI/IFPRI survey (November 2012–February 2013).
There was higher adoption of herbicide before planting and both before and after planting in irrigated areas than in lowland and upland rainfed areas. While there was wide adoption of herbicide in all regions in the south and in the northern regions, there was a lower adoption and application rate in Upper West and Upper East. The lowest adoption rate was in Upper West, where only 30 percent of rice areas were treated with herbicide. The lowest application rate for plots with herbicide was in the Northern region (4 liters/hectare) and Upper West (6 liters/hectare) on average. The highest rates were in the Western region, at 13.7 liters/hectare, and Eastern region, at 10.0 liters/hectare, on average. The yield of plots with herbicide is significantly higher than that of plots without herbicide for all rice ecologies (Figure 6.1). The difference is even greater for plots with fertilizer and for plots with both fertilizer and certified seed. For irrigated plots with fertilizer and certified seed, there was a 3.1 tons/hectare difference between plots with and without herbicide. For lowland rainfed areas, the difference was 1.4 tons/hectare, and for upland areas the difference was 2.2 tons/hectare. The highest yield was 4.7 tons/hectare on average for plots with three inputs (fertilizer, certified seed, and herbicide). For plots without fertilizer, there was no difference between herbicide and no herbicide use.
20
Figure 6.1—Average yield of rice plots with and without herbicide, in tons/hectare/season 4.7
5.0 4.4
4.3
4.5
SUMMARY | APRIL 2010
4.0 3.5
3.0
3.0
2.6
2.5 2.0
1.8
1.6
1.5 1.0
1.6
2.0
1.8
1.7
0.7
1.4
1.2
1.2 0.7
1.6 1.1
1.2
1.2
Herbicide No herbicide
0.8
0.7 0.6
0.5 0.0
Upland Lowland Irrigated Upland Lowland Irrigated Upland Lowland Irrigated Upland Lowland Irrigated rainfed rainfed rainfed rainfed All plots
Source:
Plots with fertilizer
Plots without fertilizer
Plots with fertilizer and certified seed
CRI/SARI/IFPRI survey (November 2012–February 2013).
The entry of cheap herbicide, mainly from China, has made it cheaper to purchase and use herbicide than to spend much time or hire labor for weeding in Ghana. A simple comparison of weeding costs suggests that farmers using herbicide spend 666 cedi/hectare total in purchasing herbicide (8 liters at 8 cedi/liter) and an additional 86 person-days for manual weeding, while farmers not using herbicide spend 1,477 cedi/hectare for manual weeding for 211 person-days on average (Table 6.2). It is apparent from this calculation that it is cheaper to purchase herbicide than to hire or use family labor for weeding. Table 6.2—Cost difference between herbicide use and manual weeding Case Number of person-days for weeding (per ha) Average daily wage (cedi/person-day) Herbicide rate (liter/ha) Price of herbicide (cedi/liter) Total costs for weeding (cedi/ha) Source:
Without herbicide 211 7 0 8 1,477
With herbicide 86 7 8 8 666
Difference 125 8 811
Assumptions are based on the averages computed from CRI/SARI/IFPRI survey (November 2012–February 2013).
The few herbicide nonusers were asked why they did not adopt herbicide despite the much higher yields and cheaper weeding costs associated with herbicide use; almost half of them said that they did not have funds and another 20 percent reported that that herbicide was too expensive. Seventeen percent of nonusers said that they did not know about herbicide’s benefits and costs, or where and how to access it, and 11 percent of farmers reported that weeds were not a problem on their plots so they did not use herbicide. The diffusion of herbicide seems to be wide, and farmers are learning about it from other farmers. About half of farmers reported that they knew about herbicide and its benefits from advice by or observing other farmers’ plots. MOFA seems to have played a significant role in the promotion of herbicide (32 percent of farmers said that they had received the information from MOFA); projects by donors or NGOs also helped in the promotion (11 percent reported that they had received the information from projects). After the experience of other farmers, the next most common way of learning about herbicide was through visits by agents or researchers (18 percent of farmers reported), while plot demonstrations were limited (only 8 percent of farmers reported learning about herbicide through farm demonstrations). This suggests that if a technology is beneficial, it can spread quickly among farmers.
21
Figure 6.2—Average yield of rice plots with and without fertilizer, certified seed, and herbicide by rice ecology, in tons/hectare/season 4.7
5.0 4.5
SUMMARY | APRIL 2010
4.0 3.5
Three inputs
3.0
3.0
2.6
No input
2.5 1.5
Fertilizer only
1.8
1.8
2.0 1.2
1.0
0.6
1.0
0.7
1.2
1.3
Certified seed only Herbicide only
0.7
0.5 0.0 Source:
Irrigated
Upland
Lowland rainfed
CRI/SARI/IFPRI survey (November 2012–February 2013).
We also compared plots that had all three inputs (fertilizer, certified seed, and herbicide) and those without all or any one of these inputs. In all rice ecologies and agroecological zones, plots with these three inputs had significantly higher yields than those without any of these inputs (Figure 6.2). The difference was largest in irrigated areas. However, even without irrigation, using the three inputs seems to be associated with higher yields. This indicates high complementarity of these three inputs. Figure 6.3—Average yield of rice plots with and without fertilizer, certified seed, and herbicide by agroecological zone, 2012 4.5
Three inputs
3.9
4.0
No input
3.5 3.0
2.6 1.8
2.0 1.5
1.3
Fertilizer only
2.5
2.5
1.9 2.0
2.0 1.6
1.1 1.5 1.2 1.1 1.0
1.2
1.0
Herbicide only
0.5 0.0
Source:
Lowland rainfed in forest zone
Lowland rainfed in transitional zone
Lowland rainfed in northern savannah zone
Certified seed only
Lowland rainfed in coastal savannah zone
Fertilizer and certified seed only Fertilizer and herbicide only Certified seed and herbicide only
CRI/SARI/IFPRI survey (November 2012–February 2013).
In the lowland rainfed areas, there was a significant difference between plots with all three inputs and plots with none of these inputs in the Forest and Northern Savannah zones (there were no observations to allow comparison in Transitional and Coastal Savannah zones) (Figure 6.3). There was also a significant difference between plots using all three inputs and plots using only one or two inputs, except in the Northern Savannah zone, where plots using only fertilizer and herbicide had similar yields to plots using all three inputs. This is consistent with the findings in Section 4, suggesting that certified seed, freshly acquired seed, or modern varieties do not seem to explain yield differences in the north.
7. MANAGEMENT PRACTICES Sixty-one percent of rice area was plowed using a tractor or power tiller, and 8 percent was plowed using animal traction, mainly in the Northern Savannah zone. The large majority of plots in irrigated areas and upland areas were plowed, while only 56 percent in lowland rainfed areas were plowed. Among the lowland rainfed areas, only 3 percent of rice area in the
22
Forest zone and 19 percent of rice area in the Transitional zone were plowed, while a large share of rice area was plowed in the Coastal Savannah (59 percent) and Northern Savannah zones (78 percent). About 19 percent had a regular water source, mainly through formal irrigation schemes and 2 percent through private pumps. About 29 percent of rice area was treated with pesticide (59 percent of rice plots reported to have pest problems) SUMMARY | APRILrainfed 2010 (Figure 4.1). The large majority of irrigated areas used pesticide, while there was less adoption in lowland and upland areas. In addition to input use, several management practices are being promoted by CSIR and MOFA, including land and water management practices (the strictest form is the sawah system, involving bunding, puddling, leveling, and a regular water source), row planting and planting density, seed priming, and nets to keep birds away. A third of rice area was leveled and bunded and only 15 percent was puddled (Table 7.1). About 15 percent of rice area was under sawah (bunded, leveled, puddled, and irrigated). Only 20 percent of rice area was transplanted, while half of rice area was still planted through broadcasting and 30 percent through dibbling or drilling. Faltermeier and Abdulai (2009) find that dibbling as a seed sowing and fertilizer application method is associated with higher output, and when combined with improved weeding (double manual weeding), it not only increases output but also yields higher net returns. Only 13 percent of rice area was planted in rows or lines, despite much promotion of row planting since the 1990s. A quarter of rice area was planted with primed or soaked seed for better germination and yield. CSIR and MOFA recommend treating the seed with recommended pesticide right before planting (CRI and MOFA 2005). Only 1 percent reported treating seed right before planting. Only 1 percent of rice farmers reported treating seed for storage with chemicals. Table 7.1 shows that using nets to keep birds away is not very popular, with only 4 percent of rice area netted in the major season. About 73 percent of the farmers reported that birds were a major problem before harvest, but it seems that using nets has not become popular yet. Table 7.1—Distribution of rice area by management practices during major season 2012 Practice Plowing Leveling (%) Bunding (%) Puddling (%) Sawah (%) Transplanting (%) Broadcasting (%) Row planting (%) Plant density (kg/ha) Seed priming (%) Nets to keep birds away (%) Nets to keep birds away (for those reporting birds as problem) (%) Source:
Total
Irrigated
Lowland rainfed
Upland rainfed
69 33 37 15 15 20 50 13 96 25 4
81 71 89 68 68 55 45 20 99 62 5
56 26 27 3 3 12 53 10 95 18 4
91 0 0 0 0 0 22 25 92 5 0
6
7
6
0
CRI/SARI/IFPRI survey (November 2012–February 2013).
Plots that were plowed had higher yields than those not plowed in upland and irrigated areas (they had similar yields in lowland rainfed areas) (Figure 7.1). There were significantly higher yields in plots bunded, leveled, puddled, or under the sawah system than those not only in plots with fertilizer, certified seed, and herbicide (with or without irrigation in lowland areas). These practices did not seem to be associated with higher yields if fertilizer, herbicide, and certified seed were not used, suggesting complementary among inputs and improved practices.
23
Figure7.1—Average yield by land preparation practices during major season 2012, in tons/hectare/season 4.7
Did not adopt
1.5
1.8 1.5
2.2
2.2 1.4
2.6
1.5
4.32
4.2
4.1
SUMMARY | APRIL 2010
2.5
2.3 1.5
1.4
3.6
3.5
3.3
1.4
1.6
1.4
1.7
Bunding
Leveling
Puddling
Irrigated
Lowland rainfed
Upland
Irrigated
Lowland rainfed
Upland
Irrigated
Lowland rainfed
Upland
Irrigated
Lowland rainfed
Upland
Irrigated
Lowland rainfed
0.4
Plowing Source:
Adopted
4.3
Upland
5.0 4.5 4.0 3.5 3.0 2.5 2.0 1.5 1.0 0.5 0.0
Sawah system
CRI/SARI/IFPRI survey (November 2012–February 2013).
Row planting (applicable only to transplanted and dibbled or drilled rice plots) and seed priming seem to be associated with higher yields (Figure 7.2). Plots planted in rows or lines had significantly higher yields than those not planted in rows, across all rice ecologies. The largest difference was seen in irrigated areas. Plots planted with seeds that were primed before planting had significantly higher yields than those planted with seeds not primed. Recommended practices seem to be associated to higher yields only in upland areas. There was no difference among plots under transplanting, broadcasting, or dibbling or drilling in irrigated areas, but plots under transplanting seem to have higher yields than those planted using broadcasting or drilling in lowland rainfed areas. These results seem to suggest that the method of planting (transplanting, broadcasting, and drilling) is not associated with higher yields in irrigated areas, but once transplanting is chosen, yield is maximized by planting in rows. These practices did not seem to be associated with higher yields if fertilizer, herbicide, and certified seed were not used. Sixty-three percent of farmers pointed to labor constraints as the main reason for not practicing row planting in 2012. Thirty percent of the sample rice farmers reported that they were time constrained, 19 percent said that they had to pay higher wages for hired labor if they requested row planting, and 14 percent reported that they found it difficult to hire labor to work on the farm overall. A quarter said they did not plant in rows in 2012 because they did not know about row planting or its benefits. While labor constraints seems to be the major reason for the low popularity of row planting, more rigorous studies on the yield advantage of row planting over random planting and more information dissemination have a role to play in promoting the practice among farmers. The major reason for not priming seed was lack of information, while a few farmers mentioned lack of time or time constraints.
24
Figure7.2—Average yield by planting practices during major season 2012, in tons/hectare/season Adopted
SUMMARY | APRIL 2010
Recommended plant density
Irrigated
Lowland rainfed
Upland
Irrigated
Lowland rainfed
2.9
2.4 1.4 1.2
2.4
1.91.6 1.3
Row planting
4.5
3.64.0
Lowland rainfed
Upland
Broadcasting
3.1
Irrigated
1.9 1.2
2.2 1.6
Irrigated
Lowland rainfed
Upland
1.31.5 1.71.7
Irrigated
Lowland rainfed
2.4 1.5 1.2
3.93.9
Upland
3.93.9
Transplanting
Source:
Did not adopt 8.1
Upland
9.0 8.0 7.0 6.0 5.0 4.0 3.0 2.0 1.0 0.0
Seed priming
CRI/SARI/IFPRI survey (November 2012–February 2013).
Labor constraints associated with row planting seem to be a major issue in all regions except in Ashanti region, where the majority of farmers (65 percent) reported lack of information as the main reason for not practicing row planting, and a smaller share (24 percent) of farmers reported labor constraints. There seems to be a greater proportion of farmers in the Upper West and Eastern regions reporting no noticeable difference in yield between row planting and random planting.
8. CONCLUSIONS AND FURTHER RESEARCH Average rice yield in Ghana is estimated to be 2.5 tons/hectare (MOFA 2009–2011), while the achievable yield based on onfarm trials is 6–8 tons/hectare. With the aim of increasing productivity, the National Rice Development Strategy was approved in 2009, the national fertilizer subsidy program was introduced in 2008 (with rice as one of the focus crops), and a seed subsidy was announced in 2012 (with rice as one of the focus crops). Import levies and other taxes add up to almost 40 percent of the value of rice imports, suggesting heavy protection of local rice production. However, productivity remains low and the country is still dependent on imports, with imports accounting for 50–70 percent of domestic consumption. Low adoption of inputs and improved technologies is often cited as the major reason for the production gap. This paper has attempted to identify adoption levels and provide a better understanding of the constraints to and incentives for technology adoption by analyzing a nationally representative survey of 576 rice farmers in 23 districts in 10 regions in Ghana implemented from November 2012 to February 2013. A quarter of the sample rice farmers reported cultivating and managing two rice plots; therefore, the dataset includes 601 rice plots that are used for analysis. Six percent of sample farmers were in upland rice ecologies, 67 percent were in lowland rainfed ecologies, and 27 percent were in irrigated areas. Results of the descriptive analyses and simple mean comparisons of yield (ton/hectare) are presented in this paper; and these provide useful starting points and hypotheses for further testing using more advanced econometric methods. The key findings in this paper are as follows:
Improved varieties and certified seed Adoption of modern varieties was at 58 percent of rice area, lower than what was estimated by Dalton and Guei (2003) (71 percent) and lower than the average for Africa south of the Sahara as identified by the DIVA project (70 percent). While almost all rice farmers used modern varieties in irrigated areas, the adoption rate in lowland rainfed areas was only 48 percent and in upland areas 61 percent. Adoption was lowest in the Northern Savannah zone (48 percent). Moreover, only 34 percent of rice area was planted with modern varieties from certified sources, while 24 percent was planted with seed sourced from other farmers or from the grain market. Commercial seed production in the last 12 years has been dominated by three varieties: Jasmine 85, GR 18, and TOX 3107, with a few other select varieties and a limited supply of consumerpreferred aromatic varieties.
25
Mean yield comparisons suggest that plots planted with modern varieties and certified and freshly acquired seed have significantly higher yields in lowland rainfed areas, except in the north. Mandii and other traditional varieties seem to be competing well in terms of yield with the modern varieties in the Northern Savannah zone. All the farmers in irrigated areas used modern varieties, but plots with certified and freshly acquired seed had higher yields than those without certified seed. APRILwere 2010 Plots with certified seed also had higher yields in upland areas. The main reasons given by nonusers SUMMARY of certified|seed lack of information on good seed or good varieties, unavailable seed and varieties even though farmers would like to try them, and general distrust of seed or varieties from agro dealers or MOFA. Some nonusers reported expensive seed or lack of funds to buy seed, despite seed cost accounting for only a small fraction of total costs and only 18–22 percent of fertilizer costs at recommended rates. A seed subsidy was introduced in 2012 in response to farmers’ claims about expensive seed and as a way to encourage greater adoption of both certified seed and fertilizer. Obvious priorities to increase the adoption of modern varieties and certified seed are (1) greater dissemination and promotion, with a more active role for CSIR and greater coordination with MOFA and NGOs, and (2) strengthening the commercial seed system, focusing on better forecasting, inspection, and regulation to better meet demand and satisfy farmer-clients. Moreover, improved breeding and biotechnology applications have the potential to combine good traits from existing varieties or transfer germplasm to new varieties in Ghana. For example, while Jasmine 85 and Togo Marshall are preferred due to their aroma and good grain appearance, they are not the highest yielding and are not drought tolerant, and they are yet to be tested for their tolerance to blast and other diseases common in Ghana. Molecular markers can speed up breeding and allow the combination of preferred traits such as high yield, aroma, good milling and parboiling properties, or nutrient-enhanced characteristics. Areas that need further research include (1) investigation of why modern varieties and certified seed do not seem to be associated with higher yields in the north and understanding the desirable traits of popular traditional varieties in the north to inform breeding efforts, and (2) evaluation of the effect of seed subsidies introduced in 2012–2013 on seed, fertilizer, and other input demand; adoption of improved agronomic practices; yield; and net returns and the cost–benefit analysis of the seed subsidy program.
Fertilizer Fertilizer use in rice was quite high (66 percent adoption) and had most likely increased due to the fertilizer subsidy program. Almost all farmers in irrigated areas applied fertilizer. The average application rate for those who used fertilizer was 65 kilogram/hectare of nitrogen and close to the recommended 100 kilogram/hectare of nitrogen in areas that are continuously cropped. There were some cases of overapplication (more than 100 kilogram/hectare of nitrogen), mainly in the Kpong irrigation site and Coastal Savannah zone. There was a lower adoption and application rate in the Northern Savannah and Forest zones. The main reasons reported by nonusers were fertile soils and no need for fertilizer (mostly in the forest zone) and expensive fertilizer or lack of funds to purchase fertilizer (mostly in the northern savannah). Survey results and key informants suggest that approved subsidized prices were not always followed, and in many areas, especially those outside the district capitals, farmers did not have access to subsidized fertilizer. The latter reason reported by farmers does not imply that farmers need larger subsidies, but that implementation challenges will need to be addressed so that farmers not paying the approved prices or not accessing subsidized fertilizer can start to benefit from the program. Most farmers did not follow the recommended timing of fertilizer application; however, the timing of fertilizer application did not seem to matter in explaining differences in yield across plots using simple mean comparison test. There is no clear indication whether different application timings were due to lack of information on proper timing, untimely fertilizer supply, lack of funds to purchase fertilizer on time, lack of available labor when it was needed, or timing of rain or irrigation, or whether there was simply no observed difference in yield whether recommendations were followed or not. This question can be further investigated. Aside from fertilizer use, there was limited use of other soil fertility management practices. The use of manure and crop rotation or crop relay with nitrogen-fixing crops were unpopular. No-burn practice (83 percent of area) and plowing in crop residue (45 percent of rice area) were the only popular practices. The use of manure and planting in mulch were limited, and no rice farmers were practicing crop rotation with nitrogen-fixing crops. The large majority of plots had been continuously cropped in the last 11 years or more. Mean yield comparisons suggest that no-burn practices, planting in mulch, and the fallow system are associated with higher yields in irrigated areas. No-burn practices are also associated with higher yields in upland areas, and planting in mulch is also associated with higher yields in lowland rainfed areas. While many farmers perceive the soil fertility of their plots to be good (mostly in the Forest zone), soil testing will be needed to ascertain whether farmers’ perceptions are indeed true. With greater population density and the fallow system becoming less popular even in the forest zone (more than half of rice area had not been fallowed in the last 11 years or more), and limited adoption of soil fertility management practices, continuous cropping puts much strain on soil fertility. Areas
26
for further research include rigorous modeling of yield response to fertilizer, controlling for other inputs, agronomic practices, and other factors to ascertain whether fertilizer use is indeed contributing to higher productivity.
Weed control SUMMARY APRIL 2010 Given the availability of cheap herbicides, herbicide use is popular across all regions (84 percent adoption), with|high adoption and application rates especially in the Forest and Transitional zones. The average application rate was 8 liters/hectare; and there were many cases of higher rates of application (more than 10 liters/hectare) mostly in the Forest zone. Plots with herbicide had significantly higher yields than those without herbicide in all rice systems and all agroecological zones. The highest yields were achieved when herbicide was used along with fertilizer and certified seed. In addition to higher yields, farmers using herbicide had incurred less weeding costs than those who did not use herbicide, due to the greater labor requirement for weeding coupled with the high daily wages of hired labor. However, along with high pesticide and inorganic fertilizer use, excessive use and improper handling of chemicals may pose serious risks to farmers’ health, as well as causing food safety and environmental problems. Since adoption of these chemicals cannot be easily discouraged or regulated in the short term, greater education and training on safe handling of these chemicals will be extremely important. Further research on the implications of high use of chemicals should be considered more seriously. Safer products and alternatives could be explored.
Sawah system The sawah system (bunding, puddling, and leveling), a common practice in rice systems in Asia, is still practiced in a limited scale in Ghana. Only 68 percent of rice area in irrigated areas and 3 percent in lowland rainfed areas are under the sawah system. Plots that are bunded, leveled, and puddled, or combination of these, have significantly higher yields than plots not under these practices. However, if fertilizer, herbicide, and certified seed were not used, plots under sawah did not seem to have higher yields than those not under sawah. The major reason cited for not bunding, leveling, and puddling was lack of access to mechanization. Bringing more timely and more cost-effective mechanization services to many parts of Ghana will help in land preparation and proper timing of planting, and will therefore contribute to productivity improvements, in addition to allowing the labor saved to be used for other productive ventures.
Other management practices Two of the management practices that seem to be associated with higher yields are row planting and seed priming. However, only 13 percent of rice area was planted in rows (or 65 percent of area transplanted), and only 25 percent was planted with primed seeds. The method of planting (transplanting, broadcasting, or dibbling) did not seem to be associated with higher yields; but once transplanting was chosen, yields seemed to be higher if rice was planted in rows. Following the recommended planting density (35–45 kilogram/hectare) seemed to be associated with higher yields only in upland areas and not in irrigated or lowland rainfed areas. Row planting and seed priming did not seem to be associated with higher yields if fertilizer, herbicide, and certified seed were not used.
Irrigation Irrigated areas have higher yield per season than rainfed areas. Irrigation not only enables a second or third cropping and therefore higher annual output and income, but also gives higher yield per season. Irrigation seems to be a trigger for technology adoption and technical change. Farmers in irrigated areas seem to be using inputs and adopting improved technologies more than those in nonirrigated areas. Having full-time extension agents and more coordinated farm calendars and technological packages seems to be working in terms of achieving greater yields in irrigated sites. There is huge potential to expand irrigation in Ghana, and this could be a major priority of the government in pursuing its objective of increasing rice productivity and reducing dependence on rice imports, as stated in the National Rice Development Strategy.
27
ANNEX 1 – LIST OF PROJECTS AND PROGRAMS TO SUPPORT RICE SECTOR IN GHANA Rice projects Food Security and Rice Producers Organization Project Special Programme for Food Security in Ghana Project for Promotion of Farmers’ Participation in Irrigation Management The Study of the Promotion of Domestic Rice in the Republic of Ghana Improvement of Drought Tolerance of Rice through Within-Species Gene Transfer NERICA Rice Dissemination Project Inland Valleys Rice Development Project Small Scale Irrigation Development Project Small Farms Irrigation Project Rice Sector Support Project Ghana Rice Interprofessional Body (GRIB) Rice Seed Production
Year Year started ended
Estimated funding
USD 1.8 million Northern (EUR 1.4 million)*
2003
2008
2002
2007 USD 1.26 million
2004
Geographic focus
Various districts in the north and south 22 irrigated agriculture USD 2.52 million 2006 sites developed by (JPY 250 million)* GIDA USD 1.62 million (JPY 160 million)
Funding sources/ partners AFD (France)
Extension; irrigation
JICA
Extension; irrigation
JICA
Policy study
2008
2007
2009 USD 35,000
Northern regions
AGRA
2005
2010 USD 3.7 million
Ashanti, Brong Ahafo, Northern, Volta
AfDB
2004
2011 USD 15 million
5 regions in the south
AfDB
2001
2009 USD 15 million
Countrywide
AfDB
2003
2009 USD 9.5 million
Countrywide
BADEA
2008
2014 USD 17.3 million
Northern regions; Volta
AFD (France)
2008
2012 USD 140,000
Northern regions; Volta
2008
2010 USD 149,973
Northern
28
Extension; FBO formation and capacity building
FAO
2006
Countrywide
SUMMARY | APRIL 2010 Key components
AFD (France) AGRA
Research; seed Seed production; marketing; extension Research; extension; irrigation; credit and marketing; postharvest Extension; irrigation Extension; irrigation Extension; credit and marketing; postharvest; FBO formation Marketing; capacity building for GRIB Seed production
ANNEX 1 – CONTINUED. Rice projects
Year Year started ended
Estimated funding
Project for Sustainable Development of Rainfed Lowland Rice Production
2009
2014 USD 3.6 million
Development of Low-Input Rice Cultivation System in Wetland in Africa
2009
2015
2010
2015 USD 79,760
2011
2014
2004
2006 USD 970,415
2008
Ongoing
2008
2010 USD 1.27 million
2006
2011
2006
Ongoing
Development of Rice Varieties with Enhanced Nitrogen-Use Efficiency and Salt Tolerance (NUE-ESTAATF) Improving Yield, Quality and Adaptability of Upland and Rainfed Lowland Rice Varieties in Ghana to Reduce Dependency on Imported Rice Dissemination of Improved Rice Production Systems with Emphasis on NERICA to Reduce Food Deficit and Improve Farmers Income in Ghana Expanded Rice Programme An Emergency Initiative to Boost Rice Production Improving Organic Matter Content of Soil for Increased Yield of NERICA Japanese Grant Aid for Increased Food Production (2-KR/KR -2) Source:
USD 1.51 million (JPY 150 million)
Geographic focus Northern regions; Ashanti Ashanti
Funding sources/ partners JICA JIRCAS
Ashanti
AGRA
Various districts in both north and south
Northern regions
Compiled from various sources. * Converted using exchange rates of April 2013. AFD = French Development Agency
29
FAO, UNIDO, Japan govt.
USAID
Key components
SUMMARY | APRIL 2010 Extension; credit and marketing; postharvest Research focusing on rainfed system; low-input soil fertility management
ANNEX 2 – CERTIFIED RICE SEED PRODUCTION, 2001–2011, IN TONS Variety Jasmine 85 (SAR-RICE 2; Gbewaa; Lapez)
2001
2002
2003
2004
2005
2006
2007
2008
2011
Total Proportion (%) 5,388
49
1,088
257
0
2,976
27
0
0
416
215
0
1,601
15
113
75
19
0
0
539
5
0
0
0
0
0
191
2
17
0
24
42
0
0
83
1
104
13
3
3
0
0
123
1
18
21
40
0
0
0
0
2
140
9
148
134
232
306
80
140
208
TOX 3107
417
267
50
86
151
0
0
0
125
103
0
104
135
56
0
0
0
0
Digang
0
0
0
0
0
WITA 7
0
0
0
0
0
TOX 3108 (Sikamo; GR 22)
2010
383
0
GR 18 (Afife) Faro 15
2009
10 809 | APRIL 9452010 3,473 SUMMARY
Aromatic Short
0
0
0
0
0
0
0
0
0
JET 3
0
0
0
0
0
0
0
0
0
0
15
15
0
Togo Marshall
0
0
0
0
0
0
0
0
0
15
3
18
0
NERICA 1 (SAR-RICE 5)*
0
0
0
0
0
0
0
2
0
0
0
2
0
NERICA 2 (SAR-RICE 6)* Wakatsuki (Bouake 189)
0 0
0 0
0 0
0 0
0 0
0 9
0 0
3 0
0 0
0 0
0 0
3 9
0 0
IR 64
0
0
0
0
0
1
0
0
0
0
0
1
0
WAB
0
0
0
0
0
3
0
0
0
0
0
3
0
Bodia (ITA-320)
32
0
0
0
0
0
0
0
0
0
0
32
0
Other varieties Total
0 732
0 457
0 407
0 495
0 233
0 517
0 344
78 498
0 2,378
0 1,450
78 0 3,513 11,023
1
Source:
100
Compiled from raw data from Plant Protection and Regulatory Services Directorate (PPRSD), MOFA. * A project document of the NERICA Rice Dissemination Project indicates that 27 tons of certified seed of all types of NERICA were available for the 2006 cropping season, 60 tons for the 2007 cropping season, and 262 tons for the 2009 cropping season.
30
ANNEX 3 – RICE-PRODUCING DISTRICTS INCLUDED IN SURVEY SAMPLE ProducArea Yield tion (tons), cultivated (tons/ha), Main agroecological To- Irri- Lowland Upland avg. 2009– (ha), avg. avg. 2009– zones SUMMARY | APRIL 2010 tal gated rainfed rainfed 11 2009–11 11 21 Sample farmers interviewed
Sample rice-producing districts ASHANTI Ejura Sekyedumase
21
0
11
10
6,317
2,719
2.32
Transitional
EASTERN/GREATER ACCRA
39
Manya Krobo
19
8
10
20 147
20
0
1
2,890
1,033
2.80
Transitional
0
11,187
2,350
4.76
Coastal savannah
Gushiegu
21
0
19
2
4,801
3,782
1.27
Northern Savannah
Savelugu Nanton
21
Tamale
21
0
20
1
27,801
9,807
2.83
Northern Savannah
0
18
3
49,675
17,418
2.85
Northern Savannah
Tolon-Kumbungu (with Bontanga irrigation) West Mamprusi
42
17
21
4
33,239
11,534
2.88
Northern Savannah
21
0
21
0
13,983
4,776
2.93
Yendi UPPER EAST
Northern Savannah
21 168
0
21
0
6,353
3,152
2.02
Northern Savannah
Bawku Municipal Bolgatanga Bongo (with Vea irrigation)
21 21 42
0 5 26
21 12 16
0 4 0
15167 11,402 8,623
5,920 5,723 3,687
2.56 1.99 2.34
Northern Savannah Northern Savannah Northern Savannah
Builsa
21
4
16
1
23,342
9,457
2.47
Northern Savannah
Garu Tempane
21
0
21
0
7,679
3,558
2.16
Northern Savannah
Kassena Nankana (with Tono irrigation)
42
23
16
3
31,697
10,157
3.12
Northern Savannah
UPPER WEST
21 0
21
0
3,042
1,491
2.04
Northern Savannah
Ga Adangbe West (with Kpong irrigation) NORTHERN
Wa West
21
VOLTA
118
Hohoe
19
0
19
0
21,759
7,017
3.10
Transitional
Kadjebi
21
0
21
0
6,196
2,096
2.96
Transitional
Ketu (with Afife irrigation)
41
25
16
0
11,126
2,154
5.17
Coastal Savannah
North Tongu (with Aveyime irrigation)
36
22
14
0
6,610
2,063
3.20
Coastal Savannah
WESTERN
63
Bibiani Anhwiaso
21
0
19
2
1,878
1,610
1.17
Forest
Juabeso
21
0
21
0
4,006
2,523
1.59
Forest
Other Western districts Wassa West
*
*
Wassa Amanfi
11
0
11
0
1,677
1,410
1.19
Forest
*
3
0
3
0
1,876
1,397
1.34
Forest
*,**
7
1
6
0
576
151
394
31
Amenfi Central
Total (sample districts) Overall (Ghana) Sample as percentage of total for Ghana (%) Source:
Forest 312,325
116,833
2.66
449,973
180,411
2.49
69
65
CRI/SARI/IFPRI survey for sample farmers; SRID, Ghana, MOFA (2009–2011) for production data. * The selected district based on the proportional probability sampling was Wassa West. However, it was difficult to find rice-producing villages in this district even with the guidance of district MOFA. Despite official figures showing substantial rice production in the districts in 2009–2011, it was explained that livelihood patterns have changed, favoring small mining companies in place of rice cultivation. Only one village in Wassa West was found to have rice production. Two additional villages from surrounding districts (Wassa Amanfi and Amenfi Central) were then selected to complete the target of 21 sample farmers in that area. ** SRID, MOFA has no production data on Amensi Central.
ANNEX 4 – PROGRESS IN DEVELOPMENT OF IRRIGATION SCHEMES FOR RICE Location
Potential area (ha)
Developed area (ha)
Irrigation system – gravity (G) or pump (P)
Major crops cultivated
In survey sample?
Ashiaman Dawhenya Kpong Afife Aveyime Okyereko Nobewam Bontanga Golinga Kikam Tono
155 450 3,028 880 280 100 150 450 40 27 2,400
135 191 1,400 880 60 40 120 450 26 27 2,400
G P+G G G P+G P+G P+G G G P+G G
Rice Rice Rice and vegetables Rice and vegetables Rice Rice Rice Rice and vegetables Rice Rice Rice and vegetables
No No Yes Yes Yes No No Yes No No Yes
Vea
1,000
1,000
G
Rice and vegetables
Yes
Source:
SUMMARY | APRIL 2010
Adapted from Osei-Asare (2010).
ANNEX 5 – RICE PRODUCTION AND AREA COMPARISON OF TWO SURVEY DATASETS Variables Total area (ha)
National rice statistics, 2008*
Survey statistics, 2012**
Source:
Percentage of national total Percentage of national upland and lowland Total production (tons) Percentage of national total Percentage of national upland and lowland Avg. yield (tons/ha) Total area (ha) Percentage of national total Percentage of national upland and lowland Total production (tons) Percentage of national total Percentage of national upland and lowland Avg. yield (tons/ha) Proportion of sample farmers (%)
Rice cropping systems Lowland Upland rainfed Irrigated rainfed
All
18,750
93,750
10,200
122,700
15 17
76 83
8
100
18,750 6 8
224,700 78 92
45,900 16
289,350 100
1.00 40
2.40 467
4.50 117
2.40 624
6 8
75 92
19
100
54 4 7
694 57 93
481 39
1,229 100
1.43 6
1.66 67
3.89 27
2.25 100
* Ghana, MOFA and JICA (2008); ** CRI/SARI/IFPRI survey (November 2012–February 2013).
ANNEX 6 – AREA-WEIGHTED AVERAGE AGE OF IMPROVED RICE VARIETIES IN SELECTED COUNTRIES Country
Age without weight
Ghana* Based on DIVA project (Diagne et al. 2013) Benin Burkina Cameroon Central African Republic Côte d’Ivoire Democratic Republic of Congo Gambia Guinea Kenya Madagascar Mozambique Niger Nigeria Rwanda Senegal Sierra Leone Togo Uganda Based on Smale (1998) compilation Philippines Indonesia
Area-weighted average age
15
SUMMARY | APRIL 2010
6
5 13 7 2 12 8 9 11 7 3 13 6 9 7 2 27 6 8
7
9
5
8 3–4 10 or less
Source: * Calculated based on CRI/SARI/IFPRI survey (November 2012–February 2013). Calculations conducted were based on official varietal release year, although some varieties, such as Jasmine 85, have been by farmers even before this release year.
ANNEX 7 – DISTRIBUTION OF RICE VARIETIES PLANTED IN MAJOR SEASON 2012, BY FARMERS AND AREA, IN PERCENT Varieties CSIR-released varieties Jasmine 85/Gbewaa/Lapez (2009) Digang (also called Abirikukuo or Aberikukugu) (2002) GR 18 (Afife) (1986) GR 21 (1986) Sikamo/TOX 3108 (1997) NERICA 1 (2009) FARO 15 (1970s) Bodia (2010) Other varieties being evaluated (already in certified seed production) Togo Marshall Jet 3 Aromatic Short IR20 TOX 3107/Bumbaz NERICA 14
Percentage of total number of rice farmers All Irrigated Lowland Upland
Percentage of total rice area (ha) All Irrigated Lowland Upland
36.11 30.12
55.16 51.52
29.45 23.24
37.83 24.32
33.88 27.05
55.40 52.50
27.12 19.79
50.28 37.21
2.63
0.00
2.69
13.51
2.73
0.00
2.61
13.07
1.02 0.44 1.02 0.44 0.29 0.15
1.21 0.61 1.21 0.00 0.00 0.61
1.04 0.41 1.04 0.62 0.41 0.00
0.00 0.00 0.00 0.00 0.00 0.00
1.69 0.65 0.62 0.59 0.39 0.16
0.70 0.30 1.00 0.00 0.00 0.90
2.08 0.78 0.56 0.78 0.52 0.00
0.00 0.00 0.00 0.00 0.00 0.00
22.07
38.79
17.43
8.10
19.39
41.50
14.86
7.99
11.99 5.26 2.19 0.73 0.88 0.29
20.00 9.70 6.06 2.42 0.00 0.00
10.17 3.94 1.04 0.21 1.03 0.21
0.00 2.70 0.00 0.00 2.70 2.70
10.76 4.41 1.95 0.62 0.97 0.10
20.50 11.40 5.80 2.90 0.00 0.00
9.25 2.62 1.16 0.09 1.30 0.04
0.00 4.97 0.00 0.00 2.01 1.01
ANNEX 7 – CONTINUED. Varieties NERICA 9 WITA 7 Other varieties that came from MOFA but cannot be named Indigenous/traditional/local varieties Mandii (originally from Sierra Leone, introduced by MOFA in the 1970s) Agona Mr. Moore Anyofula (local aromatic rice) Viwonor (red rice) Paul/Adongadonga Mr. Harry Mugea Wariwari Gundigi Mu Abung/Abug Muikpong Anyanle Salma saa Local Perfume Siggle bag Bazolugu Pasilli Bunbasi Agondima Kanari Aliidu Nigeria Boache Zuyalenga Local 34 Other indigenous/ traditional/local varieties that cannot be named Farmers did not know variety Total Source:
Percentage of total number of rice farmers All Irrigated Lowland Upland 0.15 0.00 0.21 0.00 0.58 0.61 0.62 0.00
Percentage of total rice area (ha) All Irrigated Lowland Upland 0.06 0.00 SUMMARY 0.09 | APRIL 0.00 2010 0.52 0.90 0.48 0.00
5.99
4.85
6.64
2.70
4.80
2.30
5.59
3.02
34.51
1.21
44.61
51.35
40.14
0.90
49.90
38.73
11.40
1.21
14.52
16.22
19.05
0.90
24.40
10.06
2.34 1.75 1.46 1.46 1.32 1.17 1.17 1.02 1.02 1.02 0.88 0.58 0.58 0.44 0.29 0.29 0.15 0.15 0.15 0.15 0.15 0.15 0.15 0.15 0.15 0.15
0.00 0.00 0.00 0.00 0.00 0.00 0.00 0.00 0.00 0.00 0.00 0.00 0.00 0.00 0.00 0.00 0.00 0.00 0.00 0.00 0.00 0.00 0.00 0.00 0.00 0.00
3.32 1.87 1.87 2.07 1.66 0.21 1.66 1.24 1.45 1.45 1.24 0.83 0.83 0.62 0.41 0.41 0.21 0.21 0.21 0.21 0.21 0.21 0.21 0.21 0.21 0.21
0.00 8.11 2.70 0.00 2.70 18.92 0.00 2.70 0.00 0.00 0.00 0.00 0.00 0.00 0.00 0.00 0.00 0.00 0.00 0.00 0.00 0.00 0.00 0.00 0.00 0.00
3.27 2.01 1.75 0.52 1.94 0.94 0.78 0.57 1.04 0.94 1.16 0.45 0.32 0.62 0.13 0.17 0.26 0.19 0.26 0.19 0.06 0.02 0.06 0.03 0.16 0.04
0.00 0.00 0.00 0.00 0.00 0.00 0.00 0.00 0.00 0.00 0.00 0.00 0.00 0.00 0.00 0.00 0.00 0.00 0.00 0.00 0.00 0.00 0.00 0.00 0.00 0.00
4.38 1.82 2.08 0.69 2.34 0.17 1.04 0.67 1.39 1.26 1.55 0.61 0.43 0.82 0.17 0.23 0.17 0.26 0.35 0.26 0.09 0.02 0.09 0.04 0.22 0.05
0.00 10.06 2.01 0.00 3.02 12.57 0.00 1.01 0.00 0.00 0.00 0.00 0.00 0.00 0.00 0.00 0.00 0.00 0.00 0.00 0.00 0.00 0.00 0.00 0.00 0.00
4.82
0.00
6.85
0.00
3.21
0.00
4.30
0.00
1.32 100.00
0.00 100.00
1.87 100.00
0.00 100.00
1.75 100.00
0.00 100.00
2.35 100.00
0.00 100.00
CRI/SARI/IFPRI survey (November 2012–February 2013).
REFERENCES Acheampong, P. P., K. A. Marfo, and J. Haleegoah. 2005. Preliminary Baseline Survey Report on the Preferences for Local Rice in the Hohoe and Bibiani Districts. Report prepared for the Gatsby Charitable Foundation Project. Kumasi, Ghana: Crops Research Institute. SUMMARY | APRIL 2010 Alene, A., and J. Mwalughali. 2012. The Effectiveness of Crop Improvement Programs in Sub-Saharan Africa from the Perspectives of Varietal Output and Adoption: The Case of Cassava, Cowpea, Maize, and Soybean. Draft Technical Report: Measuring and Assessing the Impacts of the Diffusion of Improved Crop Varieties in Africa (DIVA). Ibadan, Nigeria: International Center for Tropical Agriculture (IITA). Amanor‐Boadu, V. 2012. Rice Price Trends in Ghana (2006–2011). METSS‐Ghana Research and Issue Paper Series No. 02‐2012. Accra, Ghana: Monitoring, Evaluation and Technical Support Services (METSS), United States Agency for International Development (USAID). Bam, R. K., F. K. Kumaga, K. Ofori, and E. A. Asiedu. 2006. “Germination, Vigour and Dehydrogenase Activity of Naturally Aged Rice (Oryza sativa L.) Seeds Soaked in Potassium and Phosphorus Salts.” Asian Journal of Plant Sciences 5 (6): 948–955. Bam, R. K., et al. 2010. “Release of Lowland Varieties.” Presentation to the Variety Release Committee. Kumasi, Ghana: Crops Research Institute. Brennan, J. P., and D. Byerlee. 1991. “The Rate of Crop Varietal Replacement on Farms: Measures and Empirical Results for Wheat.” Plant Varieties and Seeds 4: 99–106. Buri, M. M., R. N. Issaka, T. Wakatsuki, and N. Kawano. 2012. “Improving the Productivity of Lowland Soils for Rice Cultivation in Ghana: The Role of the ‘Sawah’ System.” Journal of Soil Science and Environmental Management 3 (3): 56–62. CRI (Crops Research Institute) and MOFA (Ministry of Food and Agriculture). 2005. Steps to Good Rice Production in the Lowlands, rev. ed. Kumasi, Ghana: CRI and MOFA, Inland Valleys Rice Development Project. Dalton, T., and R. Guei. 2003. “Productivity Gains from Rice Genetic Enhancements in West Africa: Countries and Ecologies.” World Development 31 (2): 359–374. Diagne, A., F. M. Kinkingninhoun-Medagbe, K. Sanni, and A. Toure. 2013. Diffusion of Improved Varieties in Africa: The Case of Rice Crop. Cotonou, Benin: Africa Rice Center. Diako, C., E. Sakyi-Dawson, B. Bediako-Amoa, F. K. Saalia, and J. T. Manful. 2010. “Consumer Perceptions, Knowledge and Preferences for Aromatic Rice Types in Ghana.” Nature and Science 8 (12): 12–19. ________. 2011. “Cooking Characteristics and Variations in Nutrient Content of Some New Scented Rice Varieties in Ghana.” Annals. Food Science and Technology 12 (1): 39–44. Faltermeier, L., and A. Abdulai. 2009. “The Impact of Water Conservation and Intensification Technologies: Empirical Evidence for Rice Farmers in Ghana.” Agricultural Economics 40: 365–379. Akramov, K., and M. Malek. 2011. Analyzing Profitability of Maize, Rice, and Soybean Production in Ghana: Results of PAM and DEA Analysis. GSSP Working Paper 28. Accra, Ghana: International Food Policy Research Institute. MiDA (Millennium Development Authority). 2010. Investment Opportunity in Ghana: Maize, Rice, and Soybean. Accra, Ghana: MiDA. MOFA (Ministry of Food and Agriculture). 2011a. Agriculture in Ghana: Facts and Figures (2010). Accra, Ghana: Statistics Research and Information Directorate, MOFA. ________.1993-2011. Raw data on production, area cultivated and yield on various crops. MOFA, Accra, Ghana. ________. 2012. 2012 Fertiliser and Seed Subsidy Programme Announced. Accessed on June 25 2013 at http://mofa.gov.gh/site/?p=10057 MOFA and JICA (Japanese International Cooperation Agency). 2008. The Study on the Promotion of Domestic Rice in the Republic of Ghana. Accra, Ghana: MOFA and JICA. NRI (Natural Resources Institute), University of Greenwich, UK. 2013. Contrasting Rice Value Chains: A Benchmarking Study of Rice in Ghana, Senegal and Thailand, Draft Report, Natural Resources Institute, University of Greenwich, UK. Osei-Asare, Y. 2010. Mapping of Poverty Reduction Strategies and Policies Related to Rice Development in Ghana. Nairobi, Kenya: Coalition for African Rice Development (CARD). Ragasa, C., Dankyi, A., Acheampong, P., Wiredu, A. N., Chapoto, A., Asamoah, M., Tripp, R. 2013. Patterns of Adoption of Improved Maize Technologies in Ghana. GSSP Working Paper, IFPRI, Accra, Ghana. SARI (Savannah Agricultural Research Institute). Undated. Manual on Quality Rice Seed Production. Tamale, Ghana: SARI. Smale, M., ed. 1998. Farmers, Gene Banks, and Crop Breeding: Economic Analyses of Diversity of Wheat, Maize and Rice. Boston: Kluwer Academic.
Tomlins, K. I., J. T. Manful, P. Larwer, and L. Hammond. 2005. “Urban Consumer Preferences and Sensory Evaluation of Locally Produced and Imported Rice in West Africa.” Food Quality and Preference 16 (1): 79–89. Vondolia, G. K., H. Eggert, and J. Stage. 2012. Nudging Boserup? The Impact of Fertilizer Subsidies on Investment in Soil and Water Conservation. Environment for Development (EfD) Discussion Paper Series 12-08. Gothenburg, Sweden: SUMMARY | APRIL 2010 University of Gothenburg. Winter-Nelson, A., and E. Aggrey-Fynn. 2008. Identifying Opportunities in Ghana’s Agriculture: Results from a Policy Analysis Matrix. GSSP Background Paper No. 12. Accra, Ghana: International Food Policy Research Institute.
About the Authors Catherine Ragasa and Antony Chapoto are Research Fellows, and Marian Asamoah is Research Assistant, in the Development Strategy and Governance Division of the International Food Policy Research Institute (IFPRI). Awere Dankyi is an independent consultant and formerly the head of the socioeconomics division of the Crops Research Institute (CRI). Patricia Acheampong is Agricultural Economist at CRI. Alexander Nimo Wiredu is Agricultural Economist and head of the socioeconomics division of the Savannah Agricultural Research Institute (SARI). Robert Tripp is an independent consultant who previously worked with the International Maize and Wheat Improvement Center (CIMMYT) and the Overseas Development Institute (ODI).
INTERNATIONAL FOOD POLICY RESEARCH INSTITUTE
2033 K Street, NW | Washington, DC 20006-1002 USA | T+1.202.862.5600 | F+1.202.457.4439 | Skype: ifprihomeoffice |
[email protected] | www.ifpri.org
IFPRI-ACCRA
c/o International Water Management Institute (IWMI) | PMB CT 112, Cantonments, Accra, Ghana | CSIR Campus (Opposite Chinese Embassy) | Airport Residential Area | T: +233-(0)21-7807163333 | F: +233-(0)21-784752 | gsss.ifpri.info This Working Paper has been prepared as an output for the Ethiopia Strategy Support Program, funded by USAID, and has not been peer reviewed. Any opinions stated herein are those of the author(s) and do not necessarily reflect the policies or opinions of IFPRI. Copyright © 2012, International Food Policy Research Institute. All rights reserved. To obtain permission to republish, contact
[email protected].